CPI

BTC - Video Top-Down Analysis 📹Hello TradingView Family / Fellow Traders. This is Richard, also known as theSignalyst.
Here is a detailed update top-down analysis for Bitcoin.
Which scenario do you think is more likely to happen? and Why?
Always follow your trading plan regarding entry, risk management, and trade management.
Good Luck!.
All Strategies Are Good; If Managed Properly!
~Rich

gold will make a pattern decline on two formation which will#XAUUSD pair have made a retest back to 1965 today after our selling target have hit, the pair have two circulation but the both have decline so now we wait for a clear wave pattern to know if gold will drop back below 1952 again but firstly if gold hit the 1970 limit in H3 then a possible rise will occur above 1979 which can hold on break more bullish but if the price decline then we expect the 1952 limit before a pull back below 1941 limit but today we expect the CPI to be higher than expected.

EURUSD before CPIThe first important news of the week coming up today.
We continue to look at the H1 trend reversal and buying opportunities.
On confirmation after the news and a good ratio, we will look for an entry with an initial target of 1.0940.
It is still possible to see stop hunting below the previous low of 1.0730.

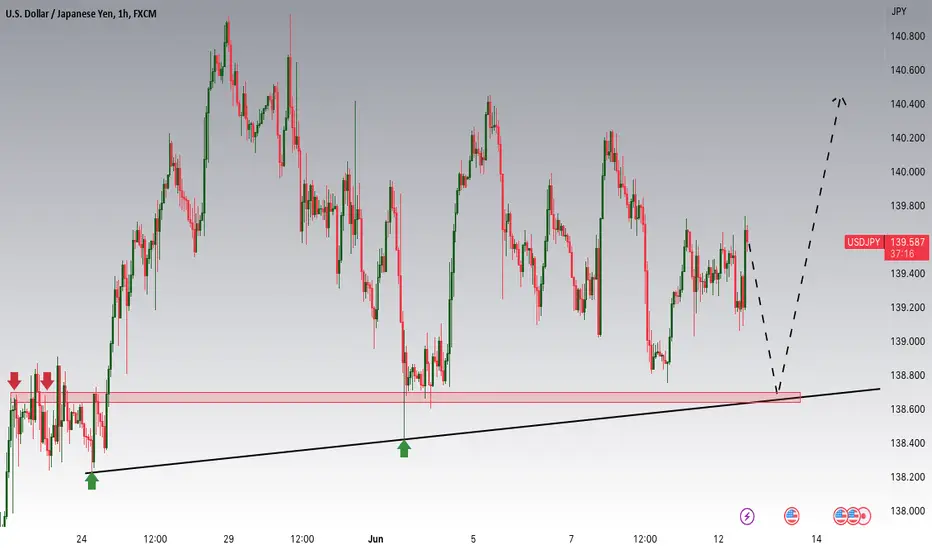
USDJPY: CPI and FOMC weekHey traders!
Today, our focus is on USDJPY, where we are observing a potential buying opportunity around the 138.700 zone. USDJPY is currently in an uptrend and appears to be approaching a significant support and resistance area at 138.700.
This week, we have two key events that could impact the market. First, on Wednesday, we have the Federal Open Market Committee (FOMC) meeting, where the Federal Reserve's monetary policy decisions will be announced. However, the day before the FOMC meeting, we have the release of the Consumer Price Index (CPI) data, which is important to gauge the Fed's next move and intentions.
If the CPI data shows high numbers, it may indicate the possibility of further rate hikes, signaling a bullish sentiment for the USD. However, if the CPI data comes in lower than expected, it could suggest that the Fed might delay rate hikes, potentially altering the previously anticipated long-term plan for the USD.
Therefore, keeping an eye on the CPI data before the FOMC meeting is crucial to understand the potential impact on USDJPY and adjust our trading strategy accordingly.
Trade safe, Joe.
An important week for EURUSDThe most important news coming up this week.
CPI data is due tomorrow.
We will se FED Interest rate decision on Wednesday.
On Thursday ECB is expected to rise interest rates again.
A proper money management and waiting for the right moment are extremely important when it comes to busy news week.
We’re currently looking at the options to reverse the H1 trend.

EURUSD Technical Analysis: Preparing for CPI and FOMC Impact.Hello Traders, In tomorrow's trading session, our focus will be on the EURUSD pair as we seek a selling opportunity around the 1.08 zone. Previously, EURUSD was experiencing an uptrend and successfully broke out of it. However, it is currently undergoing a correction phase and approaching the retrace area at the 1.08 resistance zone. It is important to also keep an eye on the CPI data scheduled for release next week, specifically on Tuesday. This data will serve as confirmation for the trade. If the CPI comes in above expectations, it suggests that the Federal Reserve still needs to work on increasing interest rates in their upcoming monetary policy by Wednesday, which could trigger further strength in the US dollar. On the other hand, if the CPI numbers are within expectations, this may lead to USD weakness as Federal Reserve Chair Powell may lean towards postponing a rate hike. Let's monitor the situation closely and trade wisely.
Trade safe, Joe.

USDCHF Weekly Forecast CPI | 4th June 2023Fundamental Backdrop
CPI m/m expected to increase 0.3% on Monday
Technical Confluences
Current resistance level at 0.90856
Next resistance at 0.92158
Near-term support level at 0.89876
Idea
If the CPI increases at 0.3% as expected or more, we could see the price break the current resistance at 0.90856, before heading towards the next resistance at 0.92158.
However, if the CPI decreases instead, we could see price drop and head towards the near-term support level at 0.89876
NOT FINANCIAL ADVICE DISCLAIMER
The trading related ideas posted by OlympusLabs are for educational and informational purposes only and should not be considered as financial advice. Trading in financial markets involves a high degree of risk, and individuals should carefully consider their investment objectives, financial situation, and risk tolerance before making any trading decisions based on our ideas.
We are not a licensed financial advisor or professional, and the information we are providing is based on our personal experience and research. We make no guarantees or promises regarding the accuracy, completeness, or reliability of the information provided, and users should do their own research and analysis before making any trades.
Users should be aware that trading involves significant risk, and there is no guarantee of profit. Any trading strategy may result in losses, and individuals should be prepared to accept those risks.
OlympusLabs and its affiliates are not responsible for any losses or damages that may result from the use of our trading related ideas or the information provided on our platform. Users should seek the advice of a licensed financial advisor or professional if they have any doubts or concerns about their investment strategies.

Data error Japan Tokyo CPI Ex Food And Energy (JPTCPIEFA) & JapHello good morning & good day to all! There seems to be an error for these 2 Japan econ data when we chart on Trading View, Japan Tokyo CPI Ex Food And Energy (JPTCPIEFA) & Japan Tokyo Core CPI (JPTCCPI).
Previously, these 2 data have been presented in index values but it seems that yesterday, their format has been changed to y/y % for the last 2 months but does not adjust prior historical data points to y/y.
Thus, right now, I cannot do any meaningful analysis of these charts. Wrote in about these errors and sent a ticket to Hep Centre but no reply.
Can anyone help over here? or is there a rep from Trading View here? Much appreciated. Thank you

Aussie unchanged ahead of Lowe, CPIThe Australian dollar is drifting lower on Tuesday. AUD/USD is trading at 0.6538 in Europe, unchanged on the day.
RBA Governor Lowe testifies before a Senate Committee later today. Lawmakers will likely press Lowe about rate policy and the battle against inflation. Earlier this month, the RBA shocked the markets by delivering a 25-basis point hike. At the April meeting, the RBA had paused in order to assess the effect of its aggressive rate-hike cycle, and the markets had expected another pause at the May meeting. Lowe will have to reassure the committee that the RBA is following a plan and is not zig-zagging between hikes and pauses.
Attention will quickly shift to inflation, with the release of Australian CPI on Wednesday. Inflation has been falling, and the downturn is expected to continue, with a consensus estimate of 6.4%, down from 7.0% prior. The RBA has pledged to bring inflation back down to its 2% target, but there's no doubt that it will be a long and bumpy road. The central bank meets on June 6th and is widely expected to pause and maintain the benchmark rate at 3.85%.
The US debt ceiling agreement is a done deal. Well, almost. President Biden and Republican Speaker McCarthy have reached an agreement in principle which must be ratified by both houses of Congress. Some Republicans have threatened to vote against the deal, but with overwhelming support from the Democrats, approval of the deal is very likely. The weeks of uncertainty prior to the deal weighed on risk appetite, and the big winners have been US Treasury yields and the US dollar.
There is resistance at 0.6665 and 0.6756
0.6525 is a weak support line, followed by 0.6434

EUR/GBP SHORT IDEANotice level 0.87000 highs, act as supply level
German gdp low UK cpi high
Boe seeking to keep rates higher longer
Price breaking level 0.86488 will give level 0.85800 demand level.

EURUSD Weekly Forecast | 29th May 2023Fundamental Backdrop
Last week, notably the German Flash Manufacturing PMI and French Flash Services PMI dropped a lot causing the EUR to weaken.
This week there's only the German Prelim CPI m/m which is also expected to decrease from 0.4% to 0.2%. This will cause the EUR to weaken further.
Technical Confluences
Near-term resistance level at 1.07350
Next support at 1.05340
Idea
We could see the EUR drop towards the support at 1.05340 by the end of the week.
NOT FINANCIAL ADVICE DISCLAIMER
The trading related ideas posted by OlympusLabs are for educational and informational purposes only and should not be considered as financial advice. Trading in financial markets involves a high degree of risk, and individuals should carefully consider their investment objectives, financial situation, and risk tolerance before making any trading decisions based on our ideas.
We are not a licensed financial advisor or professional, and the information we are providing is based on our personal experience and research. We make no guarantees or promises regarding the accuracy, completeness, or reliability of the information provided, and users should do their own research and analysis before making any trades.
Users should be aware that trading involves significant risk, and there is no guarantee of profit. Any trading strategy may result in losses, and individuals should be prepared to accept those risks.
OlympusLabs and its affiliates are not responsible for any losses or damages that may result from the use of our trading related ideas or the information provided on our platform. Users should seek the advice of a licensed financial advisor or professional if they have any doubts or concerns about their investment strategies.

NDX - The upcoming testI have done a lot of research over this past week.
Almost everyone is extremely bearish about stocks / assets in general.
Pretty much any indicator of sentiment that you look at indicates panic. In fact, we seem to have reached a record for fear levels.
In the 2008 financial crisis, there were frequent news reports about the housing slowdown by 2006. It was a well-worn issue by 2008, but most leading economists said that the housing market didn't have to be connected to the economy or stocks.
I mention 2008 because many of those who are bearish see that we are correlated heavily to the 2008 pattern. If we are, then around next week we should see a fast, substantial decline. However, at this point in the cycle, the crisis was obvious. Banks were actually going bankrupt. Some had been losing billions since Q1 2008.
Now, if we get a special surprise report or something, this could all change, but that is true of any market.
It seems to be a foregone conclusion that we will go lower. As you can see on the chart, we have cleared the swing low from June and have held below it. There is nothing further to look at... right?
The thing is that we have not had an adequate test of this downward move. The indices are down 6 days in a row. There seems to be no upside, even intraday.
Let's think about what it could look like if we suddenly rallied 10% in a day or something like that.
It would look like an obvious double bottom pattern on any longer-term chart, like a weekly chart. Last week's bearish pin bar doesn't have any effect on this. It would also coincide with September 2020 swing lows.
On the S&P index it looks even a bit stronger because it has not fully tested the lows from several days ago.
This sort of pattern could play out if we somehow get a bullish CPI reading, and we will find out in a few hours.
I also want to mention that during economic slowdowns, like the 1970s "stagflation," stock prices do poorly. However, during just periods of high inflation, stock prices do well - and they do a little bit better, on average, to account for inflation. If we get some sort of stable, 4% inflation environment, then your money is certainly safe in the stock market.
Right now, earnings have not come down. By this point in 2008, earnings growth was already negative year on year. Earnings growth for companies has slipped, but we are not even close to negative territory yet.
Everyone is expecting further bad things. However, for anything catastrophic to happen, there has to be either:
A real crisis like 2008 / 1973
Delusion like 2000 / 1929
Since everyone is so bearish about the upcoming CPI, you can expect that even a mediocre CPI could send the markets higher, which could also trigger that pattern I outlined above. A "good" (low) CPI would probably cause some enthusiasm (though this seems unlikely with today's producer price index)
The point is that the chance of the bear market coming to an end here is much higher than people anticipate, and we should be able to find out in a bit.
However, if we just keep going lower, this will prove that the crowd is always right and you can keep on selling. Good luck!

Frothy TimesLast Wednesday, inflation prints (CPI) came in below expectations of a ‘hot’ print which would have likely indicated that the Federal Reserve will continue tightening rates. Cryptocurrency and equities markets reacted positively while bond yields dropped. These numbers are expected to persuade the Fed to lean more towards a "pause" stance for its next FOMC meeting in June.
Meanwhile, markets are still concerned about the debt ceiling crisis as negotiations have not shown much progress as of yet. Despite the name, this crisis is actually more of a political issue as it hinges on a piece of must-pass legislation which would allow the federal government to increase its borrowing to fund its spending obligations. The Democrats currently have control of the Senate, while the Republicans have gained a majority in the House of Representatives. As such, they have used the debt ceiling as a political bargaining chip, pushing for cuts on what they deem as "irresponsible spending". Unless a compromise is reached, it’s likely that caution will echo throughout markets. Currently, the U.S. is forecast to hit its debt limit in early June. If the United States defaults on its debt for the first time in history, tens of billions of dollars in payments for Social Security benefits, payments to Medicaid providers, federal salaries, veterans' benefits, and other programs could potentially be at risk. As a result, investors are finding it challenging to decide on a trade amidst the uncertainty surrounding the debt default and resolution. Macroeconomic theory would predict that a resolution to increase the debt ceiling would reign in government spending, thus putting downward pressure on bond yields, thereby making the purchase of bonds at the current yields more attractive. Additionally, S&P500 earnings yields currently sit around 5.5% while risk-free 1-month U.S. Treasury Bills are paying the same. This makes holding stocks potentially less enticing to many investors and could serve as a rationale for shorting equities.
From a technical perspective, since Bitcoin lost the $30K level, it has proven difficult to reclaim. The market has tested the level twice and has so far struggled to break it. In order for the next leg up to commence, Bitcoin will first need to reclaim $30K. In our previous market update, we noted the convergence of MA9 and MA50, signalling a potential crossover. Last Tuesday, that crossing finally occurred. When a fast moving average (MA9) crosses below a slower moving average (MA50), markets perceive it as a bearish signal. Another important indicator to take a look at is the MACD. Last week, it remained relatively neutral. Although the MACD line has been below its signal line, the spread between them has been quite small, represented by the short bars on the histogram. However, recently the two lines have begun to diverge. This is another bearish signal. The last time this happened, Bitcoin lost $30K and fell towards $27K. Although technical indicators aren’t always accurate at predicting market direction, most indicators are pointing towards an increase in bearish momentum across the crypto market in the coming days.
Finally, over recent weeks, the market has seen a variety of meme coins rally upwards. During phases of cycles, ‘meme coin season’ has often served as an indicator of a local top. Back in 2021, shortly after Doge reached its all-time high, Bitcoin capitulated from $60,000 to around $30,000. With this 'silly season' firmly upon us, current market sentiment feels rather frothy.

SP500 - Waiting for a bullish reaction. Hello traders,
We are expecting a bullish continuation for SP500, but we have to pay close attention to the price action. Overall the trend is bullish and we expect this consolidation to end soon.
There is a chance that the price might continue making local lower lows, but we won't be interested in that and we will only focus on the buy setups.
More detailed information is in the video. We will also keep you posted in the comment section if anything occurs.
Trade with care.

CAD CPI could trigger next wave downThe previous CAD CPI data marked a significant turning point, with CAD having a 2 week hangover and the basket of major currencies getting a wild ride against the weakened CAD.
Could we see the opposite this time around? USD is seeing significant strength against the basket but is starting to look ripe for a pullback. If we see another strong day for USD on monday, pushing USDCAD into the cluster of pre vious activity between 1.36000 - 1.36500, we could be primed for a significant pullback in USD strength and the CAD CPI might just be the catalyst for a major leg down to back below 1.34500.
Of course, don't trade blindly, wait to see if the setup occurs, see the CPI numbers and how the market reacts. This is a very specific scenario, but if we are in that 1.36000 range when the numbers are released Tuesday, I'll be very quick to enter short if the market sees intraday downside momentum.

GBPUSD Plummets after 12month HighAfter briefly breaking the 12-month high from May 2022 of 1.26670 this week, a wave of selling came in amid a big news week.
The Bank of England (BoE) jacked up the UK Bank Rate to 4.5%, marking the 12th hike in a row. Despite two dissenting votes, the committee expects more tightening if price pressures persist. This could mean the rate peaking around 4.75% by the end of 2023.
BoE expects the UK's inflation to drop sharply from April, but that they are ‘continuing to address the risk of more persistent strength in domestic price and wage setting, as represented by the upward skew in the projected distribution for CPI inflation.’
Meanwhile, BoE's forecast for UK growth is cautiously upbeat, predicting flat growth in the first half of the year and a slight uptick after that.
Over in the States, the US Dollar gained strength headed into the weekend as investors look for safety amid uncertainty. This comes after a regional US bank, PacWest, reported a substantial 10% deposit drop and the Michigan Consumer Sentiment report came in weak.
From a technical perspective, tapping new highs briefly but failing to hold, leading to a sharp sell-off and retracing 2 weeks worth of gains in 2 days could signal a significant shift for the Cable ahead. We've seen a clean downside channel break, and - while a retracement seems likely after such volatile selling into the weekend - lower highs and lower lows could be the blueprint for the days and weeks ahead.

EURUSD - A review of this week's newsWe're beginning to see a Tale Of Two Economies emerge, as US data this week shows the path of disinflation continues, albeit slowly, giving investors hope that the Fed's interest rate increases are making an impact. Meanwhile across the pond, all quotes from the ECB are warning that the fight against inflation rages on and further rate hikes will be coming.
However, one major factor hanging over the Dollar is the news that there is "significant risk", according to the CBO, that the US won't be able to pay all of it's obligations as soon as the beginning of June, leading to the possibility of a default unless Congress votes to raise or suspend the Debt Ceiling.
From a technical perspective we see EURUSD failed a number of attempts to break through at the highs and has now begun to create lower highs and lows with it's violent moves down in recent days. Key trendlines and support levels have been broken and all signs point to the countertrend move having begun. While we appear overextended on lower timeframes, it may be prudent to wait patiently for a new lower high for a viable short entry.
It seems likely that we're witnessing a breakout to the upside on the DXY combined with profit taking and shift in sentiment for the Euro due to continued inflationary pressure in contrast to US inflation.
United States (US):
US CPI YoY 4.9% (Forecast 5%) : Consumer prices rose 4.9% on an annual basis, below forecast.
US Core PPI YoY Actual 3.2% (Forecast 3.3%, Previous 3.4%): The US core Producer Price Index (PPI) rose by 3.2% year-on-year, slightly below the forecasted 3.3%.
US PPI MoM Actual 0.2% (Forecast 0.3%, Previous -0.5%): The US Producer Price Index (PPI) increased by 0.2% on a monthly basis, slightly below the forecasted 0.3%.
US Initial Jobless Claims Actual 264k (Forecast 245k, Previous 242k): The number of Americans filing for initial unemployment benefits rose to 264,000, exceeding the forecasted 245,000. This increase suggests ongoing challenges in the US job market.
The “single biggest threat” to the economy now is the US hurtling towards a default on its obligations, said Karine Jean-Pierre, press secretary.
European Central Bank (ECB):
ECB: Consumers see 5% inflation over the next 12 months vs 4.6% in February : The European Central Bank (ECB) reports that consumers in the Eurozone expect inflation to reach 5% over the next 12 months. This represents an increase from the previous estimate of 4.6% in February, reflecting growing concerns about rising prices.
ECB's Nagel says the "latest interest rate hike won't be the last".
ECB's Lagarde spoke on Thursday, saying "the fight against inflation isn't over".

April's CPI Surprise: Can Bulls Charge Forward For Now?SPDR S&P 500 FUTURES ( CME_MINI:ESM2023 ) & ETF ( AMEX:SPY ) - Market Update - 10/10/23
The April Consumer Price Index (CPI) report showed a 0.4% increase last month, driven by rising shelter, used vehicle, and gas prices. This increase met Wall Street expectations, and the annual inflation rate of 4.9% came in slightly below estimates, providing hope for a lower trend. For workers, real average hourly earnings, adjusted for inflation, rose 0.1% for the month but were still down 0.5% from a year ago. These CPI figures provided a stick save for ES_F.
A massive 60-point range started with a failed breakout at 4176, and ES_F tested the overnight low, flushing to the 4114 support level. An intraday bull flag formed at the 4118-4123 support zone, with bulls getting long at the 4129-4134 range. A broadening formation (megaphone) pattern emerged at 4114, with resistance at 4176-4180. The rising uptrend channel from the March 2023 low is highlighted in yellow, establishing new support at 4134.
Bull Case:
On any pullback, look for re-entry to go long at the 4145-4146 level. If we move above 4145, the new magnet zone is 4176-4181. The 4166 support level is also a good magnet.
Bear Case:
On any pullback, look for re-entry to go short below 4134.
Economic Factors:
Keep an eye on the PPI-Final Demand and Jobless Claims data released at 8:30AM (EST) today.
Bonds:
The US10Y supports the bull case on the 4-hour chart with a new lower low. A symmetrical triangle pattern with a 5-day rising support range is visible, extending from 3.0308% to 3.311%.
Support Levels:
4134-32 (major), 4122, 4114-16 (major), 4111, 4105, 4092, 4082-78 (major), 4061, 4048 (major - broadening formation support), 4037, 4020-22 (major), 4011 (major), 3997, 3984 (major), 3978, 3952 (major), 3942, 3935 (major), 3904 (major), 3892 (major)
Resistance Levels:
4146 (major), 4154, 4166, 4176-81 (major, broadening formation support), 4188-92 (major), 4200, 4210, 4218-20 (major), 4230 (major - broadening formation support), 4243-46 (major), 4256
Final Thoughts:
As the market continues to digest April's CPI surprise, traders should remain vigilant and watch key support and resistance levels. The bull case still has potential, but it is crucial to monitor economic factors, such as PPI-Final Demand and Jobless Claims data, as well as bond market developments.
Not Investment Advice:
Please note that the information and strategies shared in this newsletter are for informational and educational purposes only. They should not be considered investment advice, nor should they be used as a basis for making any investment decisions. Always consult a financial professional before making any investment decisions, and ensure you understand the risks involved in trading and investing.

CPI Hacks ! GOLD 500 pips SELLGold 500 pips Sell if we reach OR All time highs.
We all know that CPI red folder news is one of the biggest news events for GOLD. It is highly volatile, however we can capitalise on what we know so far.
IF Gold comes up to our highs, there is a very HIGH chance it will reverse giving us a 500 pip move back down to support levels.
Lets go ENABLE CHEAT Codes and SELL !

EURUSD awaiting breakout EURUSD has been moving sideways for a whole month now.
Yesterday we saw another pullback from the support during the CPI news.
Now it is important to see a breakout to confirm the direction.
While we are in the sideways movement we are more likely to head back to the 1.1090 resistance.
We will receive confirmation when closing above the candle from yesterday's news.
On a breakout and test of 1.0940, we will look at selling opportunities.

Key Levels and US Market Review for the Asian session open 11/05Markets came under pressure in European and US trade although there remains some bulls happy to provide support to big tech and the Nasdaq. US inflationary CPI data came out relatively inline with expectations which, to me, highlight the continued 'sticky inflation' concerns. The US futures initially reacted higher to trap some buyers into the US open but then the indexes moved lower and give back the opening gains. I expect that the market will remain tentative as the USD holds major support, and Copper and Oil show concern for global demand.
Expecting a relatively flat open for the ASX200 and Hang Seng while the Nikkei is set to open slightly weaker off major resistance.
If inflation is truly remaining 'sticky', coming economic data will be the major focus and I expect this will translate to choppy markets or further pressure from sellers looking to lock in some gains.
Some KEY ACTIONABLE LEVELS into the Asian market session. Review of the European and US sessions and what that will mean to the price action in the near term along with key levels to watch.
Markets covered :-
DOW
Nasdaq
DAX
FTSE
ASX200
Hang Seng
USD Index
Gold
Oil
Copper

QQQ & Nvidia Stock Rising Wedge Resistance | CPI | GOOGL Event - NASDAQ:QQQ rising wedge pattern hitting resistance top this morning,
- NASDAQ:GOOGL 's AI event helped market bounced off todays intra-day low
- GOOGL talked about NVDA a little in its event making NVDA pop a little bit
- NASDAQ:NVDA also close to its top of the rising wedge
- CPI came in 4.9% estimate was 5% so came in slightly cooler
- PPI and jobs data tomorrow 8:30am EST
