Tokyo Core CPI ScenarioTokyo Core CPI data will be released in about 2 hours, and I am expecting the news to favor the Yen triggering a short. A price above 133.000 signals potential bullish motion.
Sell Entry: 132.200
Targets: 131.900 | 131.650 | 131.475 | 131.300 | 131.050 | 130.850 | 130.620
Support: 130.400
Resistance/SL: 133.000
Please be sure to like this post and comment below, and give me a follow if you already arent!
CPI

USDCHF Potential Forecast | 3rd April 2023Fundamental Backdrop
1. CHF CPI m/m increased by 0.2%, much lower than the forecast 0.4% and previous 0.7% m/m.
2. The softer print of CPI shows that inflation has been slowing down at a much faster rate which could signify a dovish landing on the SNB.
3. Market Open on Dollar has been very bullish, however, with NFP lurking this week, expect plenty of volatility in the market.
4. USD ISM Manufacturing PMI releasing later on in the day and market has been pricing in a 47.5 compared to 47.7 previous.
Technical Confluences
1. H4 resistance level at 0.921.
2. H4 support level at 0.9085.
3. Price could potentially retest the resistance level at 0.921.
Idea
Given the weak CPI reading on CHF, there is a weak bullish outlook on USDCHF as upcoming ISM news on USD is also slated to be a softer print.
NOT FINANCIAL ADVICE DISCLAIMER
The trading related ideas posted by OlympusLabs are for educational and informational purposes only and should not be considered as financial advice. Trading in financial markets involves a high degree of risk, and individuals should carefully consider their investment objectives, financial situation, and risk tolerance before making any trading decisions based on our ideas.
We are not a licensed financial advisor or professional, and the information we are providing is based on our personal experience and research. We make no guarantees or promises regarding the accuracy, completeness, or reliability of the information provided, and users should do their own research and analysis before making any trades.
Users should be aware that trading involves significant risk, and there is no guarantee of profit. Any trading strategy may result in losses, and individuals should be prepared to accept those risks.
OlympusLabs and its affiliates are not responsible for any losses or damages that may result from the use of our trading related ideas or the information provided on our platform. Users should seek the advice of a licensed financial advisor or professional if they have any doubts or concerns about their investment strategies.

GBPJPY Technical Analysis 31.03.2023 1h chart– Previous Daily candle closed Bullish at 164.230 above Daily Resistance formed on 28th February 2023.
– Buys on close above 164.470 targeting Weekly previous Support formed on 5th December 2022 at 164.470, Leaving Runners to the 1h previous Support formed on 28th February 2023 at 165.420.
– Sells on close below 163.930 targeting 1h Support at 163.560, Leaving Runners to the 4h Support formed at 163.200.
– As the Monthly candle coming to a close it is highly recommended to wait for strong confirmations and volume sessions before taking any positions.

AUDUSD Outlook 29 March 2023The AUD CPI y/y was released at 6.8% (Forecast: 7.2% Previous: 7.4%) which indicates a significant slowdown in inflation growth for the Australian economy.
Following the data release, the AUDUSD traded slightly lower from 0.6710 down to 0.6690, as the slowdown in inflation growth signaled the increased potential for the RBA to pause on future rate hikes. However, with inflation at 6.8%, this is still high above the RBA's 2% target level.
As the AUDUSD trades along the 0.67 price level, the price could continue to consolidate along the round number level, with the upward trendline supporting a breakout to the upside, especially if the DXY continues to weaken.

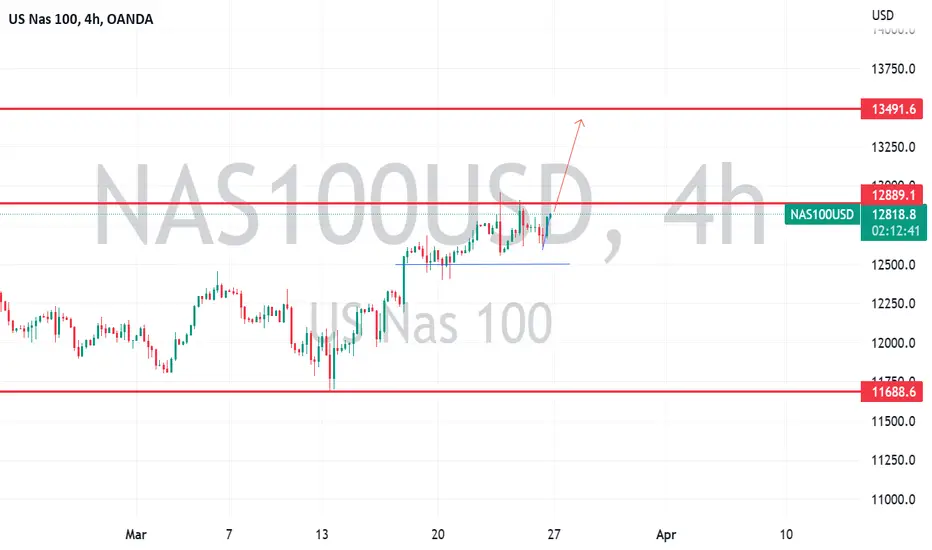
NAS100 TRADE IDEANAS100 closed last week at +9.8%. We may have retracement before we see NAS100 break above 12900 to continue a bullish run.
Levels discussed during the webinar 22nd March22nd March
DXY trade lower, break 103 to 102.60
NZDUSD: no trade, middle of s/r
AUDUSD: break 0.67 buy to 0.6730 SL 10 TP 20
USDJPY: buy above 133 SL 90 TP 180
GBPUSD: buy 1.2315 SL 30 TP 80
EURUSD: upside and downside potential, watch the video
USDCHF: sell below 0.92 SL 35 TP 90
USDCAD: sell below 1.3550 SL 30 TP 70
GBPJPY: buy above 163 SL 30 TP 90
GOLD: trading lower but looking for bounce at respective support levels to buy

GBPUSD Outlook 22 March 2023Yesterday, the GBPUSD traded up to approach the 1.23 price area, a high last reached on 15th February.
However, as the move was quickly reversed as the GBPUSD retraced to retest the 1.22 price level again.
As the price failed to break below the support level and maintains above the upward trendline, the GBPUSD is likely to continue with its upward momentum.
UK CPI data is due to be released today and is expected to signal a slowdown in inflation growth. While this might provide some short term price volatility, which could see the GBPUSD trade slightly lower, the BoE interest rate decision is still due tomorrow. The BoE is expected to increase rates by 25bps as it continues to target bringing inflation down to the 2% target level.
Look for the GBPUSD to continue trading higher, to retest the 1.23 round number high, with the major key resistance level at 1.24.

update result on nas100guys keep following for this kind of crazy movies if the chart is doing this i am on it

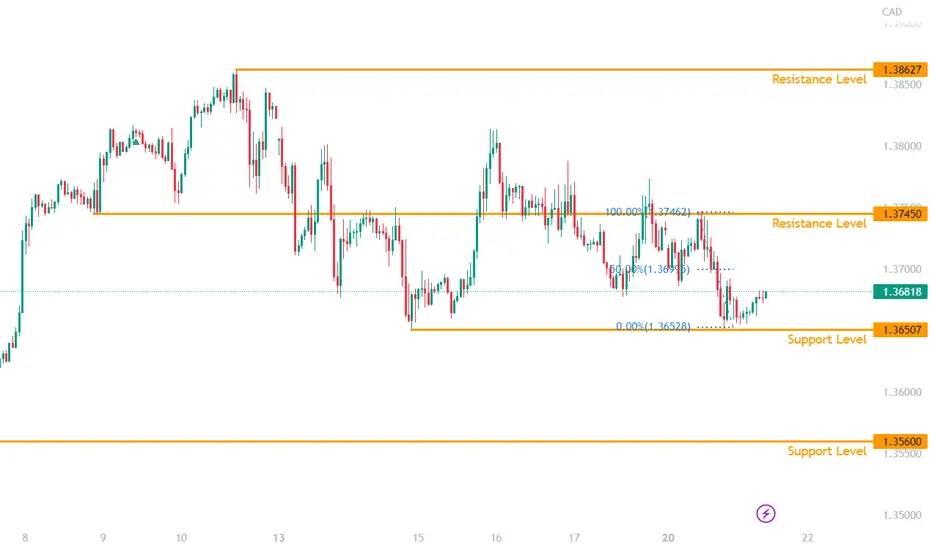
USDCAD Outlook 21 March 2023The USDCAD traded lower through the trading session yesterday as the DXY continued to weaken. The price reversed from the 1.3745 resistance level, down toward the key support level of 1.3650.
Today, the Canadian CPI is due to be released and is expected to indicate a slowdown in overall inflation growth with the Median CPI y/y (Forecast: 4.8% Previous: 5.0%) and the Trimmed CPI y/y (Forecast: 4.9% Previous: 5.1%).
Recently the Bank of Canada paused on its rate hikes, to allow time for the effects of the previous rate hikes to be reflected.
A slowdown in inflation growth would be supportive of their recent decision to pause and could reinforce a continuation of the decision. This could result in some strengthening of the Canadian dollar.
The USDCAD is likely to retrace to test the 1.37 round number level and 50% Fibonacci retracement level. However, if the USDCAD breaks below 1.3650, the next key support level would be at 1.3560.
triangle breakout on GOLDhello traders this happened today it is possible to catch this moves almost all the time on gold it works on gold pretty much all the time if you wann learn keep following

Gold Shines amid Global Financial DistressCOMEX: Micro Gold Futures ( COMEX_MINI:MGC1! )
Gold prices surged Friday as a wave of banking crises shook global financial markets. Spot gold climbed 3.1% to $1,977.89 per ounce, its highest level since April 2022. Gold price is now within $100 of its all-time high of $2,074.88.
In the futures market, the nearby April contract of COMEX gold futures settled at $1,973.5, where the far-month June 2024 contract closed at $2,076.9.
The year-long Fed rate hikes cracked the US banking system. Within two weeks, we have witnessed the collapses of Silvergate Bank and Silicon Valley Bank in California and Signature Bank in New York. First Republic Bank, a mid-sized bank in California, received $30 billion emergency injection from 11 largest American banks, led by JP Morgan.
Interestingly, it was J.P. Morgan who organized a $30 million rescue plan to avert the collapse of Wall Street in 1907. That crisis led to the creation of Federal Reserve System.
A century later, the cost of bank bailout increases by 1,000 folds. However, bank runs have already spread. Credit Suisse, a prestigious investment bank, is under distress. On Sunday evening, fellow Swiss bank UBS announced that it is acquiring Credit Suisse.
Gold Price Rises in Times of Major Crises
In the past two decades, gold price peaked in times of market turbulence.
• The 2008 financial crisis
• The 2010 European debt crisis
• The 2018-19 US-China trade conflict
• The outbreak of COVID pandemic
• The Russia-Ukraine conflict
• The March 2023 bank run
Gold price is also negatively correlated with the US dollar. Last year, when Dollar rose on the back of Fed tightening, gold took a beating. Now, as investors expect the Fed to slow rate hikes, gold shines through the chaos.
Investing in Gold: what in there for you?
• Diversification: Gold helps reduce the overall risk of your portfolio by providing a hedge against inflation and currency devaluation
• Tax efficiency: Long-term capital gains on gold investments are taxed at a maximum rate of 28%, which is lower than 37% for other long-term capital gains
• Protection against rising prices: Gold has historically been a good hedge against inflation, and it can help protect your purchasing power
• Liquidity: Gold ETFs and Gold Futures are highly liquid financial instruments. Many brokers also buy and sell gold bars and gold coins, with a commission.
• Hedge against difficult economic conditions: Gold is a global store of value, and it can provide financial cover during geopolitical and economic uncertainty
• Portfolio diversifier: Gold can act as a hedge against inflation and deflation alike, as well as a good portfolio diversifier
In a previous writing, I showed that gold did not work well as a hedge against inflation.
However, gold holds up extremely well during major crises where other assets lost value.
Hedging against Known and Unknown Risks
Risk on, gold goes up. Risk off, gold declines. Some risks are expected, while others come as a surprise.
Fed rate actions are scheduled events and can be considered known or expected risk. CME FedWatch Tool shows the likelihood that the Fed will change the Federal target rate at upcoming FOMC meetings. It analyzes the probabilities of changes to the Fed rate and U.S. monetary policy, as implied by 30-Day Fed Funds futures pricing data.
As of March 19th, FedWatch estimates a 38% chance of Fed keeping the current rate unchanged at 450-475 bp, and 62% odds of increasing 25 bp to 475-500 bp.
By providing $300 billion in emergency lending to member banks, the Fed has effectively put Quantitative Easing at work. In my opinion, the Fed has switched its priority from fighting inflation to crisis management. Managing the systemic risk in the US banking system outweighs the battle against inflation at this time. It’s a matter of priority.
What’s unknown is the potential failure of any bank not yet exposed in the news. US banks are estimated to sit on unrealized loss in hundreds of billions of dollars in their bond portfolio, largely consisted of Treasury and US agency bonds. As the “held-to-maturity” asset will be sold or marked down, these banks could run into trouble by a run of depositors and investors. In this unusual time, no news is good news.
Short-term Trading Strategies
The upcoming FOMC meeting on March 22nd make a compelling reason for event-driven trades on Micro Gold Futures.
Here is my logic:
• If the Fed keeps the rate unchanged, stock market would rally. As a major risk is removed from the financial system, gold price would fall
• If the Fed raises 25 bps, stock market would fall, and gold price would rally, potentially breaking the current record high
Micro Gold Futures (MGC) contract has a notional value of 10 troy ounces. At $1,993.4, an April 2023 contract (MGCJ3) is valued at $19,934. Initiating a long or short position requires a margin of $800. This is approximately 4% of contract notional value.
If gold price moves up to $2,050, a long futures position would gain $566. Relative to the initial margin, this would equate to a return of +70.8%, excluding commissions.
If gold price moves down to $1,900, a short futures position would gain $934, a theoretical return of +116.8%.
Unexpected market event could be a trigger for gold price to rally. An event-driven trade idea could be constructed around it. In my opinion, comparing to the distress of regional banks, the systematic risks triggered by a Big Bank failure could send global market in shock at ten times the magnitude. If the Fed raises rate next week, I expect more bank failures to coming in the next few months.
Happy Trading.
Disclaimers
*Trade ideas cited above are for illustration only, as an integral part of a case study to demonstrate the fundamental concepts in risk management under the market scenarios being discussed. They shall not be construed as investment recommendations or advice. Nor are they used to promote any specific products, or services.
CME Real-time Market Data help identify trading set-ups and express my market views. If you have futures in your trading portfolio, you can check out on CME Group data plans available that suit your trading needs www.tradingview.com

DXY Outlook 20th March 2023Through last week, the DXY traded with significant volatility due to not only the Silicon Valley Bank (SVB) collapse but also the slowdown in US inflation growth, with US CPI being released at 6% (Previous: 6.4%).
As the downward pressure continues on the DXY, a brief retracement to the upside could be anticipated however, the 23.60 and 38.20 Fibonacci levels are likely to provide strong resistance.
Look for the DXY to possibly trade lower toward the 103.50 support level after the current retracement/consolidation. If the price breaks beyond 103.50, the next key support level is at 102.60.
Price could trade in a consolidation manner with some choppy action with the FOMC rate decision due this week (25bps rate hike expected)

nas100 weekly analysis hello traders new week new opportunity this is for Nas100 weekly analysis i will also update if there is some scalp setups on a daily basis just keep following lets make money

Happy CPI day! (AUDUSD Trade idea)Happy CPI day! (AUDUSD Trade idea)
Hello...Another day, another trade opportunity!
Today we have the CPI, I spoke about banks over the weekend and how they will become under pressure to rates increase, it's part of debt cycle - I will recommend you watch it as well research into what a debt cycle is and what assets get affected. Now, headlines bring in fear, in my person opinion, technically JPM was bearish pattern and it break to down side, that's when I use the classic line ' Trade what you see, not what you think'. Ignoring the noise everyday is key! It wasn't major deal we not going back to 2008! The Feds have improved as time goes by there are tools! That's another aspect you should research into! Now that's all over done with and was sorted on the weekend Sunday evening. Now we did see dollar decline and GBP, EUR, NZD headed higher AUD is lacking the momentum, there are several factors why as we see copper range bound, AUD this week unemployment rate but today we do have CPI which could edge this certain pair either direction. A good set up to trade would be AUDNZD.
Estimated to be CPI y/y: 6.0% Banks has there view of it being in-line. Now, if we look at CME rate basis %, the risk of 50 basis point is declining and 25 maybe priced in but for the feds to hike even further that's declining as well.
Technically AUD: RANGE for now.
Within range, at key trendline resistance a break above I expect 200 EMA to be target areas. If we break below the key support areas of 0.65750 areas then I expect 0.64700 areas.
Trade Safe!
Trade Journal

DXY:The dollar seems to gain it original value after a mix CPIHey Traders, DXY was trading in a downtrend, but after a mix CPI the dollar managed to breakout massively the trend and now seems to form a bull flag. in today's trading session i will be monitoring DXY for a potential retrace of the trend around 104 Supply and Demand zone.
Trade safe, Joe.

CPI Should've taken us Above 1.07371 Daily Level ?My expectations for EU Bulls and CPI data missed. Even though my bias is still Bearish on EU as long as we hold below 1.07371 on the 4hr, I Would've liked to see Bulls prove me wrong and take us up to the next 4hr level at (1.07625) This did not happen.

AUD/USD falls ahead of employment reportThe Australian dollar, which has posted strong gains early in the week, has run into a wall on Wednesday. In the European session, AUD/USD is trading at 0.6638, down 0.66%.
Australia releases the February employment report on Thursday (Australia time). Job growth is expected to rebound, with a consensus of 48,500 after a soft January read of -11,500. The unemployment rate is expected to tick lower to 3.6%, down from 3.7%. The Reserve Bank of Australia will be watching closely, as a robust labour market has enabled the central bank to continue its tightening - the Bank raised rates last week by 25 basis points, a 10th straight hike which brought the cash rate to 3.60%. The good news is that the end of the tightening cycle could be near, with the markets pricing in a pause at the April meeting. Consumers and businesses are weary of rising interest rates and confidence indicators do not paint an optimistic picture.
Along with the job data, Australia releases consumer inflation expectations for March. The markets are braced for the indicator to rise to 5.4%, after a 5.1% gain in February. Inflation expectations is a key inflation gauge as it can set the direction of actual inflation, and the RBA will not be happy if inflation expectations accelerate.
There is an uneasy calm in the air as the dust begins to settle after the Silicon Valley Bank collapse. The sky is not falling, not even above US bank towers, as regional bank stocks have rebounded. The US inflation release on Tuesday delivered as expected, with both the headline and core CPI readings matching the estimates. Headline CPI fell to 6.0%, down from 6.4%, while the core rate ticked lower to 5.5%, down from 5.6%. Inflation is cooling but we're not seeing the disinflation process that the markets were celebrating only a few weeks ago.
AUD/USD is testing support at 0.6639. Below, there is support at 0.6508
0.6713 and 0.6844 are the next resistance lines

BTC CPI 14/03/23 continued pt.3CPI came in as expected and so the orange path line played out almost perfectly.
BTC on the HTF just printed a swing fail structure and therefor in theory should be bearish, however it's not so simple with everyone feeling that way about it we could get one last push up towards 28k beforehand.

EURUSD after CPIEURUSD after ICP
The news has passed but there were no good entry opportunities.
No new trades at the current levels as well.
Pullback from the support level at 1,0600 is needed in order to get into buys.
No grounds for sell trades too, at the moment!
That’s why it’s better to wait for the development and to look at another instruments meanwhile.
Tomorrow the interest rates from the ECB will be published, which will also have an impact.


XAUUSD Potential Forecast | 15th March 2023Fundamental Backdrop
1. Market sentiments has shifted bearish for the USD
2. With the ongoing Silicon Valley Bank crisis, USD has been very volatile and there has been plenty of fear with the USD.
3. This sets the path for further bearish pressure on the USD.
Technical Confluences
1. Extremely strong bullish pressure can be noticed on the GOLD chart.
2. Price has already came up >800 pips since the lows.
3. Previous bearish structure has all been shifted bullish.
4. Price can potentially break the previous high at 1959.6.
Idea
Anticipating price to form a new higher high at 1959.6.
NOT FINANCIAL ADVICE DISCLAIMER
The trading related ideas posted by OlympusLabs are for educational and informational purposes only and should not be considered as financial advice. Trading in financial markets involves a high degree of risk, and individuals should carefully consider their investment objectives, financial situation, and risk tolerance before making any trading decisions based on our ideas.
We are not a licensed financial advisor or professional, and the information we are providing is based on our personal experience and research. We make no guarantees or promises regarding the accuracy, completeness, or reliability of the information provided, and users should do their own research and analysis before making any trades.
Users should be aware that trading involves significant risk, and there is no guarantee of profit. Any trading strategy may result in losses, and individuals should be prepared to accept those risks.
OlympusLabs and its affiliates are not responsible for any losses or damages that may result from the use of our trading related ideas or the information provided on our platform. Users should seek the advice of a licensed financial advisor or professional if they have any doubts or concerns about their investment strategies.

EURUSD Potential Forecast | 15th March 2023Fundamental Backdrop
1. Market sentiments has shifted bearish for the USD
2. EURUSD has more room to continue bullish
3. Market is leaning towards a 25bps rate hike but FOMC may still hike by 50bps considering the minimal slow down in CPI yesterday.
Technical Confluences
1. Price recently bounced off the H4 support level at 1.06903 and we can potentially see bullish continuations from there.
2. Bullish pressure is waning, a retracement can occur for the bulls to continue heading up.
3. Market structure has shifted bullish.
Idea
If price closes below 1.069, that would be a good area to look for longs position on the lower timeframe. Ultimately, anticipating EURUSD to continue bullish.
NOT FINANCIAL ADVICE DISCLAIMER
The trading related ideas posted by OlympusLabs are for educational and informational purposes only and should not be considered as financial advice. Trading in financial markets involves a high degree of risk, and individuals should carefully consider their investment objectives, financial situation, and risk tolerance before making any trading decisions based on our ideas.
We are not a licensed financial advisor or professional, and the information we are providing is based on our personal experience and research. We make no guarantees or promises regarding the accuracy, completeness, or reliability of the information provided, and users should do their own research and analysis before making any trades.
Users should be aware that trading involves significant risk, and there is no guarantee of profit. Any trading strategy may result in losses, and individuals should be prepared to accept those risks.
OlympusLabs and its affiliates are not responsible for any losses or damages that may result from the use of our trading related ideas or the information provided on our platform. Users should seek the advice of a licensed financial advisor or professional if they have any doubts or concerns about their investment strategies.

DXY Potential Forecast | Pre-CPI | 14th March 2023Hi everyone, back with a pre CPI forecast.
Today's CPI release will be wild and will be the determining factor to solidify the general direction and bias on the USD.
There has been very bearish sentiments on the USD since last Friday after NFP's release.
Fundamental context
1. Employments was good, well above the forecasted or what the market has been pricing in.
2. This shows the strong labor market in the US economy.
3. However, average hourly earnings increased at a decreasing rate to 0.2% from 0.3%.
4. This shows the slowing down of the wage inflation, which is directly correlated with the inflation print and numbers, showing an important signal/sign that inflation could be worse off.
5. In addition, unemployment rate increased by 0.2% compared to previous months.
6. The average earnings and unemployment rate prints showcases the effect of the continuous rate hikes that the Fed has partaken in.
7. This directly discourages the Fed from taking on a more hawkish stance in the market, upon seeing the fruition of the restrictive policy the Fed has performed.
CPI
1. If CPI were to be worse off than forecasted, this really solidifies the bearishness of the USD as it confirms that the Fed policy has been coming to fruition and there might not be a need to hike interest rates anymore.
2. However, if CPI print continues to be resilient and strong or greater than expectations, there is a marked chance that the Fed will hike interest rates by 50bps in the upcoming FOMC meeting, in which this hawkish stance will continue to drive the market bullish for the USD.
3. All eyes will be on the CPI print tonight.
Regards,
Chern Yu
