CPI Data And GBPUSD ReactionHey Guys,
So we called this on my recent streams.
Let the market move to your preferred area for value.
Then look to enter the market and take advantage of the move.
Do not guess EVER!
Watch for more.
CPI

EURUSD Post CPI Breakdown episode 2Here is a quick recap and breakdown of price action post CPI data on EURUSD. If you did not watch my first video on Pre CPI data for EURUSD make sure to check it out. Take notes, Study, level up your trading and remember - only a fool dismisses demo trading. Cheers and be safe.

USDJPY post trade analysis USDJPY was showing a buy opportunity and the CPI news release gave 2 entries for it. One would have been aggressive right before the news release and the price pullbacks deep right after the news release for another entry to the same target.

CPI What Price Done and Where to Look | EURUSD Ready!!Hello everyone.. CPI and the expected volatility it has causdd in a second!
Price reached FVG on 1D simultaneously closes a Weekly Gab formed last week and time is proper as it is New York Killzone.. Grab your Position responsibly..
Thanks

XAUUSD CPI prediction worked out!wow .. pretty accurate!! .. the usual whipsaw so gold move to the downside to then fly back up to my top target. I did'nt trade .. but was very accurate as always.

U.S. stock market remains unchanged despite soaring CPI figures
U.S. stock market futures S&P and NASDAQ have not changed significantly.
The market predicted a fall in inflation compared to the previous month, but it showed an increase not only above the forecast but also compared to the previous month.

XAUUSD CPI PREDICTION Just for a bit of fun .. here are my price targets for CPI. Lets see ...
I dont trade the news candle .. i like to wait an hour after.

USDCHF Guide for CPIHopefully, this is helpful as another argument / guide as CPI-move is close.
LONG bias, offers a simple entry for good RR.
However, I'll readily drop it if the channel is broken, down.

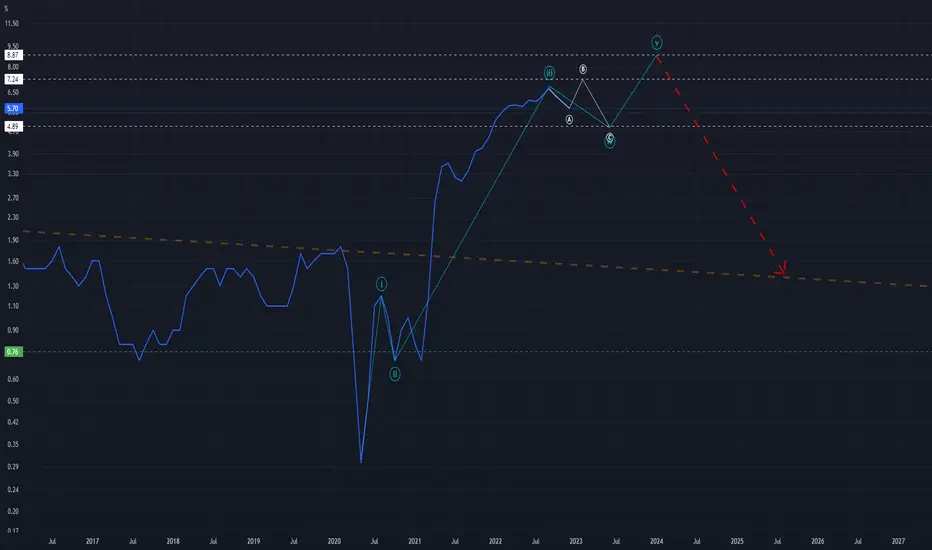
Elliott Wave Science Meets the Consumer Price IndexIt would be awesome if TradingView offered a candlestick chart for CPI but considering its only updated once per month, maybe the line graph/chart is the best option (not sure how that works). As for the data available to me, I've done a best effort markup using the science of Elliott Wave Theory. Considering the fluctuations seen on the M(onthly) chart, I believe its possible that CPI is sitting in the midst of a shallow Wave 4 correction. With this in mind, I find it possible that the number stretches into the low-mid 7.xx range between now and March. From there we may see a 2023 low within the 4.xx level.
I will share my thoughts here as I know there is much interest in "what will the CPI numbers be?"... Being that this CPI data is directly based on the actions of humans and the habits that we act on, it should work pretty well with Elliott Wave Theory. I will keep this post fluid and apply analytical updates as monthly results are publicly announced.
Remember these three important things: 1) trade the chart instead of the news and 2) stay safe /3) don't drown!
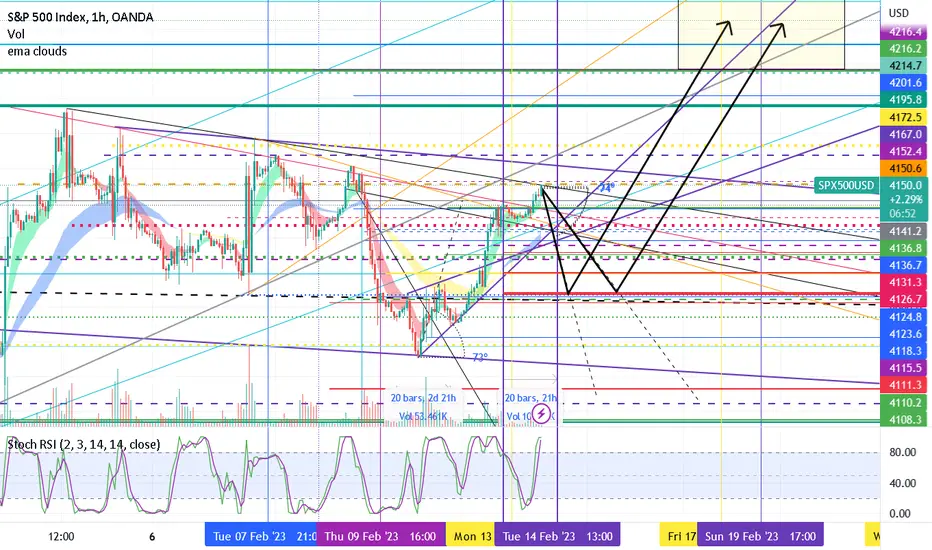
Waveii after CPI report then waveiiiLooking for a pullback to the 4080-4090 region starting at the CPI report.
Looking for this to find support and go long, the next leg will be to 4240-4250
GOLD BULLISHGOLD will go to the upside. If price breaks 1857.82, pretty sure my TP will be 1867.86
Remember that CPI is coming up, so this is a really risky trade....

Pre CPI EURUSD BreakdownI recommend waiting and catching the real move because today is high impact news dat. CPI is brutal, I wouldn't be surprised if we see a nice turtle soup play before a sell off. Everything else is explained in the video.

Plan for XAUUSD with CPI AnnouncementOANDA:XAUUSD
Gold has been trading in the range since last Friday (10th February 2023). It is clear that speculators and investors are waiting for something: maybe some economic indicators like CPI will decide the movement of Gold by today (14th February 2023)
Within the 1H timeframe, It is clear that gold has a strong chance of continuing its downtrend if it breaks below the trading range of 1850-1865 with the the following key support levels:
1st Support at: 1835
2nd Support at: 1825
Key Support at: 1800
On the contrary in a bigger picture of Day timeframe, Gold can still push for another leg upward as the price action has slowed the downward movement. If CPI number comes out in favor of Gold then it has a chance of testing the following key resistance when it breaks the range between 1850-1865 upward:
1st Resistance at: 1880
2nd Resistance at: 1885
Key Resistance at: 1900
The most importance part of all; Place a trade where the Risk to Reward favors in the direction that you choose!!!

VIX Is Ready To PartyThe VIX looks like its ready to party ahead of today's CPI print.
It recently touched the upward moving monthly trendline and my guess is it moves into the mid to upper twenties short term.

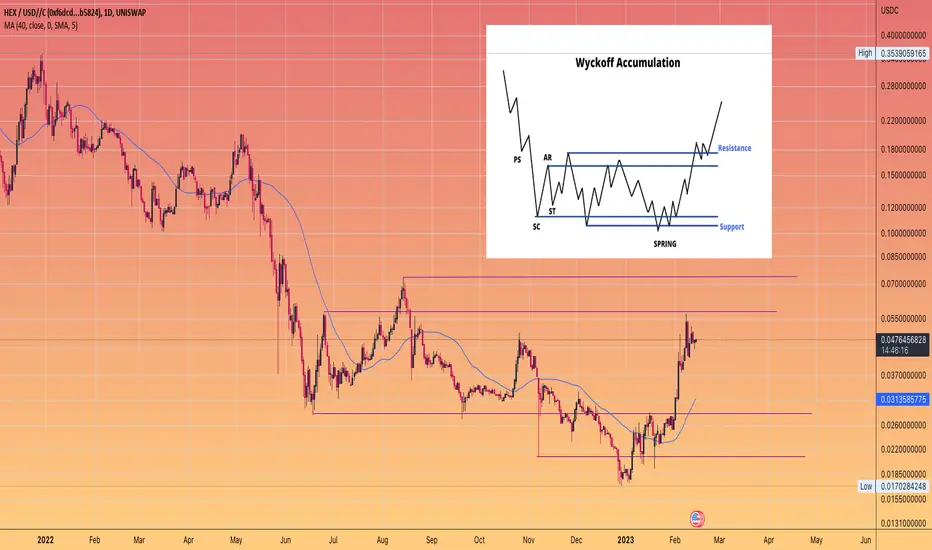
#HEX Wyckoff accumulationLike some other #altcoins
#HEXUSDC appears to be showing a #Wyckoff accumulation pattern
not textbook , but a very good guide as to what has occurred during this #bear market
could we have CPI dump today , quite possible
but I am favouring a lower CP LIE and grounds for continuation in the #stock market
USDCAD SetUP (CPI HIGH)Not much to say.
Continuing with HIGH CPI SetUp
USDCAD retest to previous lows and then with the fundamentals (possible HIGH CPI numbers) continues up.

Why US30 Will crash hard? CPI data is tomorrow and yet if Feds pivots still alive.
Bad news the inflation still high and slowly cooling down but not at eased. This is a cause of disinflation.. we supposed not to go there way too fast ! This is big reason for markets to crash.
Overall we should expect the big fall pay attention for the CPI news tomorrow morning
This will be the biggest bull trap in history

GOLD CPI DAY (HIGH CPI)Waiting the news but this is 1 of the 3 setups.
1- High Cpi
2- Expected Cpi or close to the previous Cpi (Gold ranges or a little bit bull)
3- Cpi improvement ---> Gold bull

AMD: SUPPLY & DEMAND / MARKET MOVER / FORTY-FIVE MADESCRIPTION: In the chart above I have provided a MACRO to SEMI-MICRO analysis of AMD's price action. With a large amount of history backing AMD's price action and overall impact on economic factor I would personally consider AMD to be a MARKET MOVER.
POINTS:
1. MACRO Deviation: 13.75, SEMI-MICRO Deviation: 6.8
2. Current Uptrend Channel
3. WATCH 45 MA SINCE THE START OF BEAR MARKET THIS IS THE SECOND TIME THE 45 MA RISES ABOVE THE 200 MA.
4. WIDER UPTREND CHANNEL has developed.
IMPORTANT: IF PRICE ACTION FALLS BELOW 82.50 FURTHER DOWNWARD MOMENTUM CAN THEN BE ON THE WAY.
SCENARIO BEARISH: Current RSI & MACD levels falls in tandem with overbought territory being shown where current price action stands in NEW CHANNEL. Watch for loss of 82.50 if this is the case it is crucial 68.75 does not break because this can signify an opening for a new downtrend channel.
SCENARIO BULLISH: IF 82.50 is lost watch for strong bounce on 75.63 to PRESERVE BULLISH MOMENTUM OF MA's.
FULL CHART LINK: www.tradingview.com
NASDAQ:AMD

OP right at support!OPTIMISM has been a runner!
If CPI numbers are better than this can make a good move back up to ATH!
This is one I'm keeping an eye on. <---
Good Luck Out There!

Important USD news (CPI) Important USD news will be published today at 15:30!
By default, they cause large fluctuations.
All active positions must be reduced risk.
New positions are wanted after the news!
The more likely direction remains for the downside to continue towards 1.0620 and 1.0565.
This scenario breaks down on a closing above 1.0790.

GOLD SHORT TERM INTRADAY IDEAIntraday Analysis - ( 14 FEB 2023 )
Price setting up for CPI data today with many choppy price action and no smooth upside or downside moves. However on the higher timeframe we can see lower lows printed respecting the bearish structure.
Personally am looking at cpi to continue being high with a strong labour data as reflected on NFP day. Potential liquidity grabs to the upside whereby i am eyeing 1876 and 1865 regions for shorts. Would be best if there is straight melts ofcourse. However this is in the event inflation still prints high.
HRHR SELLS 1883
MRMR SELLS 1876 / 1865
SAFEST SELLS below 1850
Will be looking at 1820 if cpi data prints with dollar domination and weakness in risk assets
If CPI data prints low, showing signs of improvements, i would be looking at longs only above 1883 cancelling out the entire downside move.
Either ways stay adaptive to the markets and safest is enjoy a glass of wine with your girl and stay away from the charts.
HAPPY VALENTINES DAY

DXY Pre January CPIThe upward momentum on the DXY after January’s positive non-farm payroll print on the 3rd of February seems to have subsided for the time being. The DXY managed to test its 50-day MA and touch the green 23.6% Fibo retracement level at 104 but these resistance levels have held their ground. The 23.6 % Fibo also coincides satisfyingly with the neckline of the previous upward trendline as well as the blue 50% Fibo retracement level.
There was a gap down at market open this morning ahead of the highly anticipated US CPI print for January which is negative for the greenback. Last week Friday the BLS quietly revised the CPI higher for four of the past five months, with one month unchanged so always take CPI results with a pinch of salt (CPI is a lie but it influences investor sentiment). The supposed CPI for January is expected to print 6.2%, down from 6.4% in December, yoy.
My track record forecasting scenarios from data prints aren’t great but this is how I see the lay of the land; an in line with expectations or a print lower than 6.2% yoy will add fuel to the Fed’s self-proclaimed narrative that they have beat inflation. This scenario will be dollar negative and will spur risk-on investor sentiment. This scenario will allow the DXY to fall below the support at 103 (covid peak) and drop lower towards the critical support at 101.843, blue 61.8% Fibo retracement level).
On the flip side, a print at or above 6.4% yoy will have investors running back to the safe haven dollar with their tails between their legs. This scenario is expected to push the DXY above the resistance level of 104 and higher towards 106.00. (I don’t expect a fair CPI print if they can just quietly revise the numbers higher at a later stage without spooking the markets thus, I’m not in favour of this scenario materializing today).
Technical indicators: The buy signal on the daily MACD seems to be rolling over which is dollar negative but there is a fair degree of bullish divergence on the RSI which is keeping me on my toes. I’m leaning towards the first scenario I mentioned earlier. Over the longer-term (the remainder of 2023) I’m very much bullish on the dollar and I think the bottom for the DXY is in at 100.90 I believe we will see the dollar milkshake theory play out this year when the economic realities start collecting their debt.
