USDJPY LONG ANALYSIS TO $139📈The Dollar Yen has completed its fifth wave to the downside, marking the completion of its first major wave (Wave 1). This will now be followed by a 3 sub-wave correction back towards the upside, which counts as Wave 2. Targeting $139 - $140.
Similar to all other markets correlating positively to the DXY, USDJPY is only facing a temporary upside, before the bears later take control📉 760 PIPS profit from current market price. Only suitable for big accounts, who can handle swing trading.
Make sure to drop a follow and like. Let me know if you agree with this bias✅
CPI

XAU/USD LONGS but need DAILY close after CPI NewsHi guys, i can see alot of bias for gold is shorts but im leaning towards longs only if we get a daily close $1861.430 and the candle has to be either a rejection or engulfing from my price points marked !!! bare in mind CPI news on Tuesday so alot stop hunt will be happening before it decides its direction

XAUUSD weekly biasSo XAUUSD has shown us in the last week that it may have to downside potential... this is due to the tap into supply above along with a breakdown of some of our midterm structures, we have yet to confirm this downtrend so we don't want to bank on it just yet...
With the CPI looming and a heavy FVG above we could be set to clear some gaps and head lower, Of course, this is dependent on the CPI results, but overall we are looking for possible bearish moves lower.
Remember, overall gold is in an uptrend, so we could just see the price continuing in that movement. But if we see a clear reaction at one of our points of supply above, then we could look to take price short.
If we see Price had lower in the beginning of the week, this would make me believe that an upward shift coming in the latter half of the week is very probable. If we see an upward shift at the beginning of the week with a consolidation midweek, we could see the drop coming for the CPI.
As per all trade ideas, we will be watching this on a lower time frame to establish whether price truly wants to move in the direction we believe.

GOLD SHORT TO 1830Taking a small risk on this possible short opportunity on Gold for the coming week. We have seen a BOS, leaving behind an unmitigated candle and liquidity hunt. There is a chance Gold will push higher ahead of Tuesday's CPI data, grab liquidity then drop to the downside.
I will keep everyone updated, so make sure to drop a like and follow!
40 PIPS RISK = 430 PIPS REWARDS

US-oil weekly bias West Texas oil/ U.S. oil. It looks like it may want to push up towards the higher area of supply which has been left unmitigated... Based on the moves we saw last week, which were predominantly bullish towards the end of the week, lead me to believe we could be hunting the high levels of liquidity that lie above our previous highs. If this is the case, it will take us directly into the unmitigated daily supply that we have highlighted.
After tapping into the area of demand and sweeping a previous low, we have left impulsively to the upside, therefore leading me to believe upside movements may persist.
As per all of our markups, we'll be watching this on a smaller time frame to determine which direction it truly wants to move in, but on the daily and four-hour timeframes, you can see we have broken clear structures to the downside whilst still moving towards the high of our daily range.
With the CPI coming this week, we can effectively say that we will see some shifts in this pair.
Overall my bias on this is long, but I would like to see a clear confirmation to take the trade. Once the move to the upside is complete, I believe we could see further downside for the US oil industry.
Fundamentally, this pair does not correlate with what we're seeing in true price, which essentially could lead us into a bullish move if areas of supply that are shown on the daily do not hold.
**Be aware we have a smaller time frame area of supply just above where the price is currently, which is not shown in this markup**

GBPJPY weekly bias British pound to the Japanese yen is currently sandwiched in between an area of supply in an area of demand. The area of demand is the larger of the two POI's But both have an effect on the market... Coming into this week, you can see we have two large areas of liquidity, one below and one above. I believe the larger time frame is looking to go bearish. With this in mind, I would like to see a pullback to fill the fair value gap above as well as tap into the area of supply you can see highlighted.
As shown on the smaller time frame perspective, we have an area of supply and an area of demand sitting above and below the price which could affect the direction it moves in short term, My preferred move for this would be a short-term sweep of the lows with a longer term pullback to fill the fair value gap above. But as always, we will watch this in a smaller time frame to see which direction it truly wants to travel in.
I will be looking for a long to a short idea on this. Based on what we see in the first couple of sessions.
At present, our main breaks are structured to the downside, hence why I would prefer to see a longer-term down move.

EURUSD possible downside movesEuro to the US dollar is tapping into a daily demand, just like the other U.S. dollar pairs we have shown in our Sunday markups.
We have only broken short-term structures. To the downside on the floor our time frame. So more downside is possible. But without taking a major low we can't rush into any long-term ideas just yet. If we see a significant pullback and a reaction from one of our areas of supply above, then we can look to go short. As stated in our other markups, we had the CPI coming this week, so we will see some shifts in this market.
Understanding a short-term structural break does not tell you a long-term trend is going to be a key point of this week. Overall I am looking for short ideas on this, but I won't be taking any unless we have a very clear indication that sellers are present.
As stated in our other mark-ups, we will be looking at smaller timeframes to find possible downside moves, but I am expecting a retrace for this pair the same as the British pound to the US dollar.
How this pair reacts on retrace is going to determine what we can expect for the next session.
Lower, we have a fair value gap along with an unmitigated area of demand. So seeing how Price reacted, this area is going to be interesting.

GBPUSD possible downside movesAs shown in our Australian to U.S. dollar markup, we were in a pretty similar situation with the British pound to the US dollar.
The only big difference with this pair is that we haven't broken any significant structures to the downside yet.
I'd like to see the structure broken to the downside or liquidity to be taken from above before a new structural low is made.
my overall bias is bearish for this pair but seeing the heavy amount of liquidity sitting above with equal highs on the four hour time frame and daily time frame, leads me to believe there could be some more upside potential for this. As well as no confirmation is given to the downside yet due to no break of structure, we have to keep an open mind for this pair.
Overall I would like to see short movements and we will be monitoring the smaller timeframes for possible entries lower, but at the same time, we won't be making any rash decisions and getting caught in any traps.
As mentioned in our AUD markup, we have the CPI coming this week. So we may see some significant shifts whether it be to the upside or the downside.

AUDUSD bias 12th febAs shown in our markup, we've tapped into a supply on the daily time frame. After tapping into this supply, we've broken the structure to the downside on a four-hour basis.
This leads me to believe that coming this week we may see further downside for the Australian to U.S. dollar.
We have the CPI news this week, as well as a couple of other news events, These could be the catalyst to push this pair further to the downside.
We will be looking on a smaller time frame for possible entries lower... As always, we will monitor this to see if any entries are given, but as an overall bias we are expecting bearish movements for this pair.

Potential Bearish Run On Nasdaq For CPI On 14th February 2023Would like to see price show signs of weakness and tap into the H4 supply and fair value gap before giving us a lower timeframe shift in market structure to confirm our short bias. Should CPI inflation report come in hotter than expected, we will definitely see the markets react negatively to this. This will also be good basis for our short position as it aligns with technicals.

Flynns Log Feb 10th 2023The bulls and bears in the stock market are like two siblings always fighting over who's right.
The bulls are the optimists, always saying "the market is going up! Buy, buy, buy!" while the bears are the pessimists, growling "the market is going down! Sell, sell, sell!" It's like a never-ending game of "he said, she said".
But in all seriousness, these two forces play a crucial role in determining the direction of the market and their constant back-and-forth creates an environment of volatility and unpredictability. It's like watching a comedic ping-pong match, with prices bouncing up and down like a ball.
One minute the bulls are charging ahead and the next minute the bears are bringing them down.
It's all in good fun, but always remember to do your research and make informed investment decisions.
2 weeks ago, I was expecting the market to front run a test on the 20D and that didn’t happen.
I took to twitter and offered a bullish analysis for this week with a warning to use TLT as a directional bias.
I didn’t take my own advice and positioned only bullish yesterday knowing there would be a strong push to front fun the 20D prior to CPI/OPEX
I took a loosing strangle on the 8th (yellow box) which set me up for loosing calls only on the 9th.
Premarket should have been a clue, but it was a fake front running of a Vanna Rally.
And the drive through the open gap was the signal the weeks low would be next.
Sitting at about 4081.50 Open on SPX where I expect to base here at the Keep Calm and 4k On Line
The market is still at a point of technically weaker flows.
This is just Market Crash Game Theory.
Anyone in volatility should have at least 1 or 2 crash scenarios.
I wouldn’t ever recommend anyone trading crash theories.
Take it from experience, it’s a fools errand to try and predict a market crash and prosper from it.
I’m looking for support at 4050-4100 SPX range while the market digests the move lower and prepares for CPI.
My only position is OTM puts for March that I plan to hold through Feb expiry and roll into June if they don’t print.
Based on the price action for the last few days I’m expecting a realignment to the lower end of 4k for the rest of the year.
The messaging from FOMC is not lining up with a bullish trend into summer.
A hot CPI number will force the markets to reposition lower for no rate cuts in 2023.
But that doesn’t mean we plunge to the depths of financial hell either.
---- It Begins -------
Listen, I started a new project called The Grid.
It’s fintech. It will be focused on Options Education, Gamma, Vanna, Dealer Positioning, IV and Options history along with extra stuff like Hedged Equity Position tracking and members only Trading View indicators.
I don’t have the options data capability in trading view to push these indicators any further.
I’ll be launching an early registration site this weekend.
It will be free for founding members.

DXY to keep securities afloat until CPIThe DXY didn't breakout, and is turning right at resistance. I think we will hold this range until CPI, when market will take over. US30y poor auction results were catalyst for today's drop, but all hopes rest on CPI.

When to Buy Real Estate Investing in 2023This video is my strategic analysis for when I will be looking to buy my next real estate investment property. I use the Cash-Shiller Index, CPI, and charting techniques of mean reversion to create indicators I will follow in the years ahead as real estate trends downward following the rise in mortgage rates and fall in home prices.

GOLD SHORT TERM INTRADAY IDEAIntraday Analysis - ( 9 FEB 2023 )
Price still trading in a range, range plays are always valid however will be looking for break outs in days to come.
HRHR sells 1902 / 1897 regions
MRMR sells breaking back below 1876
Safest sells below 1860
A break of 1860s, will be targeting minimally 1830s giving us a solid 300+ pips with 1845 as a first target.
Scalp buys are valid in this range however will be more incline to take buys above 1886.5. HOWEVER LOOK OUT FOR 1890 PSYCHOLOGICAL KEY LEVEL.

Powell Speech hawkishPowell's speech may set the tone for Dollar to have a short term rally.
I am still Bearish Dollar long term. But having heard what he said yesterday, it may give investors some sense of bullishness.
At the moment and for this week, watching if DXY can really rally above the Weekly zone, and upside draw towards the Daily Volume Imbalance.
Right now, its risk off scenario for DXY.
How DXY behave inside this Weekly zone is kind of key. It may just consolidate till next week's US CPI, which is very possible.
Just my thoughts.
Trader Sifu Steve @ XeroAcademy Malaysia

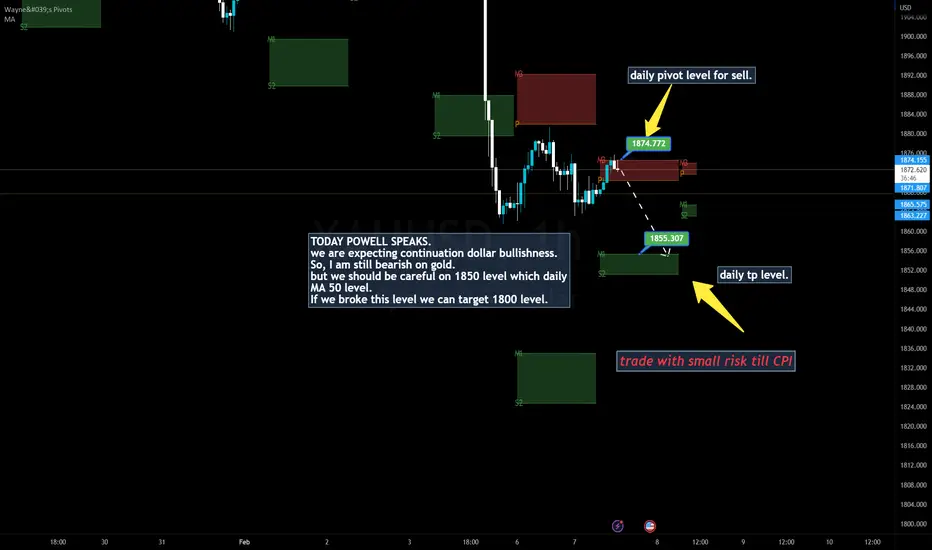
XAUUSD shortTODAY POWELL SPEAKS.
we are expecting continuation dollar bullishness.
So, I am still bearish on gold.
but we should be careful on 1850 level which daily
MA 50 level.
If we broke this level we can target 1800 level.
Nasdaq: Short-term bull Long-term rangeWhy market is entering into short-term bullishness again and latter uncertainty or range?
We will do both technical and fundamental analysis in this video tutorial, and we will see how both analyses can affirm each other.
Refer to the related video link, I explained at greater length. Or you can always visit my YouTube channel.
Content:
. Why market is entering into a short-term bullishness? (Fundamental & Technical studies)
. Subsequently the market will enter into a range (Fundamental & Technical studies)
CME Micro Nasdaq Futures
Minimum fluctuation
0.25 = $0.50
1 = $2
10 = $20
100 = $200
1000 = $2,000
Disclaimer:
• What presented here is not a recommendation, please consult your licensed broker.
• Our mission is to create lateral thinking skills for every investor and trader, knowing when to take a calculated risk with market uncertainty and a bolder risk when opportunity arises.
CME Real-time Market Data help identify trading set-ups in real-time and express my market views. If you have futures in your trading portfolio, you can check out on CME Group data plans available that suit your trading needs www.tradingview.com

Fight or Flight?On February 1st, the Federal Reserve (Fed) announced a widely-expected 25bps rate hike. This was the rallying cry for the current market rally to continue.
Is this confidence warranted? An interesting note is that the FOMC meeting minutes and the associated press conference appeared contradictory in nature because there was not a straightforward hawkish or dovish narrative across both. The statement was hawkish. Meanwhile, Fed Chairman Powell’s language in the press conference was remarkably dovish, describing the disinflation process as having started and as "encouraging and gratifying". This was the point that markets took as the signal to continue the recent rally. Precious metals, equities, and risk assets have all seen significant post-meeting relief.
The first innings of a recession always appear to be somewhat of a soft landing in which inflation and growth begin to slow gradually. Yesterday’s meeting echoed the idea that recent indicators point to a modest increase in spending and that inflation has eased, precisely what the first innings of a recession would predict. As markets, potentially shortsightedly, adopt the soft landing narrative, the Fed’s lack of pushback against easier financial conditions added fuel to the fire. Given this, it is doubtful that markets will stop rallying until one of two cases occurs: First, if data comes in hot, it potentially frightens markets into thinking the Fed will turn back hawkish and raise rates more than the recently observed 25bps hike. The second scenario is the other extreme. Should data start coming in highly recessionary with lower inflation and weak growth, this will eliminate all believers in the soft landing narrative, thus halting the rally. However, at present, it looks like the market rally of 2023 could continue until either of these scenarios happen. An important thing to note is that whenever inflation has exceeded 5% in the past, it has never come back down without the Federal Funds Rate exceeding the rate of CPI inflation. Considering the Federal Funds Rate is currently between 4.5% and 4.75% whilst CPI inflation is at 6.5%, more rate hikes are on the horizon unless data comes in highly recessionary. CPI data on the 14th of February will provide significant insight into whether or not the Fed will follow the likes of the European Central Bank & Bank of England and go with a 50bps hike rather than a 25bps hike.
Another important thing to note is that Apple , Amazon , and Alphabet (the parent company of Google ) all missed earnings last night. If three of the world's largest companies missed earnings, it does not breed confidence for economic hopes of avoiding a recession. One thing seems certain, the S&P500 is likely to take a hit when the NYSE opens later today.

Everyone Believes What They Want to BelieveRealty != Belief
The secret to this market is to lower your expectation continually.
Bulls do not realize they are sitting in the largest bull trap ever setup.
Macro bottom still pending... it's more of the same: drop, consolidate, drop.
A wise Bera once said:
Resistance is infinite and unbounded.
When a level is broken, there will always be more resistance higher up.
Support is not though, support is capped at 0.
The Fed's view:
www.federalreserve.gov
What does the Beveridge curve tell us about the likelihood of a soft landing?
"It would be unprecedented for job vacancies (openings) to decline by a large amount without the economy falling into recession. We are, in effect, saying that something unprecedented can occur."
Lagging Crash
Lehman Brothers filed for bankruptcy on September 15, 2008.
The broader stock market did not begin its crash until a week later.
Everyone initially thought Lehman wasn't a systemic risk.
You say crypto crash can not crash stocks with a LAG?
The doom loop is accelerating.
Few understand this.


You Can Have the Cake and Eat it TooCBOT: Treasury Yield Spread 10Y-2YY ( CBOT_MINI:10Y1! CBOT_MINI:2YY1! ), Micro Dow ( CBOT_MINI:MYM1! ), Micro S&P ( CME_MINI:MES1! )
On Wednesday, the Federal Reserve raises its benchmark Fed Funds rate by 25 basis points to a target range of 4.5%-4.75%. The move marked the eighth consecutive hikes that have began in March 2022. The overnight risk-free rate is now at its highest level since October 2007.
Fed Chairman Jerome Powell sends mixed signals in his post-FOMC meeting news conference but appears more dovish comparing to previous speeches.
The Committee thinks that “on-going increases in the target range will be appropriate”. These words send stocks down minutes after the speech begins at 2:30PM.
However, during the Q&A session, when the Fed Chair confirms, for the first time, that “the disinflationary process has started,” the stock market rebounds strongly and finishes in the positive territory for the day.
Other mixed messages:
• Inflation data shows a welcome reduction in the monthly pace of increases;
• It would be “very premature to declare victory or to think we really got this”;
• It’s “possible” that the funds rate could stay lower than 5%;
• Unlikely the Fed would cut rates this year unless inflation comes down more rapidly.
Actions speak louder than words. In two rate-setting meetings, the Fed has slowed the pace from 75 bps to 25 bps. The path is not likely to reverse, and future rate hikes will come down to just two options, either 0 or 25 bps. In my opinion, the terminal rate will end at 5% or 5.25% after the March and May meeting.
In recent months, the “Risk” button has been pressed on for risky assets:
• The Dow is up 19% since October, and the S&P and the Nasdaq are up 17% and 18% for the same period, respectively;
• Gold futures rallies 21% since November, while Bitcoin jumps 58%;
• Tesla and Ark Innovation ETF gain 47% and 33% year-to-date, respectively.
Historically, it’s rare for the stock market to dip two years or more in a row. For the S&P 500, it only happened four times in the last 100 years. The odds favor stock investors in the Year of Rabbits after a brutal double-digit selloff in 2022.
Fed rate hikes and high inflation are like a brake that decelerated the running economy car. Now that the driver’s foot is off the brake, will the economy improve immediately?
Not so fast. We will endure higher costs for months to come. Take the example of food items, once the price goes up, it usually stays up for the year. Sometimes, suppliers resolve to reducing the size of package for the illusion of keeping the same price, a tactic known as “Shrinkflation”. Wages, rent, phone bill, cable TV, utility, homeowner association fees and sales tax also seldom go down. All these point to a sticky inflation. Without massive government stimulus to press the gas pedal, subdued growth is on the horizon.
However, the stock market is forward looking. Investors already see an "invisible foot" on the accelerator and begin buying in the dip. On balance, I’m bullish about risky assets, but would consider protecting my investments carefully.
The inversed yield curve is a proven and tested signal of a potential recession. The 10Y-2Y Treasury yield spread is at -64 bps after the Fed rate decision. The yield spread turned negative last July and stayed below zero in the last seven months.
Major crises could break out unexpectedly, crashing our party. The year-long Russia-Ukraine conflict could intensify, tensions in the Taiwan Strait could escalate, and the US government might not be able to avoid a national debt default.
A Hedged Position on Stock Index Futures
We could consider using the CME Micro E-mini S&P futures to establish a bullish position on the U.S. stock market. The June contract MESM3 is currently quoted at 4177, which is 58 points above the cash index. To protect my position from any adverse market movement, an out-of-the-money put option could be placed at the 3950-strike. If you are more pessimistic, a lower strike of 3840 may be considered.
The benefit of futures over cash index ETFs lies with the leverage. With a smaller margin deposit upfront, investment return could be amplified if the market moves in your favor. The downside is that the loss will also ramp up quickly if the market moves against you.
Put options protect us from any downfall below the strike price. Unlike futures, the maximum loss from a long options position is the premium you have paid upfront. A combination of long futures and long put options is, in theory, limited downside with unlimited upside.
The risk and return tradeoff are asymmetry in this case. As a result, you can have the cake and eat it too!
Happy trading.
Disclaimers
*Trade ideas cited above are for illustration only, as an integral part of a case study to demonstrate the fundamental concepts in risk management under the market scenarios being discussed. They shall not be construed as investment recommendations or advice. Nor are they used to promote any specific products, or services.
CME Real-time Market Data help identify trade set-ups and express my market views. If you have futures in your trading portfolio, check out on CME Group data plans in TradingView that suit your trading needs www.tradingview.com

BTC Futures Rising Wedge Forming, confluence with newsI frequently chart the BTC CME Futures chart alongside a normal BTC Exchange chart. The difference between them is that CME is closed for the weekend and operated by a regulated group. This means the CME chart can frequently show different trends/patterns as it removed a lot of the noise, unnecessary wicks, etc that can come from exchanges trading over the weekend.
I'm watching the early stages of this rising wedge forming. It's a bit early to call it a confirmed pattern still but worth putting on the radar. I often like to find confluence in charts aligning with news; I don't trade news but news is often a perfect catalyst for patterns to breakout. So what I have shown in the chart is a pattern that comes to an apex in about a week's time. And we have February right around the corner with a lot of news coming out, specifically the FOMC meeting minutes releasing on February 1st. This would be the perfect catalyst to create some volatility, quickly eliminate overleveraged longs and shorts, and then push for a pattern break of the rising wedge.
Marking this idea as short as I am bearish overall and ready for a market reset, but note that this chart displays an idea where BTC gets one more push higher at the beginning of this week.
Happy to answer any questions people have on this idea!

Is lumber Spiking?This Lumber Weekly chart clearly shows the unique parallell range that confirmed a breakdown.
Now to determine what likely happens next we wait to see if we get a close above or below the weekly key channel Resistance line.
If rates remain soft we will likely get a continuation move to the upside.
