How to Track Inflation NumberHow to track inflation number?
When the Fed mentions their 2% inflation target, are they referring to the commonly published CPI that we often read about, or are they referring to Core CPI or Core PCE?
10-Year Yield Futures
Ticker: 10Y
Minimum fluctuation:
0.001 Index points (1/10th basis point per annum) = $1.00
Disclaimer:
• What presented here is not a recommendation, please consult your licensed broker.
• Our mission is to create lateral thinking skills for every investor and trader, knowing when to take a calculated risk with market uncertainty and a bolder risk when opportunity arises.
CME Real-time Market Data help identify trading set-ups in real-time and express my market views. If you have futures in your trading portfolio, you can check out on CME Group data plans available that suit your trading needs www.tradingview.com
Trading the Micro: www.cmegroup.com
CPI

17/03/25 Weekly outlookLast weeks high: $85,306.40
Last weeks low: $76,622.98
Midpoint: $80,964.69
It's FOMC week again! Last week it was CPI week and inflation numbers came in under forecast signaling the Tradfi market sell-off and implementation of tariffs have at least had a positive impact on the consumer price index, a 2.8% print 0.1% lower than forecast. As this relates to FOMC the forecast is a non mover with interest rates staying at 4.5%.
However this does not necessarily mean that FOMC will be a non event in terms of the markets, volatility is always expected and with a suspected Trump insider opening a $380m 40x short position on BTC with a liquidation price of $86,600. I expect this price to be hit at some point this week purely because CT is targeting this account that has had a perfect 8/8 trade record to stop hunt it, I think FOMC could proved the volatility to do it.
The general structure of BTC as a whole despite this stop hunt narrative is bearish, after losing $91k support and a retest confirming the level as new resistance structurally it makes sense to revisit FWB:73K to retest it as support. This would be horrible for the broader altcoin market that has suffered greatly so far this year but it would eliminate the need to fill the FVG in the future.
This week I am keeping a close eye on that stop hunt and FOMC as I feel that will dictate if we retest $91K or $73K.

Gold 1H Intra-Day Chart 14.03.2025Gold hit our $2,964 TP today, but failed to hold as resistance. So what's next?
Option 1: Gold keeps pushing higher towards £2,993 before rejecting and dropping.
Option 2: Gold DROPS lower from here towards $2,976.
Which option do you agree with more?

$USIRYY - U.S Inflation Rate Slows More Than ExpectedECONOMICS:USIRYY 2.8% YoY
(February/2025)
source: U.S. Bureau of Labor Statistics
- The annual inflation rate in the US eased to 2.8% in February below 3% in January and market expectations of 2.9%.
On a monthly basis, the CPI rose by 0.2%, slowing from 0.5% rise in January and below market expectations of 0.3%.
Core CPI also rose 0.2% on the month and was at 3.1% on a 12-month basis, both below consensus.


BITCOIN - WHERE ARE WE? When zooming out and looking at the Bitcoin chart, despite how crazy the market has been in recent weeks it comes down to a simple market structure with three separate clearly definable ranges:
RED RANGE (Accumulation) - From FEB '24 until the US election BTC chopped in primarily the top half of a range with five separate midpoint retests with progressively shallower rallies that eventually broke out with a catalyst from the political world.
BLUE RANGE (Expansion) - After a 10 month accumulation range the next phase in the bull cycle was expansion, a rally above ATH and into price discovery. An extremely thin inefficiency rally.
Now price currently is at the midpoint of this range and despite the geo-political waterfall of bad news BTC has held up better than I had expected given that usually a rally that goes straight up has no support levels on the way back down. The chart does suggest a retest at $73,700 at some point before deciding which direction to go in after that.
GREEN ZONE (Distribution) - For the last 3 months Bitcoins price has been extremely volatile, bouncing between $91-108K, the range containing price perfectly with weekly retests of the range bottom and a swing fail of the range high. That SFP set off the beginning of BTCs sell-off eventually breaking through the bottom and back into the blue range.
With Bitcoin at the midpoint of the middle range it's a perfect time to have a data release in CPI, A volatile news event that can be a catalyst for a larger market move and with Tradfi selling off, this CPI is the most important of the Trump administrations term so far:
CPI DAY
PREVIOUS: 3.0%
FORECAST: 2.9%
ACTUAL: ??
Bullish - sub 2.8% print. At least the market sell-off is having a positive effect on inflation and isn't painful for no reason. BTC reclaims blue midpoint with a view to retest blue high.
Bearish - 2.9% or higher. Market sell-off hasn't has an immediate effect on inflation so the sell-off is bad in all aspects, except for the Trump admin moving closer to their wish of a weaker dollar and lower interest rates. FWB:73K blue range bottom retest on the cards.

Canadian dollar calm ahead of BoC, US inflationThe Canadian dollar posted gains earlier but couldn't consolidate. In the European session, USD/CAD is trading at 1.4439, up 0.03% on the day.
It's decision day at the Bank of Canada, which is widely expected to lower rates by 25 basis points. This would lower the cash rate to 2.75%, its lowest level since July 2022. The BoC has been aggressive and has lowered rates at five straight meetings, chopping 200 basis points during that time.
The economy remains weak despite the sharp drop in interest rates and the central bank plans to continue lowering rates in order to boost economic growth. The BoC finds itself in a difficult position as far as rate policy. The labor market is showing weakness, with almost no job growth in February, while at the same time inflation remains sticky, above the BoC's 2% target. Throw into the mix the Trump administration's tariffs on Canada, and the situation has become fluid. The specter of a long trade war between Canada and the US would be disastrous for Canada and has complicated matters for the BoC.
In the US, inflation has been contained but remains above the Federal Reserve's target of 2%. Headline CPI for February is expected to ease to 0.3% m/m, down from 0.5% in January, and down to 2.9% y/y from 3.0%. The core rate is projected to drop to 0.3% m/m from 0.4% and to 3.2% from 3.3%.
If the CPI estimates prove to be on target, it would point to little movement in inflation and investors may feel relieved that Trump's tariffs policies have not yet raised inflation. The Federal Reserve is widely expected to hold rates at next week's meeting but it's unclear what happens after that, with the chances of a May cut at around 50/50.
USD/CAD is testing resistance at 1.4445. Above, there is resistance at 1.4511
1.4370 and 1.4304 are the next support levels

$CNIRYY - China's CPI DefelationaryECONOMICS:CNIRYY -0.7%
(February/2025)
source: National Bureau of Statistics of China
- China's consumer prices dropped by 0.7% yoy in February 2025, surpassing market estimates of a 0.5% decline and reversing a 0.5% rise in the prior month.
This was the first consumer deflation since January 2024, amid fading seasonal demand following the Spring Festival in late January.
Food prices fell the most in 13 months (-3.3% vs 0.4% in January), dragged by a steep decrease in cost of fresh vegetables (-12.6% vs 2.4%) and a sharp slowdown in pork prices (4.1% vs 13.8%).
Meanwhile, non-food prices edged lower (-0.1% vs 0.5%), as increases in housing (0.1% vs 0.1%) and healthcare (0.2% vs 0.7%) were offset by declines in education (-0.5% vs 1.7%) and transport (-2.5% vs -0.6%).
Core inflation, excluding volatile food and fuel prices, fell 0.1% in February, in contrast to a 0.6% rise in January.
Monthly, the CPI fell 0.2%, shifting from January's 11-month top of a 0.7% rise and marking the first drop since last November.
This fall was also steeper than consensus of a 0.1% decrease.

GBPUSD Holds Below 0.618 Fibonacci RetracementFollowing the DXY's decline, the British pound surged back above the trendline connecting lower highs between 2014 to 2021, aligning with a key resistance at the 0.618 Fibonacci retracement of the downtrend between the September 2024 high (1.3434) and the January 2025 low (1.2099) at 1.2945.
Current Market Setup:
RSI on the 3-day time frame is now overbought, aligning with the inverted head and shoulders target formed by the RSI trend near oversold levels, reinforcing reversal potential.
Further downside risks persist, with market sentiment hinging on growth data, trade war developments, and US inflation figures.
Key Levels to Watch:
A decisive close above 1.2850 could pave the way toward 1.3020, 1.3160, and 1.34.
Failure to hold gains could trigger a pullback toward key support zones at 1.28, 1.27, and 1.2570.
Key Events This Week:
US CPI
UK GDP
Trade War Developments
- Razan Hilal, CMT

10/03/25 Weekly outlookLast weeks high: $93,745.25
Last weeks low: $80,029.90
Midpoint: $86,887.58
Last week in crypto saw the first White House Digital Assets Summit. An event that only as recently as the last bull cycle we could only dream of taking place. In the summit that hosted the biggest names in the space a vow was made by the US Gov never to sell their BTC, to establish stablecoin regulatory clarity and to stockpile various US made altcoins. A historic moment but how did that relate to the chart?
Well BTC dropped 14.6% from weekly high set at the beginning of the week to weekly low set at the end of the week. The most important aspect is how this now looks on the higher time frames, the once strong support level of $91K has now been confirmed as new resistance as BTC tried several times to reclaim it and in the end fell away. This now puts BTC in the FVG area from $91-73K. With no real support until the $73,000 level this is knife catching territory and with the SP:SPX rolling over too I would need a lot more evidence that BTC will turn around before going long with any real size.
This week I anticipate further sell-off, now I would be happy to be proven wrong on that however it does look like we are heading towards FWB:73K where I would like to see buyers stepping up and start to dominate the orderbooks. Structurally that would fill a large inefficiency area with an eye to bounce off support and move back towards currently levels ~ GETTEX:82K as that would be the midpoint of the FVG although that is a few steps in the future.
CPI takes place this week and so volatility may be expected but unless the result is wildly different to the forecast numbers the whipsaw PA should level out fairly neutral.
Invalidation on this idea would be a successful reclaim of $91K which is previous mini range low & 4H 200 EMA resistance.

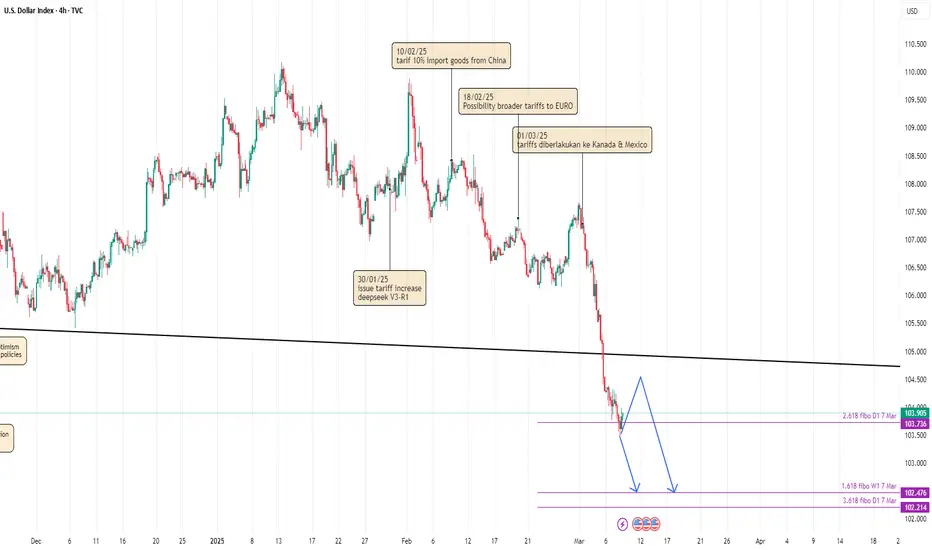
DOLLAR GAINS BUYER AMID NFP BAD DATA??Dollar seems on hold in it's 2.618 fibonacci support after NFP data released. Will it go higher next week?
I see dollar still waiting next data release. I mention JOLTS Job Opening & CPI which both of them crucial in current context of US macro-economy. Strong job opening & CPI means investor and retail trader must be no worries about US macro-economic despite concern about trade war. Otherwise, weak job opening & CPI means labor market and inflation continue cooling down. It will push THE FED to give clear path about their plan for future Interest Rate.
So, dollar could make sideways movement (or even gain buyer) but overall still in bearish momentum. Dollar still driven by concern of trade war and if job opening comes weaker than expected, it could gives more power to seller.
SELL USDCADUSDCAD Bearish Setup – USD Weakness in Focus
This week, we anticipate USD weakness across the board, with USDCAD positioned for a decline. Short from 1.42932 (Friday’s close), targeting 1.42156 and 1.40938, with stops above 1.43668 (Thursday’s high, expected to hold strong). CPI & PPI data could add volatility, but the broader trend favours the downside.
Use proper risk management.
Best of luck to you all.

$JPIRYY -Japan's Inflation Rate (CPI)ECONOMICS:JPIRYY 4%
(January/2025)
source: Ministry of Internal Affairs & Communications
- The annual inflation rate in Japan climbed to 4.0% in January 2025 from 3.6% in the prior month, marking the highest reading since January 2023.
Food prices rose at the steepest pace in 15 months (7.8% vs 6.4% in December), with fresh vegetables and fresh food contributing the most to the upturn.
Further, electricity prices (18.0% vs 18.7%) and gas cost (6.8% vs 7.8%) remained elevated with the absence of energy subsidies since May 2024.
Additional upward pressure also came from housing (0.8% vs 0.8%), clothing (2.8% vs 2.9%), transport (2.0% vs 1.1%), furniture and household items (3.4% vs 3.0%), healthcare (1.8% vs 1.7%), recreation (2.6% vs 4.0%), and miscellaneous items (1.4% vs 1.1%).
In contrast, prices continued to fall for communication (-0.3% vs -2.1%) and education (-1.1% vs -1.0%).
The core inflation rate rose to a 19-month high of 3.2%, up from 3.0% in December and topping consensus of 3.1%.
Monthly, the CPI increased by 0.5%, after December's 14-month top of 0.6% rise.

News TradingLet’s talk about news trading in Forex . While news trading is extremely lucrative it’s one of the most risky things a trader can do and experience. News and data cause extreme volatility in the market and as we always say “volatility can be your friend or your enemy” . Let’s take a deeper dive into news trading, which news and data affect the TVC:DXY precious metals such as OANDA:XAUUSD and other dollar related currency pairs. We will also cover having the right mindset for trading the news.
1. Understanding News Trading in Forex
News trading is based on the idea that significant economic data releases and geopolitical events can cause sharp price fluctuations in forex markets. We as traders, aim to profit from these sudden price movements by positioning ourselves before or immediately after the news hits the market. However, due to market unpredictability, it requires a strategic plan, risk management, and quick decision making.
2. What to Do in News Trading
1. Know the Key Economic Events – Monitor economic calendars to stay updated on high-impact news releases.
The most influential events include:
Non-Farm Payrolls (NFP) – A report on U.S. job growth that heavily influences the U.S. dollar.
Consumer Price Index (CPI) – Measures inflation, impacting interest rate decisions and currency valuation.
Federal Open Market Committee (FOMC) Meetings – Determines U.S. monetary policy and interest rates, affecting global markets.
Gross Domestic Product (GDP) – A key indicator of economic growth, influencing currency strength.
Central Bank Statements – Speeches by Fed Chair or ECB President can create large market moves.
2. Use an Economic Calendar – Websites like Forex Factory, Investing.com, or DailyFX provide real-time updates on economic events.
3. Understand Market Expectations vs. Reality – Markets often price in expectations before the news is released. If actual data deviates significantly from forecasts, a strong price movement may occur.
4. Trade with a Plan – Whether you are trading pre-news or post-news, have clear entry and exit strategies, stop-loss levels, and a defined risk-to-reward ratio.
5. Monitor Market Sentiment – Pay attention to how traders are reacting. Sentiment can drive price action more than the actual data.
6. Focus on Major Currency Pairs – News trading is most effective with liquid pairs like FX:EURUSD , FX:GBPUSD , FX:USDJPY , and OANDA:USDCAD because they have tighter spreads and high volatility.
3. What NOT to Do in News Trading
1. Don’t Trade Without a Stop-Loss – Extreme volatility can cause sudden reversals. A stop-loss helps prevent catastrophic losses.
2. Avoid Overleveraging – Leverage magnifies profits but also increases risk. Many traders blow accounts due to excessive leverage.
3. Don’t Chase the Market – Prices may spike and reverse within seconds. Jumping in late can lead to losses.
4. Avoid Trading Without Understanding News Impact – Not all economic releases cause the same level of volatility. Study past reactions before trading.
5. Don’t Rely Solely on News Trading – Long-term success requires a balanced strategy incorporating technical analysis and risk management.
4. The Unpredictability of News Trading
News trading is highly unpredictable. Even when a report meets expectations, market reactions can be erratic due to:
Market Sentiment Shifts – Traders might focus on different aspects of a report than expected.
Pre-Pricing Effects – If a news event was anticipated, the market might have already moved, causing a ‘buy the rumor, sell the news’ reaction.
Liquidity Issues – Spreads widen during major news events, increasing trading costs and slippage.
Unexpected Statements or Revisions – Central banks or government agencies can make last-minute statements that shake the market.
5. How News Affects Forex, Gold, and the U.S. Dollar
1. U.S. Dollar (USD) – The USD reacts strongly to NFP, CPI, FOMC statements, and GDP reports. Strong economic data strengthens the dollar, while weak data weakens it.
2. Gold (XAU/USD) – Gold is an inflation hedge and a safe-haven asset. It often moves inversely to the USD and rises during economic uncertainty.
3. Stock Market & Risk Sentiment – Positive economic news can boost stocks, while negative reports may trigger risk aversion, benefiting safe-haven currencies like JPY and CHF.
6. The Right Mindset for News Trading
1. Accept That Volatility is a Double-Edged Sword – Big moves can mean big profits, but also big losses.
2. Control Emotions – Fear and greed can lead to impulsive decisions. Stick to your strategy.
3. Risk Management is Key – Never risk more than a small percentage of your capital on a single trade.
4. Adaptability – Be prepared to change your approach if market conditions shift unexpectedly.
5. Patience and Experience Matter – The best traders wait for the right setups rather than forcing trades.
Thank you for your support!
FxPocket

Hot Inflation & What to Watch Next - 14/02/2514th of February 2025
•XRP and BNB leading, as Bitcoin trades flat in the last seven days.
•Headline inflation metrics in the US land above expectations.
•Impactful data point to watch heading into the end of February.
---
A big week of headlines and events, particularly out of the US, have netted very little change in Bitcoin’s price.
Bitcoin is down 0.1% at the time of writing in the last seven-days, while altcoins such as XRP and BNB are showing double-digit gains.
Bitcoin has struggled to make new year-to-date highs in the current state of global conditions. In contrast, global indices in the UK (FTSE100) and China (CSI300) have continued to make new year-to-date highs
Mixed Messages & Above Expected Results
Fed Chair Jerome Powell mentioned earlier this week at a senate banking enquiry that the current state of monetary policy does not require easing conditions, as the economy remains strong and the 2% target for inflation is key.
However, he has referenced that unexpected moves in the labour market or a significant cooling of inflation could change the committee’s mind.
“If the labor market were to weaken unexpectedly or inflation were to fall more quickly than anticipated, we can ease policy accordingly.”
On this point, headline metrics for inflation land above expectations this week.
On Tuesday, Consumer Price Index (CPI) landed above expectations at 3.0%, rising 0.1% from the previous month.
Overnight the Producers Price Index (PPI) landed above expectations at 3.5% year-on-year. This figure remains unchanged from the previous month and represents the inflation burden on producers in the US.
Key data to come
On the last day of February the US Personal Consumption Expenditures (PCE) data will provide further clarity towards the state of monetary policy heading into next month.
PCE is the leading indicator used by the policy committee to measure inflation.
Fear and greed currently reads 40 – neutral.
Bitcoin Analysis
The price of Bitcoin is currently trading within the January high and low range, and on the Bollinger band we are entering a period where the upper and bottom channel is compressing.
Bullish Scenario
In the coming days, price may see a sharp move higher as the Bollinger Bands tighten. If bulls regain control and reclaim the monthly open, they could push toward last month’s high.
Bearish Scenario
We could also with this compression in the Bollinger Bands, see volatility moving price to the downside. This may result in prices heading towards the January low.
DISCLAIMER: The information is for general information purposes only. It is not intended as legal, financial or investment advice and should not be construed or relied on as such. Before making any commitment of a legal or financial nature you should seek advice from a qualified and registered legal practitioner or financial or investment adviser. No material contained within this website should be construed or relied upon as providing recommendations in relation to any legal or financial product.

Daily Market Outlook: BTC & Forex Setups (#3) | CPI ImpactBefore jumping into today’s analysis, let’s quickly revisit yesterday’s key event – the CPI report. As expected, it triggered a major sell-off in both crypto and stock markets.
📌 BTC Daily – Bulls Still Holding the Line?
Despite the heavy selling pressure and low volume, BTC managed to close above the $95K support level yesterday.
📊 Key Observations:
Sellers dominated, but buyers are still holding ground within this daily range.
No confirmed breakdown below $95K, so yesterday’s short scenario is invalidated.
Market remains extremely volatile, making clean trade setups difficult.
📌 Plan: Sitting out of crypto today until we get a clearer structure.
📊 DXY – Time-Based Correction or Breakdown Incoming?
The Dollar Index (DXY) is currently in a time-based correction and testing a key support at 107.372.
📊 Potential Scenarios:
✅ If support holds, we might see DXY push higher, adding pressure to risk assets.
❌ If it breaks down, expect further declines toward 105.692 and possibly 103.451 (Fib levels).
📌 Bias: Short-term bearish, but cautious due to the overall uptrend.
📉 USD/JPY – Short Setup in Play?
USD/JPY has completed its corrective phase within a major downtrend and seems to be resuming its bearish momentum.
📊 Key Trade Setup:
🔹 Short Entry: 153.391 (if triggered)
🔹 Take-Profit Zone: 152.473 support
If momentum continues, this could be a clean short opportunity.
Final Thoughts & Risk Management
⚠ Market is still choppy—wait for clear confirmations before entering trades.
⚠ FOMO is your worst enemy, risk management is your best friend.
💬 I’m Skeptic, and I’ll see you tomorrow with another market breakdown! 🤍
⚠ Disclaimer: These trade setups are based on my personal analysis and are not financial advice. If you don’t have a solid risk management plan, these triggers may not be suitable for you. Always do your own research (DYOR) and trade at your own risk. 💡

us3o bearish confirmedif you emphasis on previous post us30 dropped as anticipated not that the price target has been breached but am going to wait for what transpires next as time moves on let wait

NAS100USD: CPI Volatility & Institutional Continuation Sell-OffGreetings Traders,
In today’s analysis on NAS100USD, we observe that the market remains bearish following a significant CPI news release. This high-impact event resulted in a sharp bearish displacement, reinforcing the ongoing bearish narrative. Yesterday, I shared an analysis predicting this continued bearishness. For those interested, you’ll find that analysis attached at the end of this description for deeper context.
KEY OBSERVATIONS:
CPI-Induced Displacement : The CPI release triggered a large downward move, forming a massive single candle that left behind a noticeable inefficiency—a Fair Value Gap (FVG).
Liquidity Grab & Fair Valuation: After sell stops were taken, price retraced to fill the FVG, restoring fair valuation. This retracement fully closed the gap, confirming a continuation of bearish order flow.
Premium Price Zone: We are currently in a deep premium price range, which aligns with institutional distribution zones. These areas offer excellent opportunities for confirmation-based sell entries.
TRADING PLAN:
Entry Strategy: Look for confirmation at the current premium price level before entering short positions.
Targets: Focus on discount liquidity pools at lower prices, as these are the areas institutions will likely target to take profits.
By following the institutional flow, we align ourselves with smart money practices, improving our precision and probability of success. Stay patient and disciplined—confirmation is key!
For more context, here’s yesterday’s analysis below.
Happy Trading!
The Architect 🏛📊

BTC CPI 1H (Jan) CPI (YoY)-
PREVIOUS: 2.9%
FORECAST: 2.9%
ACTUAL: ??
Consumer price index data release rolls around once again, this time the forecast is no change (0.0%) remaining at the same December 2024 level of 2.9%. It is important to note that after this data release there isn't any further news events of note until next month so BTC no planned interference from data releases.
As we go into the data release volatility on the LTF is common and so maybe we'll see a break of this painful trend bitcoin has been stuck in since the sell-off event. With that in mind here are some entry ideas for longs and shorts:
Long:
- The safest option/ highest probability would be a breakout from the bearish downtrend, a retest as new support and begin the move up back towards RANGE HIGH.
- A sweep of the green bullish OB zone with a tag of the lower bearish trend line. A good R:R IMO with the first point of interest being the LOCAL RESISTANCE/ bearish trend high.
Short:
- The bearish scenario would be a loss of the $91K support level that has held for the last 10 weeks in a row and is the daily range low. If price accepts under that level things could get ugly as there is no support until $85K.

CPI vs. Core CPI: The Gold Market MoversConsumer Price Index (CPI) and Core CPI are key economic indicators that significantly impact XAUUSD (gold prices). CPI measures the overall change in consumer prices for goods and services, reflecting inflation’s pace. Core CPI, however, excludes volatile food and energy prices, providing a clearer view of underlying inflation trends. When CPI or Core CPI figures are higher than expected, it signals rising inflation, prompting the Federal Reserve to consider tightening monetary policy by raising interest rates. This typically strengthens the US dollar and puts downward pressure on XAUUSD, as gold becomes more expensive for holders of other currencies. Conversely, lower-than-expected inflation can weaken the dollar, driving up gold prices as investors seek inflation hedges and safe-haven assets. Traders closely monitor these releases to anticipate XAUUSD movements and adjust their strategies accordingly. FUSIONMARKETS:XAUUSD

Bad CPI, Perfect Setup Opportunity for the S&P500Today’s CPI was really bad: 3% vs. 2.9%. Bad for markets, good for the Dollar, and everything got slapped - S&P 500 included.
But honestly, moments like this are often where the magic happens. Zoom in, and you’ll notice that the Monday Low is still sitting there untouched. In a few minutes, the New York Stock Exchange opens. What am I hoping for? A sweep of that Low, followed by a quick reversal and a push to the upside.
On the 1-hour chart, the RSI is already in oversold territory. A sell-off at the open would be the perfect entry, aiming for a 1:3 risk-reward ratio. If the market plays along, this could get real interesting real fast.
🔹 Asset: S&P 500
🔹 Timeframe: 1H
🔹 Entry: 5974.60
🔹 Stop: 5936.90
🔹 Target(s): 6085.86

EURUSD 12 Feb 2025 W7 - Intraday Analysis - CPI, Powell & TariffThis is my Intraday analysis on EURUSD for 12 Feb 2025 W7 based on Smart Money Concept (SMC) which includes the following:
Market Sentiment
4H Chart Analysis
15m Chart Analysis
Market Sentiment
In my Weekly Analysis, tariffs continue to dominate the narrative, yet market reactions have become the primary focus. The critical question is whether investors have grown accustomed to tariff-related news—leading to muted responses—or if the persistent tariff war rhetoric will trigger renewed market anxiety.
Notably, Powell’s testimony yesterday failed to offer any fresh insights; however, there is hope that today’s session might shed some light on future policy directions. Additionally, the USD’s weakness observed at the close of trading yesterday appears to have been driven more by reports of a territorial swap in Ukraine’s peace deal—and possibly an initial leak of the CPI data—rather than by Powell’s remarks.
Today’s CPI report is expected to be a significant driver of market volatility. Investors are eagerly anticipating softer CPI numbers, which could encourage the Fed to consider not only an earlier rate cut but potentially two cuts this year, contrasting with the current market consensus of just one. While tariffs are clearly contributing to upward inflationary pressures and prompting a cautious stance from the Fed, the immediate volatility is likely to stem from the CPI data. The market will be closely watching whether the tariffs are being employed as a negotiating tactic—or if they signal an intentional escalation towards a trade war.
Markets face a tug-of-war between CPI-driven rate hopes and tariff-induced risks. While CPI may spark a tactical rally if soft, tariffs remain the swing factor – any escalation (e.g., new retaliatory measures) would overshadow short-term data. Position for choppy trading until Trump’s tariff strategy crystallizes.
4H Chart Analysis
1️⃣
🔹Swing Bullish
🔹INT Bearish
🔹Reached Swing Extreme Demand
🔹Swing Continuation
2️⃣
🔹With the deep pullback to the Bullish Swing extreme discount and mitigating the 4H/Daily demand zones, price turned Bullish forming a Bullish CHoCH.
🔹The current Bullish move from Swing extreme discount to current price level having 2 scenarios:
Scenario 1: Pullback for Bearish INT Structure and with the recent Bearish CHoCK and Minor Demand zones are failing, I expect Bearish continuation to target the Weak INT Low which aligns with the Daily/Weekly Bearish Structure/Move. (Counter Swing – Pro Internal)
Scenario 2: Bullish Swing continuation to target the Weak Swing High. Which requires to have Demand holding and Supply failing. The first sign required to confirm this scenario will be the current Demand which price is currently at to hold and we form a Bullish CHoCH. (Pro Swing – Counter Internal)
🔹The reaction from the recent 4H Demand Zone formed a Bullish CHoCH and a fresh Demand zone where price can pullback to after tapping the recent 4H Supply Zone.
3️⃣
🔹Expectations is set to Bearish to target the Weak INT Low as long LTFs turning Bearish.
15m Chart Analysis
1️⃣
🔹Swing Bearish
🔹INT Bullish
🔹At Swing Premium
2️⃣
🔹With yesterday PA, price failed to continue Bearish and created a Bullish i-BOS.
🔹Price reached the 4H supply as anticipated and mitigated the 15m Supply within the 4H to maybe initiate the Bullish INT Structure pullback phase and if the swing is going to continue Bearish there is a high probability to target the Strong INT Low.
🔹The current Bullish i-BOS aligns with the 4H Swing where we have also a high probability that we can target the 15m Strong Swing High.
🔹With the inconsistency of Time frames alignments, a clear direction is difficult to identify which requires a sit back and watch till we have a clear direction.
3️⃣
🔹From an intraday perspective, expectations are set to Bearish to facilitate the Bullish INT Structure pullback.
🔹Today’s CPI, Powell and Tariffs talks will have high volatility that could direct me tomorrow or next week for a clearer direction move.

XAUUSD Trade Log
🚨 XAUUSD Long Zones: High-Probability Entries 🚨
Gold has been on a strong move, but smart money doesn’t chase— TDV traders wait for prime entries.
🔴 First Long Entry: A swing long opportunity where I’ll get in but move to break-even fast. Why? The real opportunity is lower.
🔴 Bad Boy Entry: This is where I’ll scale in aggressively, with:
✅ Daily discount level
✅ Weekly Break of Structure (BOS)
✅ Confluence of daily & hourly levels
For risk:
⚡ 2% for prop traders
⚡ 5% for personal equity accounts
This is how TDV plays the game—strategic, calculated, and ahead of the herd.
