Crude oil a leading inflation indicatorTwo observation made the last two years between crude oil and CPI:
1) There were 5 waves up and
2) 3 significant peaks
However, between the last 2 peaks of crude, it was a lower low follow-by its downtrend, and CPI followed this downtrend subsequently.
Among many commodities, crude oil moves the most in tandem with CPI, but crude seems to lead in this study.
Refer to the daily chart on your own, try drawing a downtrend line, you will see crude oil prices has broken above its downtrend line recently. If crude oil is going to transit to an uptrend from here, we will have to track CPI very closely. The inflation fear is still there.
Did a video on this observation last week, refer to the link below.
Crude Oil Futures
Minimum fluctuation
0.01 = $10
0.10 = $100
1.00 = $1,000
10.00 = $10,000
Disclaimer:
• What presented here is not a recommendation, please consult your licensed broker.
• Our mission is to create lateral thinking skills for every investor and trader, knowing when to take a calculated risk with market uncertainty and a bolder risk when opportunity arises.
CME Real-time Market Data help identify trading set-ups in real-time and express my market views. If you have futures in your trading portfolio, you can check out on CME Group data plans available that suit your trading needs www.tradingview.com
CPI

NZDUSD | CPI DATA | DECRYPTERSHi people welcome to Team Decrypters
we are Expecting the Break out on NZD USD on Tuesday Obviously its a Very Daring and high risk to say this openly but lets see How it goes.
We Always believe News will Add volatility in to the pattern even if its for short term

JICPT|DXY is on the verge of rebound on the weeklyHello everyone. Dollar index has retreated from the high around 114 created in late September when investors expected inflation would be cooling soon.
To make it clear, I also inserted U.S core CPI year-over-year data on the weekly chart. You can refer to the purple line. Obviously, The dollar index moved in line with the CPI data. Both topped around the same time.
When we looked at the DXY rising angle, we can see it accelerated to the upside since March 16, 2022, when Fed raised interest rate for the first time since the pandemic by 25bps. The main driving force behind the move is inflation. So what's next after the Dollar index took a dive of 50%.
From my point of view, the index may held above 100 for a while(relative strong) until inflation is confirmed to go back to the 2% target. That may happen in the H2 2023. The reasons are below:
1. After the dramatic move, sellers need to take a rest around key zones(fib 50-61.8%)
2. Dollar index has been over sold.
3. 100 combined with a strong demand zone is likely to prevent it from further drop.
If I'm right, there will be short opportunities for gold, and other currencies, e.g., EUR.
What do you think? Give me a like if you're with me.

The Revival In the past two weeks, the market has seen a significant increase in bullish momentum leading many to believe that the proposed ‘echo bubble’ that many predicted for 2023 may indeed play out.
It was initially unclear what was driving this momentum but the market gaining confidence that CPI will continue to decrease, as well as a temporary liquidity increase thanks to the ongoing US Debt Ceiling increase crisis, seem to be important factors. The U.S. CPI data published on the 12th of February was in line with expectations with a 0.1% reduction. There is evidence to suggest that if CPI inflation continues to fall in 0.1% increments M/M, and if recessionary predictions play out as expected, then the FED could potentially hit its 2% Y/Y target as soon as May. An important thing to note is that this was the last CPI print that will be calculated based on the current methodology that considers two years of data. February’s data will be calculated on a single year of data meaning that future 2023 CPI prints will be based on consumption in 2021 alone. Considering 2021 data instead of 2020 and 2021 will likely bring the upcoming CPI numbers down leading analysts to believe that the FED is indeed engineering a pivot.
One event that could temporarily put a halt to the rally is that Genesis, the parent company of Grayscale, is said to be planning to apply for chapter 11 bankruptcy as soon as this week. It’s worth noting that the discount on $GBTC has widened to -43% over recent days after it had climbed back up to -36.5% following the December lows. Many analysts feel that the market already has this event priced in, however, it is certainly something to keep an eye on.
From a technical perspective, Bitcoin broke out from the falling wedge pattern and ripped above $20,000. Bulls will be hoping for a weekly close above the $21,000 resistance which would light the way towards $28,700 which is the prior head and shoulders neckline and 61.8% Fibonacci retracement level of the $3,782 2020 low to $69,000 2021 high. Bears will support the prediction of Elliot Wave theory that the observed rally is part of a Wave 4 correction. This means the market could potentially still have a Wave 5 selloff to come which would test the lows. The above Bitcoin weekly chart shows that the bullish momentum the market is experiencing in 2023 lies within the boundaries of Wave 4 meaning that the market may not be not out of the woods yet.
An important event to watch in the coming weeks is the FOMC meeting on the 1st of February. Following this meeting, the FED will release projections for the Federal Funds Rate in the coming quarters which will have a significant bearing on the short-run market direction. Volatility will be high around this time and caution should be exercised when entering positions.

Correlation – Crude Oil & CPIStudies indicated Crude Oil is the best indicator to track the current inflation.
It is also a leading indicator to inflation numbers? If that is true, we will have to track the crude oil prices very closely.
Content:
i. The most inline commodity with CPI
ii. Can the Crude Oil track CPI?
iii. Direction of Crude Oil
Crude Oil Futures
Minimum fluctuation
0.01 = $10
0.10 = $100
1.00 = $1,000
10.00 = $10,000
Disclaimer:
• What presented here is not a recommendation, please consult your licensed broker.
• Our mission is to create lateral thinking skills for every investor and trader, knowing when to take a calculated risk with market uncertainty and a bolder risk when opportunity arises.
CME Real-time Market Data help identify trading set-ups in real-time and express my market views. If you have futures in your trading portfolio, you can check out on CME Group data plans available that suit your trading needs www.tradingview.com

Cable Pushing Higher After UK CPI Data Cable is back in an uptrend after a capitulation back in September, with the current price making some extended move up after breaking above 1.2 psychological level. We see Cable unfolding a five-wave bullish impulse from the lows, with more upside coming after recent pullback from the highs that unfolded as a correction. Ideally, that was subwave four that can not send the price back into an uptrend after a break above 1.2150 resistance. Ideally thats now the beginning of a new fifth wave higher. Some spectators are also betting on GBP as they believe BoE should be more hawkish with CPI at 10.5%.

Putting All Your Eggs in One BasketCME: Pork Cutout ( CME:PRK1! ), CBOT: Corn ( CBOT:ZC1! ), Soybean Meal ( CBOT:ZM1! )
Diversification is a fundamental concept in investing. In order to minimize the chances that market volatility wipes out your entire net worth, it is important to put your money in several investments with different levels of risk and potential return. This is summarized nicely in a single phrase – “Don’t put all your eggs in one basket”.
In 2022, however, if you have followed this time-honored advice and allocated your money carefully across major assets, you would have lost money! Why did diversification fail this time? Let’s look at the annual return by major investment category:
• Stock Market: S&P 500, -13.9%, Nasdaq 100, -25.5%
• Bond Market: 2-Year T-Notes, +6.7%, 10-Year T Notes: -10.6%
• Precious Metals: Gold, -6.9%, Silver, +8.8%
• Currencies: US dollar index, +6.7%, Euro, -4.1%, British Pound: -9.9%
• Energy: WTI crude oil, +1.2%, Henry Hub natural gas, -12.7%
• Agricultural Commodities: Wheat, -1.9%, Corn, +11.3%
• Cryptocurrencies: Bitcoin, -53.3%, ETH, -55.4%
A diversified portfolio is not necessarily low risk. In time of distress, assets thought to have low correlation could all move in the same direction – going down. Last year, geopolitical crisis, high inflation and central bank tightening took turns driving financial markets lower.
When a major crisis breaks out, all correlation goes to 1. This happened in 1998, when the Russian debt default took down Long Term Capital Management (LTCM), the largest hedge fund in the world. It repeated in 2007 and 2008, when the subprime crisis bankrupted Bear Stern and Lehman Brothers, the mighty Wall Street investment banks. It also wiped out the entire asset class in credit default swaps and exotic mortgage-backed securities.
In this past year, troubles in one crypto Exchange, FTX, drove all cryptocurrencies down. Bitcoin, Ethereum and stablecoins all lost value by half, even though the decentralized nature of the crypto market design is supposed to prevent this from happening.
The Soaring Egg Price
Ironically, if you put all your eggs in one basket, figurately, your investment would have doubled! According to price data reported by the Bureau of Labor Statistics, Large Shell Eggs, Grade A, have average retail price at $4.25 per dozen across US cities at the end of December, up 112% for the year.
A portfolio of shell eggs beats the return of all 15 assets listed above, by a wide margin! A new term, Eggflation , has been invented to capture this phenomenon.
Americans in recent years have increased egg consumption while reducing intake of red meat in their diet, according to data from the U.S. Department of Agriculture.
Interesting statistics : the total flock of egg-laying hens in the U.S. is around 320 million, almost matching the population of people. Each grown hen could lay as many as 320 eggs a year. And each of us eats about as many eggs as one hen can lay in a year.
Egg consumption has grown in part because more families are eating them as their main protein diet. As demand for eggs has risen, chicken production in the U.S. has slumped as we are currently experiencing the most severe avian (bird) flu epidemic in the US history. Nearly 58 million chickens have been infected with bird flu as of January 6th, according to the USDA. Infected birds must be slaughtered, causing egg supplies to fall and egg prices to surge.
So far, the total flock of egg-laying hens is down about 5% from its normal size, as farmers work hard to replace their flocks as soon as they can after an outbreak. On average, new-birth chicks take four months to grow into egg-laying hens. Egg prices are not likely to fall in coming months until decease-free hens are fully grown.
While US CPI has cooled to 6.5% in December, inflation for food items is much higher at 10.4%. Eggs are just one of many food staples that skyrocketed in price in 2022. Margarine costs in December surged 44% from a year ago, while butter rose 31%, according to the CPI data.
Egg Futures Contracts in the US and in China
CME Group, the world’s largest Derivatives Exchange, traced its root to the Chicago Butter and Egg Board founded in 1898. Standardized egg futures contract started trading in 1919, as the Exchange reorganized as Chicago Mercantile Exchange. CME egg futures were actively traded for sixty years. As the egg industry consolidated and egg prices stabilized over the years, the contract was delisted in 1982.
In November 2013, China’s Dalian Commodity Exchange launched its own Egg Futures. The contract is based on 5 metric tons of shell eggs. As a consultant, I assisted DCE in contract launch as well as ongoing support. On January 13th, daily trading volume of DCE egg futures was 98,893 lots, with open interest standing at 204,202 contracts.
A Case for Intermarket Spread
The huge surge in egg prices amplifies the market risks for egg industry. Without the price discovery function at the futures market, farmers would have a hard time projecting future price trend. They rely on cash market prices to make production decisions.
It takes four months to grow chicks into egg-laying age. Each commercially-raised hen will lay eggs for 1-1/2 years before being slaughtered. For each flock, farmers face price risks for up to two years. The main feed ingredients, corn and soybean meal, could be hedged with CBOT futures contracts. But egg and chicken prices are exposed naked.
Farmers are rapidly expanding their flocks as egg price skyrocketed. At some point, there will be too many chickens in the henhouse, causing egg price to crash.
Maybe an egg futures contract could make a big difference. I think it is time to bring back the CME egg futures.
Until then, you could consider intermarket spread if you want to participate in the market:
Buy Pork Cutout (PRK) and Sell Corn (ZC) and Soybean Meal (ZM) futures. August PRK rose 14% from October and currently prices at 30% above the front February contract.
• Like Hog Margins, this intermarket spread attempts to capture the profit margins in egg production. This is based on projected up trend in both pork and egg prices.
A second intermarket spread is to Buy DCE Egg Futures (JD) and Sell CBOT Corn (ZC) and Soybean Meal (ZM) futures, if you could trade the Chinese futures market.
Finally, you could buy shell eggs in cash market and store them in a cold storage. You would make money if future egg price surge could cover the storage cost.
Happy trading.
Disclaimers
*Trade ideas cited above are for illustration only, as an integral part of a case study to demonstrate the fundamental concepts in risk management under the market scenarios being discussed. They shall not be construed as investment recommendations or advice. Nor are they used to promote any specific products, or services.
CME Real-time Market Data help identify trade set-ups and express my market views. If you have futures in your trading portfolio, check out on CME Group data plans in TradingView that suit your trading needs www.tradingview.com

FX + ECONOMY | EVENT - WEEKLY PREVIEW | KW03 |In today's article, we will go into all the important events,
which are scheduled in the economic calendar, for the next week.
> Calendar week | 03 - - - 16. January 2023 – 20. January 2023
Let's briefly discuss what the listed events mean for your personal trading.
> When you want to trade a currency pair, you should always be careful that you do not accidentally get into an "event".
> These events can end in random volatility, which technical analysis does not respect, and therefore a possible loss.
> A strategy of "Market-Makers" is to liquidate both sides (short | long) to the event and then continue the participated direction.
MONDAY
> CAD | 10:30 p.m. | BOC = Business Outlook Survey
TUESDAY
> GBP | 02:00 a.m. | Employment change + unemployment rate
> EUR | 05:00 a.m. | GER Harmonized Index of Consumer Prices
> CAD | 08:30 a.m. | CPI = Consumer Price Index
> USD | 08:30 a.m. | Change in manufacturing index
WEDNESDAY
> GBP | 02:00 a.m. | CPI = Consumer Price Index
> USD | 08:30 a.m. | Retail Sales
> AUD | 07:30 p.m. | Employment change + unemployment rate
THURSDAY
> Nothing to relevant
FRIDAY
> CAD | 08:30 a.m. | Retail sales
Wednesday will be among certainly the most volatile, with the release of the American "retail sales", at 08:30.
MARKET INFLUENCE
Each of these dates, leads in the respective currency pair, to high / moderate volatility.
> Events that make the overall market volatile are mostly related to the USD.
= This is due to the fact that the USD has a position as an indirect world currency through global acceptance and thus has significant influence on the other currency pairs / economy.
To use an example to explain the influence of the USD on other currency pairs, let's look at the DXY (USD index).
The DXY is composed of the pairs:
EUR (57.6%), JPY (13.6%), GBP (11.9%), CAD (9.1%), SEC (4.2%) + CHF (3.6%)
When a positive metric is published for the USD = its value rises.
= The pressure on the currencies in the DXY basket increases.
= Thus they are "negatively" valued by traders.
= Sell-off
In summary, the higher the country's opinion on the global economy, the greater impact it takes on the overall market.
> Feel free to share in the comments, about the impact of this week's appointments.
> Sharing your perspective allows each of us to improve.
If this explanation has added value to you, I would be very happy to receive a rating.
Thank you and happy trading!
ZIEL IST DIE AUTARKIE | THE GOAL IS SELF-SUFFICIENCY

SELL EUR USD WHEN BACK IN RANGE !!Market Manipulation Happened on the last week after CPI
now we going down because Inflation Work Lay offs and more data release next week
STAY PROFITABLE !!!

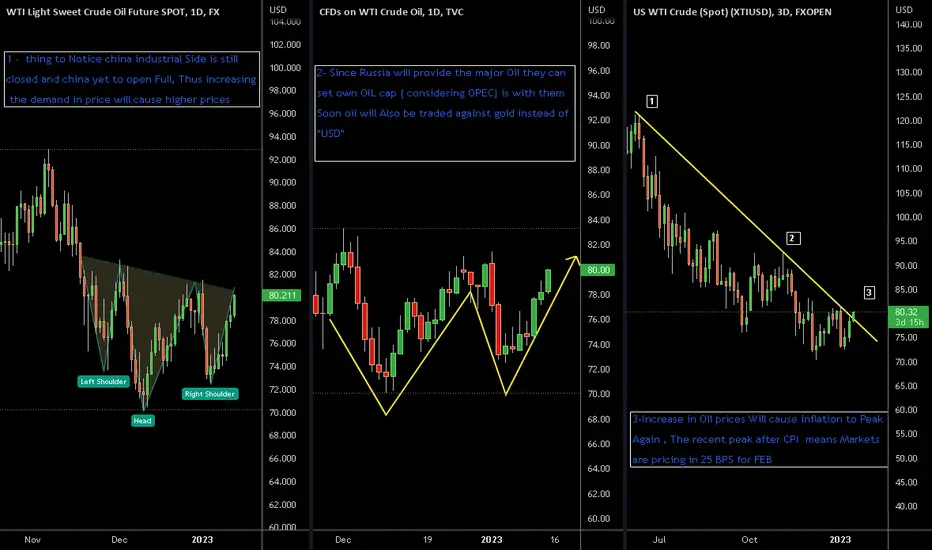
USOIL | DECRYPTERS | US OILHi people Welcome to our OIL Analysis
We put Our Technical and Fundamental Analysis together So both can be Combined
1- My Political Aspect is FED wanted to show people that their polices are working the oil prices will move inflation again.
2- Strength of USD was keeping US inflation low relative to Other countries ,but if USD get deep dive more it'll also fuel the inflation.
3- If US make USD more strong they can buy oil at cheaper prices i Really think it will go for that , Four our Technical point of view look our Dxy Analysis.
Morning Update- The Yens For The WinI don't have much to say about this week's trading except, glad it went the way it did and CPI data helped price move this week.
I took advantage of a few Japanese Yen trades. My hopes is that you did too. In my humble opinion, they moved better to me than most currency pairs did.
So, yay! It's the Yen's for the win!
Now to update.
Most Yen pairs made new lows. This is the best time to update your charts to find an opportunity to possible sell again, if your strategy meshes with the recent movement of course.
I'd love to see fullbacks via the daily timeframe before I enter another longterm swing again, but thats just me.
Be well. Happy Friday. Enjoy your weekend.
I'll see you all Sunday night at 8:00 pm EST. for another live stream.
-Shaquan

CPI & Inflation Rate USHello everyone! Let's take a look on what happened yesterday on the US financial market and understand the impact of CPI and inflation rate.
The Consumer Price Index (CPI) and inflation news from the United States can have a significant impact on financial markets and the value of the U.S. dollar. The CPI measures the change in the price of a basket of goods and services consumed by households, and inflation is the rate at which the general level of prices for goods and services is rising.
When the CPI and inflation numbers are higher than expected , it can indicate that the economy is growing, which can boost stock prices, lead to higher interest rates, and appreciate the dollar. This is because as the economy grows, companies will see increased demand for their products and services, which can lead to higher profits and stock prices. Higher interest rates can also attract more investors to bonds, which can lead to higher bond prices. Additionally, a strong economy can lead to increased demand for U.S. goods and services, and increased foreign investment in the U.S. economy. As a result, the demand for dollars increases, which can lead to an increase in the value of the dollar.
On the other hand, if the CPI and inflation numbers are lower than expected , it can indicate that the economy is slowing down , which can lead to lower stock prices, lower interest rates and depreciation of the dollar. This is because as the economy slows down, companies will see decreased demand for their products and services, which can lead to lower profits and stock prices. Lower interest rates can also lead to less investors in bonds, which can lead to lower bond prices. Additionally, a weak economy can lead to decreased demand for U.S. goods and services, and decreased foreign investment in the U.S. economy. As a result, the demand for dollars decreases, which can lead to a decrease in the value of the dollar.
It's important to note that the Federal Reserve uses inflation as an indicator to change the monetary policy, as they use interest rates as a tool to control inflation. Typically if inflation is too high, the Fed will increase interest rates to slow down the economy and curb inflation, and if inflation is too low, the Fed will decrease interest rates to stimulate the economy. These monetary policy decisions can also have an impact on the value of the dollar, as when the Fed raises interest rates, it can make the U.S. a more attractive place to invest, which can lead to an appreciation of the dollar. Conversely, when the Fed lowers interest rates, it can make the U.S. a less attractive place to invest, which can lead to a depreciation of the dollar.

A Grim Picture of InflationFed Funds Futures (ZQ) CBOT:ZQ1! , 2-Yr Yield (2YY) CBOT_MINI:2YY1! , 10-Yr Yield (10Y) CBOT_MINI:10Y1!
This is the third report in the series “Year of the Rabbit: Short-tailed Trading”.
US Consumer Price Index (CPI) declined 0.1% in December 2022 on a seasonally adjusted basis, after increasing 0.1% in November, the U.S. Bureau of Labor Statistics reported on Thursday, January 12th. Over the last 12 months, the headline CPI increased 6.5%. The inflation index for all items less food and energy rose 0.3% in December, after rising 0.2% in November. The Core CPI increased 5.7% year-over-year.
December is the only month in 2022 when aggregate price falls below prior-month level. The headline CPI is now 0.5% lower than a year ago on an annualized basis.
Cooling inflation is welcoming news to consumers, businesses, and investors. It also gives the US Federal Reserve more flexibility to moderate its hawkish monetary policy.
Inflation by Category Data Paints a Different Picture
The December CPI data was a “one-man show”. Gasoline price declined 9.4% in one month, bringing its annual change to -1.5%. After an all-time high record of $5/gallon reached in June, we ended 2022 with lower gasoline price year-over-year.
If you think we are getting relief in energy cost, nothing could be further from the truth.
• Fuel oil dropped 16.6% in December, but it is up 41.5% for the year
• Electricity price went up 1% in December and +14.3% for the year
• Pipelined natural gas were up 3% monthly and +19.3% yearly
Americans are getting bigger utility bills to light up the room and heat the house this winter.
Other essential items:
• Food cost +0.3% in December and +10.4% Y/Y in 2022
• Shelter cost +0.8% monthly and +7.5% annually
• New cars cost 5.9% more but used cars are 8.8% cheaper in 2022
Inflation is certainly on the way down, but it is sticky. Many product and service items essential to household living and business operation are far from under control.
Interest Rate Outlook for 2023
After the release of new CPI data, market consensus centers on a modest 25-basis-point increase on February 1st., which would bring the Fed Funds rate up to 4.50-4.75%. I also expect another 25-bp raise on March 22nd, setting the so-called terminal rate at 4.75-5.00% for the rest of 2023. This is my baseline forecast for 2023.
The previous section shows that inflation is still uncomfortably high for food, housing, and energy to power the home, as well as for new vehicle. The Fed’s job for fighting inflation is far from over. I do not expect any rate cuts to occur in foreseeable future.
When it comes to central bank monetary policy, there is a lagging period before it works its way through the economy. The response lag could be anywhere from 6 to 12 months. By my estimate, it takes about 7 months in this rate-hike cycle.
The Fed initiated the first increase in March, but inflation did not peak until June at 9.1%. Monthly CPI was unchanged the following month. However, the slowdown was solely due to a sharp decline in gasoline price, not attributable to the Fed.
Core CPI topped 6.6% in September, then subsequently moved lower to 6.3%, 6.0% and 5.7% in the fourth quarter. October was the first month when core inflation reverses its rising path. This is where I mark the start of inflation response to monetary tightening.
Once the Fed reaches its terminal rate, the force of inertia would carry the policy impact on inflation for several more months. That’s why the Fed is likely to keep the rate unchanged for the remainder of 2023, measuring the policy effect.
Fixed Income Investment Opportunities
On “The Real Cost of Fed Rate Hikes”, published on July 25th, I spelled out the impact of interest rate increases to households, corporations, Federal and local governments.
With the risk-free rate expected to reach 5%, all borrowing cost will go up further, even after they rose significantly last year. As the economy slows down, those with high debt loads may not make it through this downturn.
If you plan on investing in bonds, default risk should be on the very top of your mind. Consider safe play: Avoid any issuer with a high debt-to-equity ratio. Corporate high-yield, municipal bonds, and securities backed by adjustable-rate mortgages and credit card balance fit this bill.
JPMorgan Chase took notice. On Friday the 13th, JPM NYSE:JPM posted revenue that beat expectations, but the biggest US bank warned it was setting aside more money to cover credit losses because of a “mild recession” is its “central case.” The bank posted a $2.3 billion provision for credit losses in Q4, a 49% increase from the 3rd quarter.
For relatively safe investment options, bank certificates of deposits (Jumbo CD) and high-quality corporate bonds (rated A or above) offer yields from 4.50% to 6.0%. They could beat inflation in the coming years.
Spread Trade Opportunities
We have been in a negative yield-curve environment since July. In my opinion, slower rate hikes weaken the force that drives short-term yield rising faster than long-term ones. Once the Fed actions are over, mean reversion could occur so long as we do not fall into a deep recession.
A Refresher: Yield curve plots the interest rates on government bonds with different maturity dates, notably 3-month Treasury Bills, 2-year and 10-year Treasury Notes, 15-year and 30-year Treasury Bonds.
Bond investors expect to be paid more for locking up their money for a long stretch, so interest rates on long-term debt are normally higher than those on short-term. Plotted out on a chart, the various yields for bonds create an upward sloping line.
Sometimes short-term rates rise above long-term ones. That negative relationship is called yield curve inversion. An inversion has preceded every U.S. recession for the past half century, so it’s seen as a leading indicator of economic downturn.
On January 12th, 2-year T-note is quoted at 4.20% in cash market, while the 10-year T-note is priced at 3.61%. This measures the 10Y-2Y yield spread at 59 basis points.
The negative yield curve could become less inverted, then change to a flat yield curve in the coming months. It could reverse back to an upward sloping normal yield curve in 2024. Here are my reasoning:
• Easy money created by record government spending kept the borrowing cost low. This was a main reason why longer-term yields rise less than short-term ones.
• The new Republican-controlled Congress would stall the approval of big-ticket expenditure bills. Closing the flood gate could bring the borrowing cost back up.
• After the depletion of low-cost capital, lenders will have no choice but to raise the long-term lending rate above the short-term deposit rate.
CBOT Micro Yield Futures offer a way to express your view on future yield direction. You could also observe how the expected yield spread changes between 10Y and 2Y.
On January 12th, February Micro 10Y Yield Futures (10YG3) was settled at 3.446. February Micro 2Y Yield Futures (2YYG3) was settled at 4.081. The 10Y-2Y spread is -63.5 basis points.
Micro Yield Futures are notional at 1,000 index point, with each point equal to 1/10 of 1 basis point and value at $1. For example, if the 10Y-2Y spread narrows to -40 basis points, your position would gain $235 (= (-40+63.5) x 10) if you long the spread.
To trade Micro Yield futures, margins are $375 for 10Y and 2YY. A long spread can be constructed by a Long 10Y and a Short 2YY positions.
Happy trading.
Disclaimers
*Trade ideas cited above are for illustration only, as an integral part of a case study to demonstrate the fundamental concepts in risk management under the market scenarios being discussed. They shall not be construed as investment recommendations or advice. Nor are they used to promote any specific products, or services.
CME Real-time Market Data help identify trade set-ups and express my market views. If you have futures in your trading portfolio, check out on CME Group data plans in TradingView that suit your trading needs www.tradingview.com

INFLATION RATE AND BTC MOONHello Traders
As you know, the inflation rate decreased to 6% in the past day, this news created a significant bullish movement for Bitcoin Price, but don't get FOMO, Yet. As you can see Bitcoin's overall Technical shows that, the price is still in a bearish phase in the bigger picture, and is currently on an excellent resistance level, both Dynamic and static.
On the Onchan side, I screenshotted a metric called Net realized Profit/Loss, Net Realized Profit/Loss is the net profit or loss of all moved coins, the value shows that the whole network was moving their bitcoins in profits today, which can cause a reversal in the bullish trend.
Overall I can see a Correction or consolidation for bitcoin before the bullish phase.
Note that this is an Intraday analysis and is only valid for a couple of days or even hours.
------------------------------------------------------------------------
What is your opinion? Comment below.
If you like the idea, please hit the boost button and follow me so you will get the updates. The information given is never financial advice. Always do your research too.
Good luck.

GBPUSD after CPIYesterday we saw big swings during the news. In GBPUSD we saw a pullback off the support zone and a new high.
It’s crucial now to see if this movement has the strength to continue.
We’re looking at a new support zone that in the near hours we expect a reaction from.
Upon another rise the goal will be 1,2315.
The scenario fails on a breakout of 1,2087.

AUTF: 8H
Hanging man candlestick formed across the 4h and 8h TFs which could lead to a move lower. Might be corrective to todays impulse or a correction to the move higher over the last few months.

SPY Let´s see how it reacts nowCPI data came out on a good note. 6,5% is better than the 8.7% we were talking about a couple of months later. Are we on the path back to lower numbers or is a second wave coming? Who knows. Next weeks will decide if we can be out of the bear market or if we go on to lower lows.

Rally into 2023? Likely rally into 2023, spurred by downward trend in inflation. Likely 25bp hike at next meeting, then full stop to evaluate the damage (and give time for lagging economic data to catch up to policy changes). Unemployment will rise, possibly some deflation, and fed will cut rates towards the end of 2023 in response to negative economic data. This will cause a second drawdown. Well, the rates will be correlated with a second drawdown, but the real correlation will be between the negative data and equities.
My initial thoughts as we move into a new year. Should be an interesting one.
Love,
InTheMoney

Us vixUs near to support level
Support level zone at 20.56
The falling vix shows their is no fear among masses globally regards to inflation and results of corporate upcoming
Just a view ask your financial advisor before buying on my view
For educational purposes

CPI News/ Are We Finally Out of a Bear Market?A few weeks ago, after reanalyzing the COT positioning. I saw that the dealer was acummulating short positions leading into the new year after taking liquidity from
below multi year lows.
We are still early in the new year. This could be a rebalancing or higher time frame such as a 3 month and above, bottom.
Against the COT, I am long until the 1.31 mark.

CPI in line won't do the trick! Or will it?CPI at 6.5%. In line with expectations. Market remains rather neutral. Which means the news will probably not be a big enough kick to get us to the topside of major resistance on the charts. Unless/until JPOW & Co. actually pivot, either via language or actions, the market is likely to continue its current price action underneath our downtrend resistance.
Stew

ES - S&P 500 Retest and Down We GoWith the "cooked" CPI, let us examine the ES Chart.
1. The dotted yellow TL's show the OVERShoot and UNDERShoot, which are perfectly in line with the Medianlines.
2. Price was going up from the Zero to Five Count and broke the confirmed Pivot 4. This leads into a potential new start of the next Downtrend.
3. From the red 1, up to where we are now (2023/01/12), this looks like a perfect market manipulation in line with the CPI. However, with or without CPI, we see where price bangs it's head to day on a intraday view. Right at the U-MLH.
We could either get a hard rejection from here, or price even get's pushed up to the yellow sliding parallel.
4. The Stochastic also shows a negative sign since price got pushed up to the U-MLH. If your backtest this Oscillator, then you know that most of the time there's a push in the opposite side before price synchronizes.
Or in short: Watch the Rocket Man §8-)
Stay save and trade with Brain.

USDJPY I It will return to resistance Welcome back! Let me know your thoughts in the comments!
**USDJPY Analysis - Listen to video!
We recommend that you keep this pair on your watchlist and enter when the entry criteria of your strategy is met.
Please support this idea with a LIKE and COMMENT if you find it useful and Click "Follow" on our profile if you'd like these trade ideas delivered straight to your email in the future.
Thanks for your continued support!
