US500 CPIWhat do you see?
I think its going to reprice to 3869.3 swing low or even further
STAY OUT:)
CPI

BTC US CPI DAY JANUARYHello dear traders, we have CPI DAY
BTC took an incredible flight upwards yesterday at the end of the US session and did not give us a chance to catch this good trend
Today's CPI rules - if we hold $17800 we go up to at least $19079 and higher
I see the strongest support as the $17900 level below which when the whole candle closes on the 30 minute chart can start a bearish trend right away
I will open LONG somewhere between $18000 to $17900 if we even look there, CPI is in about 25 minutes

CPI BEARISH M0VELooking at today's EURUSD it is bullish longterm but in the short term it has to drop down first and it's going to use CPI to do it. It has been consolidating for 2 days now to build orders and liquidity just after taking liquidity off an old high on Monday in preparation for the big news today. I see 2 possible areas for it to continue it's bullishness and both areas have those blue boxes. Cheers 🥂

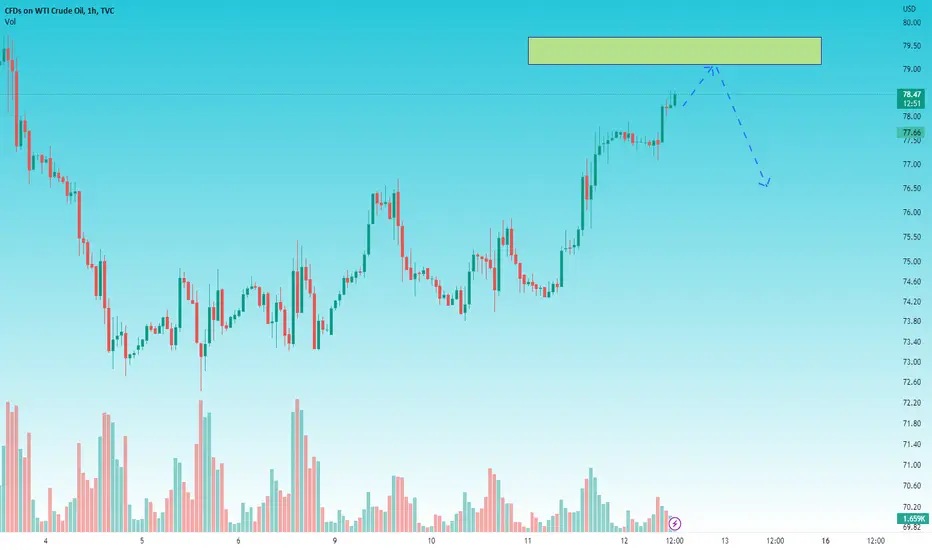
brent shortIf we see the entry signal in this zone with the set loss limit, we will enter the matter of the degree of ascent, but keep in mind that this signal is used in the upper periods, so you must be patient enough, but if the goals are achieved, there will be a good profit.
SPX - We are still within the range!SPX - We are still within the range!
SPX - For most indices we've had bullish momentum especially in Europe side cac, ftse, dax amazing moves but we are still struggling when it comes to US Indices. We've had great bullish momentum at the end of the week now let's not get too excited we are still within the ranges things to keep in mind this week going forward CPI, Q4 earnings, Unemployment claims coming out of US.
Key tip: Ignore the noise and focus on the chart in front of you. Everyone has opinions, they'll even comment on your career choice but most importantly only YOU can learn and earn by the execution of your own trades.
A break to either direction.
Trade Journal

Will US CPI continue to feed the risk rally?Eyes on today's CPI
Risk markets set the tone on Wednesday as traders reacted to hopes that Today’s CPI data will come in lower than expected. This could lead to small interest rate hikes and could even signal peak inflation.
We’re anticipating tonight’s data and if it will live up to the hype. How much has been factored in? Could it be a disappointment if it fails to meet what’s being expected?
It is simple. We see a solid beat to the downside we think risk markets will continue to rally. We see it come in as expected, or god forbid higher, and we think they will fall.
We have done a quick price action review on the USD index and US30. Major risk currencies look to be consolidating at this stage in the lead-up. The USD index is trying to hold out at 103.00.
US CPI data is due today at 12:30 am AEDT / 8:30 am ET.

GBPUSD Overview and OpportunityWe are expecting downfall from the referenced areas on the chart towards the marked green zone. Post the visitation to the green box, we are expecting a rally on GU.

Joe Gun2Head Trade - USDCHF into resistance. Highly speculative.Trade Idea: Selling USDCHF
Reasoning: Double top on the weekly chart. Into intraday resistance. Highly speculative ahead of CPI at 1:30Uk.
Entry Level: 0.93382
Take Profit Level: 0.9167
Stop Loss: 0.9398
Risk/Reward: 2.82:1
Disclaimer – Signal Centre. Please be reminded – you alone are responsible for your trading – both gains and losses. There is a very high degree of risk involved in trading. The technical analysis , like all indicators, strategies, columns, articles and other features accessible on/though this site is for informational purposes only and should not be construed as investment advice by you. Your use of the technical analysis , as would also your use of all mentioned indicators, strategies, columns, articles and all other features, is entirely at your own risk and it is your sole responsibility to evaluate the accuracy, completeness and usefulness (including suitability) of the information. You should assess the risk of any trade with your financial adviser and make your own independent decision(s) regarding any tradable products which may be the subject matter of the technical analysis or any of the said indicators, strategies, columns, articles and all other features.

NQ Power Range Report with FIB Ext - 1/12/2023 SessionCME_MINI:NQH2023
- PR High: 11480.00
- PR Low: 11465.75
- NZ Spread: 31.75
Evening Stats (As of 1:05 AM)
- Weekend Gap: +0.16% (filled)
- 8/19 Session Gap: -0.04% (open > 13237)
- Session Open ATR: 266.59
- Volume: 20K
- Open Int: 255K
- Trend Grade: Bear
- From ATH: -31.6% (Rounded)
Key Levels (Rounded - Think of these as ranges)
- Long: 12391
- Mid: 11820
- Short: 10678
Keep in mind this is not speculation or a prediction. Only a report of the Power Range with Fib extensions for target hunting. Do your DD! You determine your risk tolerance. You are fully capable of making your own decisions.

GBPUSD before the big news!Today we expect US inflation (CPI) data to be released.
This is some of the most important news right now, and it's making a big impact.
Regardless of the values, we expect big fluctuations at the time of publication!
Anyone who does not have experience and prefers more relaxed trading is recommended to just watch the movements!
We have identified the possible scenarios and the levels we expect to be reached.
One option we are looking at is GBPUSD.
A drop to 1.2080 and a pullback will allow for a rally to 1.2300.
Do not trade before the news!
Do not trade if there is no confirmation of the expected scenarios!

What If Everyone is Wrong?The chart that you are currently watching is the chart related to Ethereum in the weekly time frame, please note that it is in no way a suggestion to enter or exit the trade and it is only a point of view and does not contain any trading setup!

BTC IS AT RESISTANCE! EXPECTING A CORRECTION FROM HERE!!Hello everyone, if you like the idea, do not forget to support it with a like and follow.
Welcome to this quick BTC update. The first week of 2023 was going fantastic, we saw a good pump in the market. If you followed my previous analysis of BTC in which I clearly mentioned that BTC will go to test the $17.3k-$17.5k level and exactly the same happened.
Now, what's next?
As you see in the chart, currently, BTC is trading in the resistance zone. $17.3k-$17.6k is a crucial resistance area. I'm expecting a rejection from here and we might see a test of $16.8k-$17k from here.
Tomorrow, CPI data will release and I'm expecting a bad CPI this time. So every pump before the CPI is just a trap IMO.
Let's see how this goes.
What do you think? Share your views in the comment section.
If you like this idea then do support it with like and follow.
Thank You!

#usdt dominance has to decide how its gonna be!In the chart that we have here related to #USDTD, as you can see, the support ranges have been lost in short time frames and even the support trend line has not shown a support reaction in higher ranges!
After the reaction to the resistance range at 8.70 and 8.80, we saw a correction of several days in #USDTD, which caused the market to turn green and of course, sometimes it caused the pumping of some currencies as well!
The important thing that we must pay attention to today is the range on which #USDTD is placed, and it seems that it has prevented further correction in time, of course, this could also be because today coincides with the news and Important statistics, including the announcement of statistics (CPI), which we will continue to examine the dollar index so that we can make a better decision for the trade for the possible direction of the currencies of the second side of the dollar!
It is recommended to set an intelligent loss limit if you enter any trade in any time frame today!

FINALLY Bitcoin 36K test soon??June of last year I published a post about bitcoin and the possibility of a coming bear market rally to 36k once the 18k support level finally broke down (approximate).
Well the first week of November this occurred and although we did not get the deep capitulation we would have liked to see, we find ourselves in an interesting situation with the new data we have now to go off of.
The primary piece of information being that of getting back above 18k after a failed attempt a week or so before Christmas. I did not post anything at the time of that occurring because I was not sold on the idea that it was legitimate. But fast forward to the middle of January and on the weekly chart of Bitcoin we now have not only the break back above 18k, but also classic bullish divergence showing on the weekly RSI indicator.
And if we look at the weekly RSI we can also see that there is A LOT of room to run to the upside after consolidating for SEVEN MONTHS after first going oversold in June.
And we are now getting confirmation of this bullish divergence that we were patiently waiting on by taking out the 18k resistance level and now attempting to close back above it.
Keep an eye on the Sunday close of this weekly candle on Bitcoin. As well as the coming US CPI data that is going to be released tomorrow.
If BTC can hold above this 18k level, there could be a major move to the upside that could take us well past the main target of $36000 on Bitcoin.
Meanwhile, the short term first target for this asset (if 18k holds) would be $21500.

using CPI & CLAIMS data as TRADE CONFLUENCE!Really tricky market to make sense of right now because of how last weeks data (stronger job market - confirmed by NFP) was disregarded. This could mean:
1. Either they were beginning to lay a trap (current moves will reverse)
2. The market genuinely doesn't care because it expects claims to eventually pick up with a vengeance
Here's what I think:
CPI has been cooling due to lower Oil price and higher interest rates (housing is a big component of CPI). Lower CPI shouldn't be a shock to anyone and is likely already priced in. For this reason, I think what matters most right now is what the Fed is focused on: SERVICES (wage) inflation and this is why I believe the main focus tomorrow is likely to be the services component of CPI and the CLAIMS data.
I think tomorrow's news is already priced in and we're likely to see a reversal in XAU.

EURUSD - Session Direction Idea (PRE CPI)I think Tokyo session will range around the previous NY highs, London will push higher to stop hunt, then upcoming NY session will push to the liquidity around 1.074
Just an idea, curious as to how markets will react with CPI right around the corner.

GBPAUD point of interest HEY TRADERS
GBPAUD in this analysis i'm bullish on this pair we see price has been respecting the previous low which formed a better double bottom
TRADE CRITERIA:
WHAT ARE WE EXPECTING:
currently price is at the double bottom and now what we need to see is a reversal pattern to reverse the price up
HOW DO WE ENTER:
wait for the first shape impulse up followed by a continuation correction get in on the correction
OUR STOP LOSS LEVEL:
below shape impulse correction
POSSIBLE TARGET:
top zone
TRADE INVALIDATION:
when price impulse bearish down and form a bearish continuation pattern i.e setup invalid
THANKS FOR READING
AS ALWAYS STAY SAFE AND TRADE SAFE!!!!! CPI TOMORROW

$SPY weekly downtrend chart ahead of 1/12 CPI print$SPY weekly downtrend chart ahead of 1/12 CPI print
The only road above the $400.5 PL is to break the 50 week EMA and the only road above $402 breaks out of the year long downtrend creating a trend reversal.
I If CPI is inline with expectations, I can see us retesting the top of the downtrend and rejecting it.
However, if we're hotter that expected we'll likely take out the October CPI lows of $348.11(before the next print).

SPY NEXT BIG MOVE! CPI!The CPI data will be released tomorrow at market open. The forecast is 6.5% compared to 7.1% previously. Lets see what happens !

BITCOIN- Ahead of Inflation Data (CPI Tomorrow)Hi everyone,
watch the video and let me know your thoughts.
I cover the main Technical levels you should know as well as the key fundamental factors and scenarios.
Some good news arising today as FTX seems to have recovered 5 Billion dollars . The announcement substantially raises the total FTX has recovered since filing for bankruptcy last year but it's still short of what customers are owed in total.
Still, good news.
Not so great news from IMF : The International Monetary Fund says that 'The new year is going to be "tougher than the year we leave behind'... scary indeed as some say 2/3rds of the countries will enter into recession this year.
More bad news here and there, from Europe, Canada, Australia. Just a little example from Canada:
'The CEOs at Canada's largest banks say tens of thousands of Canadians could default on mortgages due to rising rates. This comes as the vacancy rate at Canadian office buildings are at a record high '
Lastly, we have the FED's cornered between raising or not, for how long and how much? Employment was good last week and inflation report tomorrow will play a huge role.
In general:
good inflation tomorrow (lower inflation, eased) will probably be better news for markets and BTC/Alts as well.
If inflation is high then we run for the hills as the Feds will need to consider new big rate hikes..most likely i think we will avoid this.
KEY LEVELS:
18K : A third test is expected as the last 2 times we had rejections. This time we can go higher.
One Love,
The FXPROFESSOR
PS. Remember the cycles: The next Bitcoin halving is scheduled to take place at block 840,000 which is predicted to be on Mar 13, 2024 08:47:30 PM UTC.

GOLD SHORT TERM INTRADAY IDEAIntraday Analysis (11 Jan 2023)
Will be adapting to bullish sentiment as of now until we see a shift of structure or a shift in fundamentals. CPI data will be released tmrw which will definitely shift the direction for gold. As of today , price is in a choppy zone as expected as we are at a weekly timeframe.
If CPI prints above previous it shows that inflation is still high and there will be more rate hikes to come. That will be detrimental to gold and the dollar will gain strength. Vice versa.

Inflation Report: 11 Jan 2023Finally there is a sense of relief.
The US inflation is just on a some-what downward spiral.
It's almost as if we peaked at a whopping 9.1% and now dropping to around 6%.
And let's not forget all our friends abroad, like Germany where it's dropped from 10. 4 in October down to 8.6%,
UK dropping from 11.1% slightly down to 10.7%,
Canada's 8.1 dropped to 6.8%,
France's steady 6.2%,
and China's decent1.6%.
And let's not forget our lekker country, South Africa where inflation has also dropped from 7.8% down to 7.4%.
It's just too bad all these numbers are due to supply chain issues, war, and food shortages.
But it looks like we have potentially seen the end of The Great Inflation - and now things should start to settle.
Your thoughts?
Trade well, live free
Timon
(Trader since 2003)

$EUR - Sit & Wait for CPI$EUR - Sit & Wait for CPI
As we have CPI tomorrow, we could be stuck in this range until then but overall it's a break to either direction and are the lower prints of inflation already implemented into price. Interesting times ahead!
Trade Journal
