EURUSD Post CPI Release | Price Went Parabolic!Hi guys,
Chern Yu here. Today I will be touching base on the fundamental news and effects of the CPI release.
Fundamental Context
1. CPI m/m: 0.4% vs 0.6% market consensus
2. CPI y/y: 7.7% vs 8.2% previous
3. Core CPI m/m: 0.3% vs 0.6% previous
CPI has definitely dropped and inflation is slowing down
That is a positive outlook and sign for EURUSD who has been bearish for almost the entire year. The FED pivot might be round the corner and looking for longs seems highly probable.
Market has so far been pricing in a slow down in inflation and CPI prints.
With the news release today, I anticipate price to continue pushing up and for the FED to hike by 50bps in th e upcoming Dec FOMC meeting.\
I believe that there is much upside potential for EURUSD and a slowdown in rate hikes is imminent.
CPI

Dollar index heading back to 104With multiple rejections at top and forming a falling channel, any break down will lead to 104.
Today's CPI means pivot is soon to happen.

CATCH GBPUSD 600 PIPSmoving as expected breaking descending b wedge in daily
if todays candle close above wedge then expecting 600+ bulish move in coming dasys

Cooling Inflation Sends Stocks SoaringThe S&P 500 has rocketed after October's data suggests that inflation is weakening. CPI came in at 7.7% against an expected 7.9%. The markets are looking for any excuse to anticipate a weaker Fed policy, and a tapering in rate hike trajectory. Yields have fallen dramatically and risk on assets are flying. The S&P 500 blasted off from 3749, through our relative high at 3848. We still have some room to go before 3909 but that is the next target. It might be the case that stocks equilibrate around these higher levels as the data gets priced in. If we retrace, expect support at 3825.

EUR/USD Soars After Softer-Than-Expected U.S. Inflation DataThe EUR/USD pair jumped to fresh two-month highs on Thursday after the release of lower-than-expected U.S. consumer inflation figures as it favors the case of a less aggressive Fed at the December meeting.
At the time of writing, the EUR/USD pair is trading at the 1.0130 area, 1.2% above its opening price, after bottoming at a daily low of 0.9935 earlier in the session and having struck its highest level since mid-September at 1.0159.
The U.S. Bureau of Labor Statistics reported October Consumer Price Index figures. Headline CPI inflation advanced 0.4% in October while the annualized rate came at 7.7%, much lower than the market’s expectations of 8% and decelerating from September’s 8.2% reading. Meanwhile, core inflation, which excludes food and energy prices, printed a 0.3% monthly rate while the annual rate came at 6.3%, below the 6.5% expected.
As a reaction, markets are now building a stronger case in favor of a 50 bps hike from the Fed at the December meeting. According to WIRP, market participants are currently betting on 80% odds of a half-percentage point hike, while on Wednesday, those probabilities stood at 56%.
The U.S. dollar weakened against most peers, weighed by a strong pullback in Treasury yields across the curve. The DXY index is shedding around 1.3% at the 109.00 area.
On Friday, the Federal Statistics Office of Germany will publish the October consumer inflation figures, which can have some additional impact on the shared currency.
From a technical viewpoint, the EUR/USD short-term outlook has improved as its indicators are gaining ground on the daily chart. The RSI stands above its midline and heads north, not giving signs of exhaustion yet, while the MACD printed a higher green bar, indicating that the buyers are in the driver’s seat.
On the upside, having broken above 1.0100, the EUR/USD following resistance levels could be found at the September and August monthly highs of 1.0197 and 1.0368, respectively. On the other hand, short-term supports are seen at the 100- and 20-day SMA at 1.0030 and 0.9907, respectively ahead of last week's lows at 0.9730.


USDJPY400+ pips profit so far
analysis was shared few days ago and now jpy following as we predicted

ZZZzzzZZZzzz at 3800Good morning! Here we are, Election Day has passed and we get the CPI report tomorrow. Couple things about the Mid Terms. Generally, the markets like it when Democrats have partial control and Republicans partial control. The expectations are, that the Republicans will win the House. If that happens, that could be a good thing for the markets. At the time of writing, Republicans have 199, Democrats 172 and 64 are undecided for the House. Gotta see how that plays out. Because here's the thing. Let's say the Republicans take the House and the Democrats keep the Senate, the markets might actually like that. And with Big Tech taking a beating after all these earning announcements, they're low enough to bid on and that could push the markets higher. Whoever that dude at Morgan Stanley was last week, saying that we could see 4000 or 4100 in the near term, might actually be right if it plays out this way.
But remember, longer term, we have significant headwinds and this is still a Bear Market. CPI report is accumulative, like a moving average. If you add up all the monthly CPI numbers, it gives you the annualized CPI. It's going to stay high because at the beginning of this year, we were seeing CPI numbers at about 1%. So when we add all these monthly's up, we're going to get a high number. Obviously, over time, this will come down. Which is why expectations are to get to 4% by early Q2 or abouts. So, if the Republicans' don't take the House, and the CPI report is hot. What does that mean for the markets? Well, we could head back down starting tomorrow or Friday. Either way, these are two possible outcomes that could play out.
Plan for the Day: We're technically still in No Man's Land but with a slightly more Bullish lean right now. IF I decide to chase this up to 4000, or 4100, I will do so cautiously and wait for an exhausting point in the rally. We might just hang out here at 3800 today until all the results come in and then tomorrow we could see the true direction. I'll sit on my hands again and just watch the market. Be patient, stay disciplined and trade the market in front of you. Happy Trading!

Gold: USD weakness more likely to fade soonHey traders, in today's trading session we are monitoring XAUUSD for a selling opportunity around 1735 zone, once we will receive any bearish confirmation the trade will be executed.
Trade safe, Joe.

🔴 XAUUSD : Inflation Data (CPI) effectAs you can see, the price took the second scenario and entered its 4-hour Bearish Order Block yesterday with a strong move towards the $1719 range, and this caused the price to reject from $1722 to $1702, That is, with this scenario, the price dropped by more than 200 pips, but it has not yet managed to consolidates below $1704, and according to the previous analysis, the important condition for a further drop and reaching our desired targets ($1695 and $1675) is consolidation below this price! Be careful these days the market is more tense due to the US Congress elections and you should be more careful in taking and managing your trades !
🔴 CPI (m/m) : USD
🔴 CPI (y/y) : USD
🔴 Core CPI (m/m) : USD
🟠 Unemployment Claims : USD
📌 Waiting for Inflation Data of this month!
📎 Usual Effect : ‘Actual' greater than 'Forecast' is good for currency!
📒 Why do we care ? Consumer prices account for a majority of overall inflation. Inflation is important to currency valuation because rising prices lead the central bank to raise interest rates out of respect for their inflation containment mandate !
The Main Analysis before Updates :
The Caption of it :
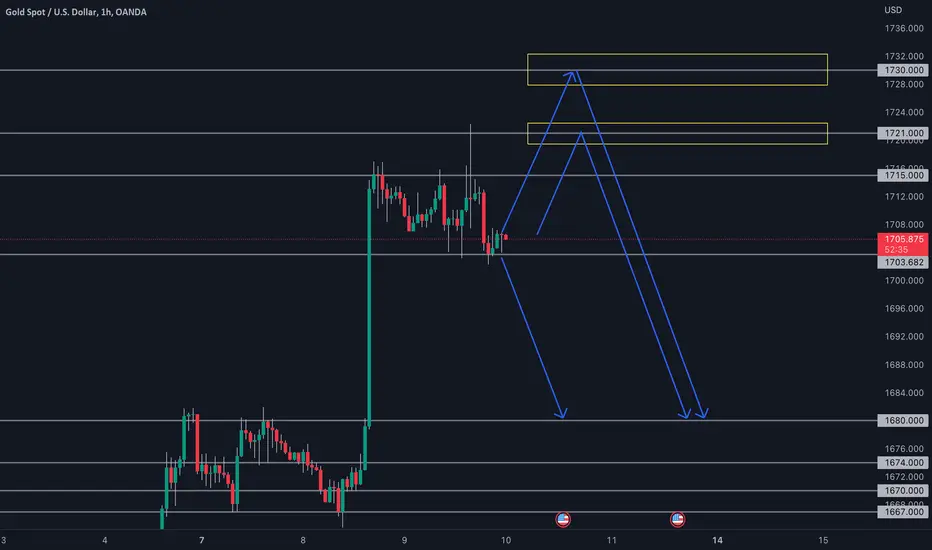
As you can see, the price with a Spike growth yesterday caused a Fair Value Gap (FVG) that caused by liquidity Void , this range is from $1675 to $1708, in such cases different scenarios can happen that the final result Each can be shared! This means that in the first scenario, if the price consolidates below $1710 and it closes below $1704 , we can expect this gap to be filled and the price will fall to $1695 as the first target and $1675 as the last target! The second scenario is growth again up to the Bearish Order Block (from $1719 to $1729) and then reject from this level! The third scenario is growth up to LMH (the highest price recorded in the previous month) to collect liquidity and then a powerful rejection from this level! Decision making based on each of these scenarios is based on the trigger at the moment!
Follow me for more analysis & Feel free to ask any questions you have, I'm here to help.
⚠️ This Analysis will be updated ...
👤 Arman Shaban : @ArmanShabanTrading
📅 11.10.2022
⚠️(DYOR)
❤️ If you apperciate my work , Please like and comment , It Keeps me motivated to do better ❤️

Looking at price action on AUDUSD following CPI reportsInflation is one of the key factors in FED's decisions. It is expected to move the market every time it gets released, especially now that FED is watching.
Previous CPI was on 13/10 - 0.6% against 0.4% forecasted.
There wasn't any directional move on that day, just liquidity sweep on both sides.
Before that, another report came out on 13/09 - 0.6% against 0.3% forecasted.
Price broke out previous session's high before the event and dropped massively with its announcement. So far, this is a never-look-back level.
On 10/08, there was second of only two reports this year that turned out with negative surprise - 0.3% against 0.5% forecasted.
There isn't any immediate low or high breach worth mentioning, the price just rocketed through everything in close vicinity. However, as I marked with Yellow line, there was a significant swing high in 60 days period that was breached only for price to return below it and never look back after. I am adding daily chart below with all of the reports.
From the daily chart, we may conclude that CPI report has a tendency to create Monthly or even multi-month Lows and Highs. Just in the latest 60 day window, the highest price was September's CPI, the lowest price in that window is October's CPI. With the exception of June, the reports always created a significant High or Low or were or were only one day away from it.
Most CPI candles also exert visibly above-average movement and like to take on liquidity in close proximity to the price.
A negative surprise (inflation lower than expected) would likely lead above 0.655, perhaps up to 0.66, but is unlikely to change the trend. This would, therefore, be another highest high for months to come.
A positive surprise could quicklu steer the price below 0.625. I don't think it will go back up on positive surprise, it looks like that would high resistance run, because the price has provably tried to go there and failed on Wednesday's London session. It dropped instead and following New York session made another attempt, yet did not even beat London session there.
Legend:
Lines:
Violet - Monthly Highs and Lows
Dark blue - Weekly Highs and Lows
Cyan semi-transparent - Daily Highs and Lows
Cyan dashed semi-transparent - New York Midnight
Yellow semi-transparent thick - estimated liquidity area
Other:
Purple channel - Single Print, price went either down or up without any overlaps on higher timeframe charts
Yellow, blue, ted rectangles - key forex sessions, first three hours

xauusd making a wave downthe price is forming down on second and first head shoulder but let's expect a sell down to 1697 limit before short buy

Gold is in a critical area!Because of the election gold decided to fly to the next major supply zone 1700_1730.
We may see downward moves toward the next demand area to fill the gap lifted behind.
RSI is above the 70. and also the price tapped in the OB (1720). We may see a retest and then the big move.
Follow me for more ideas 💡

GBPCHF;PM SUNAK TO ATTEND SUMMITThe British-Irish Council summit will be attended for the first time in 15 years by UK Prime Minister Sunak. On Thursday, the Tory leader will also meet with his counterparts from Scotland and Wales to repair relations.
According to Bloomberg, the UK government is also in favor of reducing the surcharge on bank profits to 3% in order to maintain the sector's competitiveness.
A survey released on Thursday, British home prices dropped in October for the first time in 28 months, and the rising cost of mortgages threatened to further stress the real estate market.
The October reading was the first negative reading after 28 positive monthly readings, showing that national house price growth was "grinding to a halt," according to RICS.
While economists anticipate that the recent calm in the financial markets may offer some relief, it may be premature to predict that lending rates will decline.

CPI DATA SCENERIO 2 (RISE IN CPI DATA)Scenario 2:
- Lower inflation printing than 0.4%
- Dollar weakness
- Bullish gold, equities and even crypto
- FED weakening stance
- Hints of slowing rates for DEC and months to come
If inflation prints lower than that of the prev month of 0.4%, we will be looking at bullish continuations in gold as the institutions have already priced in their buys from the lows. As they have received news before hand that the prints will be lower at 9:30pm with FED pivots in play slowing rate hikes to 50 BPS in months to come. Breaking above the all time resistance of 1730 KL could signify a change of market structure of gold if accompanied with low inflation prints.

Taf's Gun to the HeadTrade Idea: Sell Gold at Market
Reasoning : Looking at bullish momentum to continue on DXY on the backdrop of strong support at ichimoku SSB zone.The hourly shows a potential bullish head and shoulders pattern as well. So on that looking to sell Gold at resistance zone 1711-1714. CPI figures could give volatitly so be careful on stop loss.
Entry:1707.85
TP:1678.83
SL:1719.55
RR: 2.48
Disclaimer – Signal Centre. Please be reminded – you alone are responsible for your trading – both gains and losses. There is a very high degree of risk involved in trading. The technical analysis , like all indicators, strategies, columns, articles and other features accessible on/though this site is for informational purposes only and should not be construed as investment advice by you. Your use of the technical analysis , as would also your use of all mentioned indicators, strategies, columns, articles and all other features, is entirely at your own risk and it is your sole responsibility to evaluate the accuracy, completeness and usefulness (including suitability) of the information. You should assess the risk of any trade with your financial adviser and make your own independent decision(s) regarding any tradable products which may be the subject matter of the technical analysis or any of the said indicators, strategies, columns, articles and all other features.

Long sdowI don’t see how the market continues on an uptrend after cpi, and the Dow is seriously overextended
Reasoning:
Trendline, daily, weekly and monthly supports
Weekly price exhaustion
Bottom of broadening pattern
Favourable volume

Important news for EURUSD! The news coming up for EURUSD will determine the next move.
Yesterday, we looked at the daily timeframe and the levels where price was trading then.
Today, we expect that the market will confirm its move to the downside!
Ideally, we want to see price pushing higher towards 1,0100 and then giving us an entry there by closing lower.
We don't recommend trading before the news!

XAUUSD Update before CPI (High volatility)Current price respected 1720-1721 and 1715. I would like the scenario that GOLD retests the 1720 zone before starting to melt.
XAUUSD longThis fancy pair has reached an overbought level - short term speaking.
Two immense bullish candles and the retracement has already started. For the second big move, price may retrace to 0.5 level for a nice 50 pips target - buying opportunity.
50 pips is enough!
However, in terms of the whole move that started approx. @1617, the price may retrace to black Fibo drawing which is in confluence with major former resistance level - if this happens
it will be a great retest opportunity if we see long wicks to the bottom and not big red candles!!!
Also, the 1675 area is a high volume one with possible OBs lying there for strong bullish reaction.
Targets for the big buys -> 1713 area.
Reminder: Gold has broken bearish daily trend line and has overcome many resistance levels by hunting retailers of course.
Even a 1657 area touch - trendline retest for continuation back up is possible.
Waiting to see your ideas in comments.
Goodluck!

What is happening to Bitcoin and Crypto?!! Wow.... I think that yesterday is a day that no one was expecting and was ready for! As we are seeing Bitcoin making newer lows due to the bad environment we cannot tell what is about to happen next. But we have some data to look at.
We are seeing that BTC wallets with 10k BTC are making a new ATH and they are not getting liquidated. Most of the people are interested in opening a low the moment BTC hits a newer low resulting in a strong bounce back up. The DXY is on the edge of falling down just like the Yields. Tomorrow the CPI numbers will get released so expect even more volatility in de markets.
Trade safe and don't let emotions take over your trading decisions.

USDCAD:BULLS TAKE CONTROL AMIDST CPITreasury yields recover from the previous day's losses as worries about China's economic slowdown and US government gridlock combine.
The government is continuing its zero-tolerance policy, and the severity of the cases isn't showing a similar correlation, so the chances of China reopening have shifted to the downside.
With the most recent addition of 8,335 for November 2008, China reports the highest levels of new COVID cases in six months, while also marking a new virus-led lockdown in Guangzhou's second district.
According to Goldman Sachs analysts, there is a 35% chance that the US economy will experience a recession in the coming year. The extreme difference between the desired inflation target and the current inflation rate, the aggressive tightening of Fed policy, and the extraordinarily uncertain conditions in US domestic politics and geopolitics are the causes of the rising recession fears.
The US dollar index (DXY) has since printed a new seven-week low at 109.35, showing a less assured pullback

Be careful when buying EURUSD Today, we are looking at the Daily timeframe on EURUSD.
It's very important to know what is the main move, especially when trading the lower timeframes.
The trend on the Daily chart is pointing to the downside and it's more likely to continue in the same direction!
Tomorrow is quite important and we may have some decent setups to work with.
This upside momentum that we had in the last 3 days, can easily continue but it's also very important to notice when there is a reversal!
That's why you should be careful when buying.
The coming days are key for price action!
