CPOOL Is Coiling Up for a Massive Breakout Ahead!Yello, Paradisers! Have you been paying attention to the quiet storm building in #CPOOL? Because if not, you might be missing one of the cleanest breakout setups we've seen in months, and it could leave the majority behind in confusion and regret.
💎After a major corrective leg to the downside, CPOOL has now been consolidating for over 113 days. This is not just sideways noise, this is clear evidence of absorption, where selling pressure is being slowly taken in by stronger hands. And when that happens, a trend reversal often follows.
💎CPOOL remains trapped inside its consolidation range for now, but signs of strength are emerging. Price is creeping up toward two key technical levels, the EMA-50, which hasn't been breached since January, and the descending resistance line that’s held firm since December 2024. Now, these two are converging, creating a tension point that could trigger a significant breakout if volume supports the move.
💎#CPOOLUSDT's first resistance levels stand at $0.125 and $0.135. A decisive breakout above this zone, backed by increased buying volume, could send price surging toward the $0.1800 to $0.1880 area. This range will likely see partial profit-taking, but more importantly, it marks a critical pivot, if CPOOL can close above it with strength, we officially shift from a neutral to a bullish ultra-high time frame (UHTF) stance.
💎Should this bullish momentum continue, and price cleanly breaks above $0.1880, CPOOL could see a strong rally toward the $0.2550 to $0.2700 range. This is where strong resistance resides, and it may be a very barrier.
💎On the downside, support is currently well-established between $0.090 and $0.085. This zone has proven its strength and should act as a reliable base against any short-term pullbacks or retests.
Paradisers, strive for consistency, not quick profits. Treat the market as a businessman, not as a gambler.
MyCryptoParadise
iFeel the success🌴
Cpoolanalysis

CPOOL Is Winding Up for a Major Breakout! Key Levels to WatchYello, Paradisers! have you noticed how CPOOL has been quietly coiling for over three months without much noise?
💎After a prolonged downside, CPOOL is now completing a textbook 100-day accumulation band, which is historically the perfect springboard for a major trend reversal. Let’s break down why the next move could be explosive:
💎CPOOL is now facing a multi-month descending resistance at $0.165. This level is critical. A breakout here would likely trigger a strong push toward the top of the accumulation range, between $0.183 and $0.205. That’s the real test for the bulls, if they clear it, the upside opens up fast.
💎Above this zone, the next big target is $0.28 to $0.30, which lines up with the 50% Fibonacci retracement and is a strong resistance level. This is where caution is advised.
💎What makes this setup even more interesting is how fast CPOOL’s dynamic levels are tightening. That’s a classic sign of a volatility squeeze, the kind that usually leads to explosive moves. On the downside, $0.12 offers initial moderate support, but the real foundation sits between $0.100 and $0.095, where price has bounced hard three times since March.
Paradisers, strive for consistency, not quick profits. Treat the market as a businessman, not as a gambler.
MyCryptoParadise
iFeel the success🌴

CPOOL Bullish Reversal in Play? Key Levels To Watch!Yello, Paradisers! Could #CPOOL be setting up for a powerful breakout after months of pain? The price action is finally signaling that a major trend reversal might be brewing.
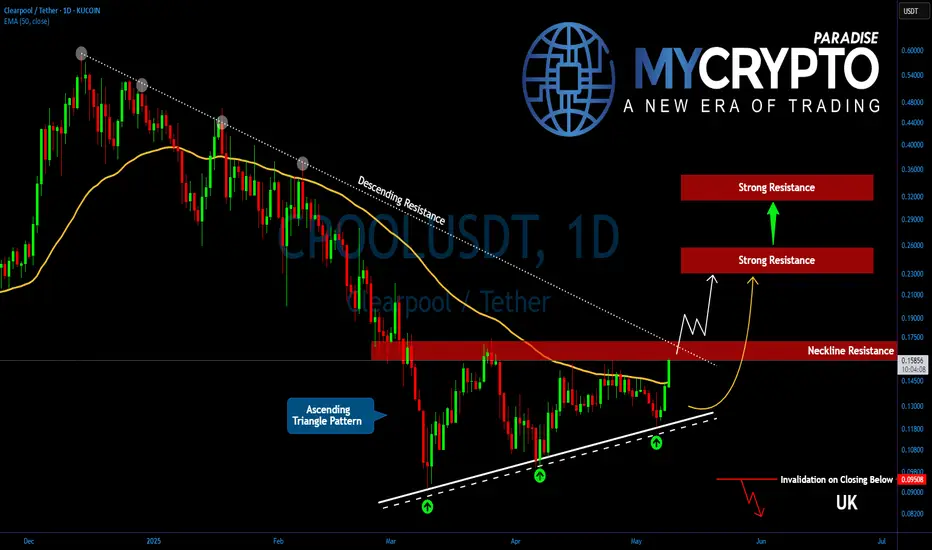
💎After an extended downtrend, CPOOL is now forming a bullish ascending triangle pattern—a classic structure that often leads to strong upside reversals. For the first time since January 19th, 2025, bulls have successfully pushed price above the EMA-50, indicating a shift in momentum.
💎#CPOOLUSDT is testing its neckline resistance between $0.1570 and $0.1720. This is the key breakout threshold—once breached with conviction, it’s expected to trigger a significant reversal wave and usher in a new bullish phase.
💎A confirmed breakout above $0.1720 would open the path toward the next major resistance between $0.230 and $0.250. This is the first profit-taking zone where short-term traders might look to offload positions. However, the structure suggests that this could just be the beginning.
💎If momentum continues, the full triangle breakout target lies higher—at $0.320 to $0.350. This area aligns with the 50% Fibonacci retracement level, making it a critical test zone for bulls. Traders should prepare for increased volatility and potential reversals in this zone, as it's likely to attract both sellers and momentum-driven buyers.
💎On the downside, primary support now rests at $0.1440, which is the current EMA-50 level. Below that, the ascending trendline support between $0.1275 and $0.1190 offers a firmer structural base and should be watched closely in the event of pullbacks.
Paradisers, strive for consistency, not quick profits. Treat the market as a businessman, not as a gambler.
MyCryptoParadise
iFeel the success🌴
Is CPOOL on the Verge of a Bullish Breakout?Yello, Paradisers! Could #CPOOL be preparing for a significant bullish reversal right now? What we’re seeing on the chart suggests that bulls may be quietly building momentum—but there’s one key breakout level they need to conquer first. Let’s break it down:
💎#CPOOL is currently trading within a descending channel, but things are starting to get interesting. The price just re-tested a major breakout level, and we’re seeing a strong reaction from that zone. This type of reaction is a classic bullish clue—suggesting buyers may be looking to take back control and push CPOOL higher from here.
💎CPOOL has a strong support presence at the levels of $0.250 and $0.265, this range has already proven its strength. Notice how CPOOL’s recent dip into this area triggered a sharp bounce that erased nearly three days of losses. This reaction from support is a strong indication that buyers are still defending this zone aggressively.
💎Over the next few hours, we could see CPOOL enter a short-term consolidation phase or dip slightly for a minor retest of the $0.30 support level. A clean hold above this zone would be a solid base for bulls to build on.
💎On the other hand, for bulls to really take charge, they must break above the $0.370 resistance level. If they manage to do that, the path opens up to a much more critical level at $0.425—the descending channel resistance. This level is pivotal as break out above this can create a powerful bullish rally pushing straight towards the $0.475 to $0.495 region, where a key 0.618 Fibonacci retracement level is waiting.
💎However, we need to be cautious around this Fibonacci zone. Historically, the 0.618 level often triggers profit-taking and temporary pullbacks. It’s a level where both bulls and bears tend to battle it out—so watch for potential hesitation or rejection in that area.
Patience and discipline are key here, Paradisers. The market often tests both bulls and bears before making decisive moves, so stay vigilant.
MyCryptoParadise
iFeel the success🌴

CPOOL daily now has Classic Bullish Divergence RSI now has a higher low and price has a higher
low which is making CPOOL Daily have
Bullish Divergence, so lets see if the Bullish
Probability stands firm in this bearish crypto
current climate.

CPOOL daily chart retesting the DeMark 9 support.CPOOL daily chart has retested and held support
at the DeMark9 indicator support which is not
a bad sign. the one marl of concern is that the
RSI broke down below the ascending trendline.
So CPOOL needs to have some exponential high
volume to pour in and allow these candles to
greenlight this chart. If it was to turn bullish
out of this formation, look for it to head to the
7.86 Fibonacci red box.

CPOOL Daily Chart is charting Classic Bullish Diveregence Thurs 6-23-22 CPOOL daily chart UPDATE
The Yellow Trendlines i have not moved and the
chart has played out well with the supports.
What i see right away is that its holding support
right at the day launch price. This is not a bad sign
at all. The price movement and RSI are flowing well
for an early project. This Chart is showing
CLASSIC BULLISH DIVERGENCE!
look at the white dotted lines
that are ascending and descending, those dotted lines
will be the support and resistances now...
it should follow within that pattern as well as the
RSI is showing some decent strength. DMark9
Indicator is showing it may of hit bottom.

CPOOL daily chart, MY THOUGHTS?CPOOL daily chart...was asked by a member to post my thoughts here..
theres not alot of data here, but with RSI's at the bottom and slightly
began to trend up, we may see some positive upward movement...
The DeMark9 shows we may of hit bottom on the candle pattern as well a week
ago. To show Bullish Strength, i would like to see this chart break and hold
$.19 and then move up into $.39-$.50 range. anything is possible with a
brand new asset. so if you believe in a project, accumulate and hold and be patient..
its risky but life is risky....I hope this helps traders and investors.

This is price action of cpoolDaily trendline is broken . There are two paths which depends of the 2 horizontal lines above and below the price. Whichever direction it brokes by daily candles I see the move.
My prediction : bullish 📈📈📈
