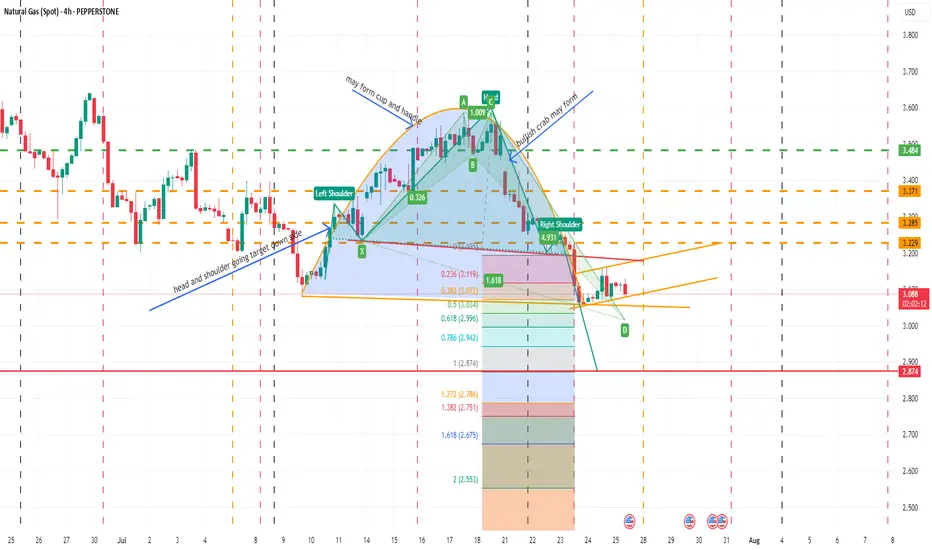
NATURAL GAS SPOTMay form inverse cup and handle, bullish crab also about to form , after completing one head and shoulder pattern already posted earlier new head and shoulder going on. In daily and 4 hr chart below ichimoku cloud. In weekly within cloud. Moving averages showing weakness in daily and weekly, monthly candle also no bearish. May be in such scenario bullish crab pattern may fail but need to be careful as over sold territory. Let see how all works in future though so far all as per analysis. I am not SEBI registered analyst.
Crab
$CLOV Bearish Crab ConfirmedStill new to harmonics. Seeing this late but this looks like bearish crab that formed on the 30M. If it is or was it confirmed.

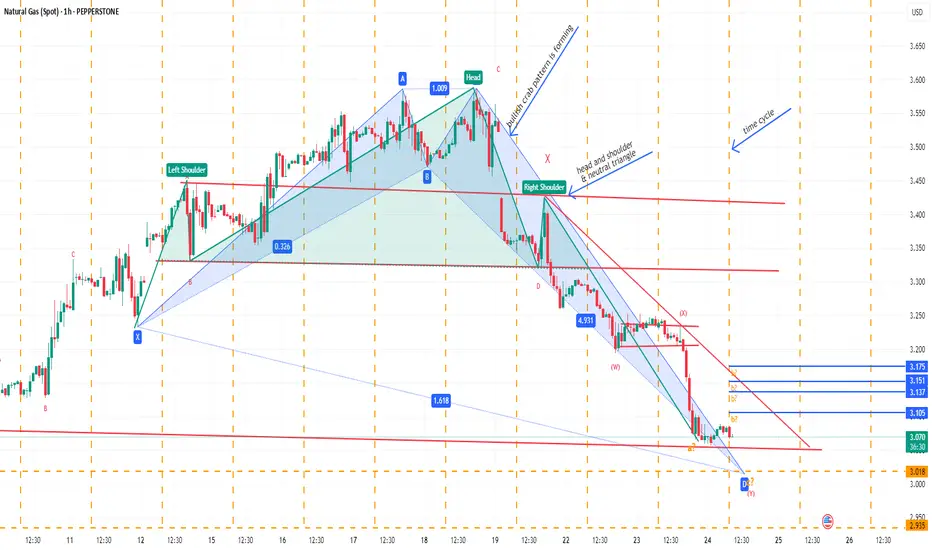
NATURAL GAS SPOTBullish crab pattern may form, if another harmonic pattern may develop later.
Neo wave wise may be in wave Z need confirmation.
Time cycle high low break may be trend continue in break out/down direction.
Not sebi research analyst.
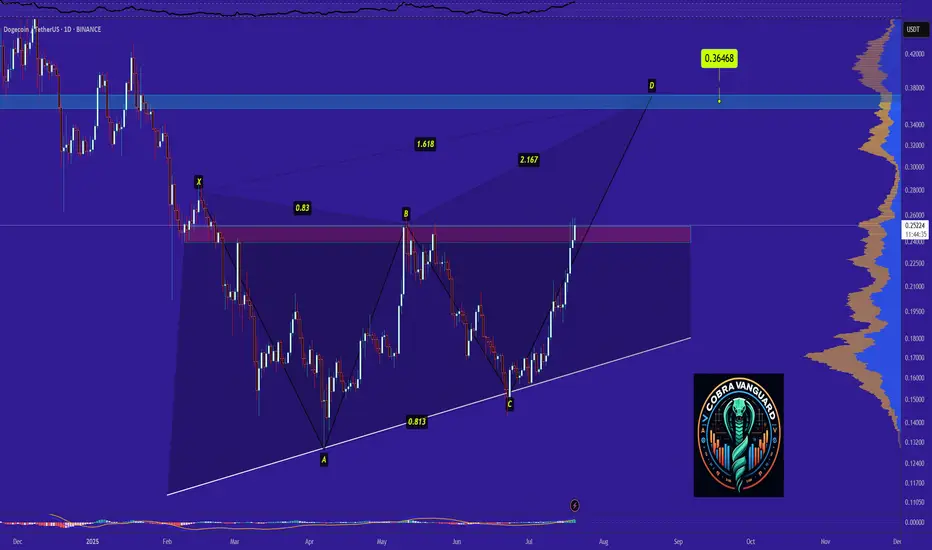
Dogecoin - Time to buy again!So if you pay attention to the DOGE chart you can see that the price has formed a Ascending Triangle which means it is expected to price move as equal as the measured price movement.( AB=CD )
NOTE: wait for break of the triangle .
Best regards CobraVanguard.💚
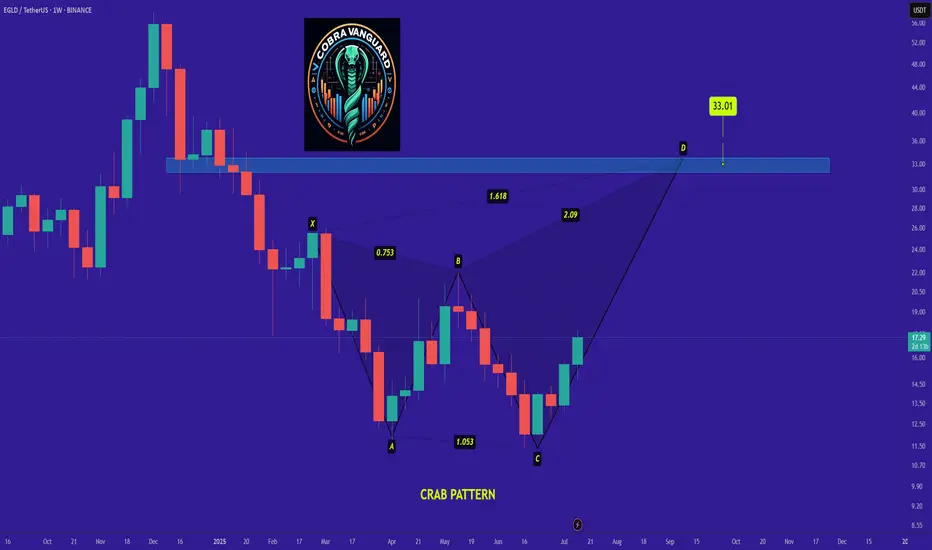
EGLD is bullish now & many Traders don't see it !!!Be careful with EGLD !!!
we can hope that the price will act like a Crab pattern and the price will grow well.
I expect that the price will grow very quickly...
Stay Awesome , CobraVanguard.
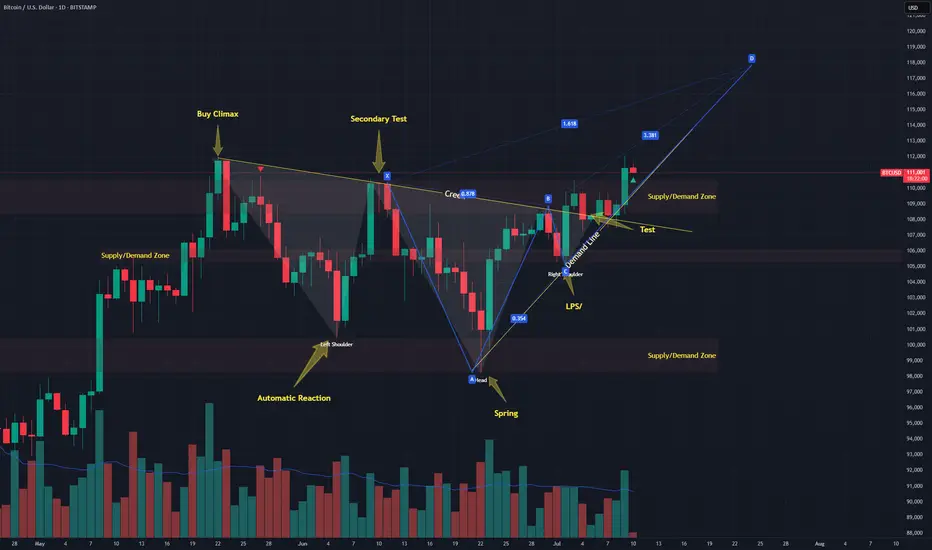
Bitcoin forming a possible deep crabLast week I published a thesis that #Bitcoin might be in a #Wyckoff re-accumulation pattern and we had an ugly ass inverse head and shoulders forming as a part of it.
Well know that test on the creek formed a BC leg of a possible Deep crab. 1.618 is ~117k. Lots of confluence
MICROSOFT - Simple Analysis WIN ! Its Bearish Ahead ! MAGIC Microsoft - Lets explore the magic of Technical Analysis / Price action.
Microsoft is currently testing the daily resistance level and it will be more matured once the bearish candle / rejection candle is formed. We see a bearish divergence at this level which is a strong confluence for the bearish trend a head.
forgot to mention, a perfect bookish - Bearish Crab pattern is forming, which is a forming a Potential Reversal Zone (PRZ).
we expect our entry after confirmation on the break of HL - 447 level and then we can plan our TPs accordingly.
Please like and comment!

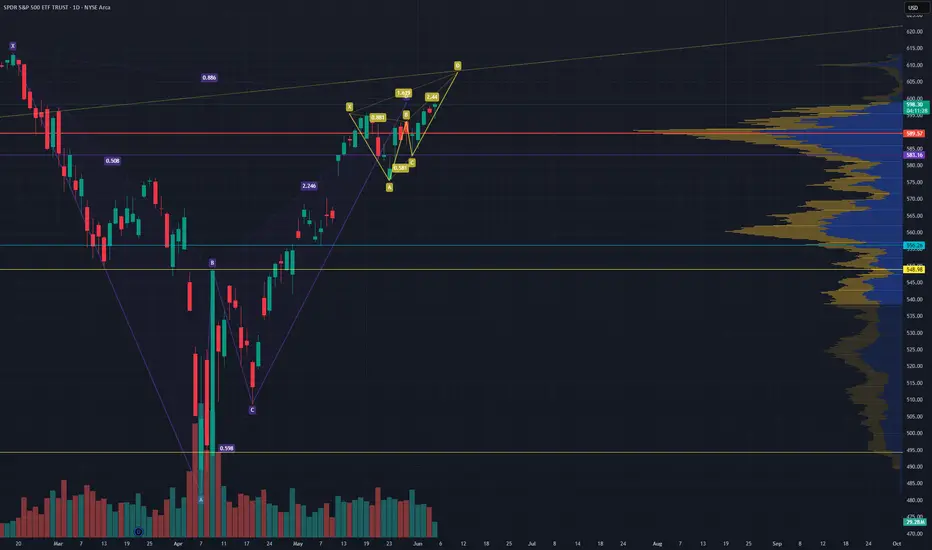
Big BAT Little Deep Crab on SPY WTF is going on with the marketI don't know what to make of this market but the BAT completed and what looked like a cup and handle is starting to look like a BAT and a deep crab. The deep Crab finishes right around a trendline I have that goes way back.
Publishing for tracking purposes
#SPY
Nvidia 1D chart Harmonic Bearish Reversal Pattern CrabStop Loss: 136.50 Potential
Sell Stop: 124
TP1: 110.92
TP2: 98.28
Divergence Noted between Higher Highs earlier to D Point
Risk-Reward = Reward / Risk = 1% to 1%

Bitcoin reversal confirmed ?!Bitcoin reversal confirmed ?! 👀
I would like to present you some charts with important levels and relevant patterns.
🖥daily-chart (BITSTAMP) and 💡everything important in the chart 👀
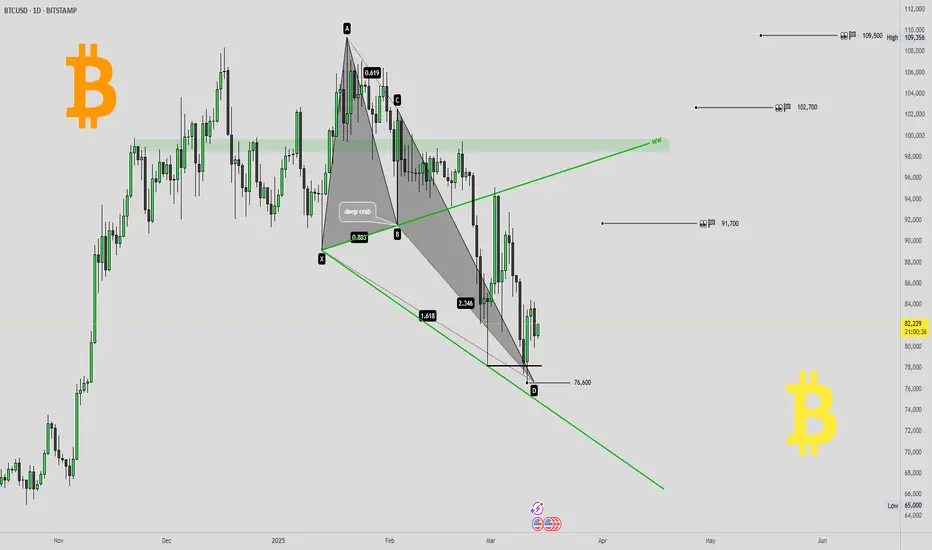
💥Here in the daily chart (BITSTAMP)
- a Deep-Crab harmonic with
- a WolveWave
and the daily-chart of the
🔥Daily MA200 re-test 👀
- gap fill
- support-line 2022 and 2024 TOPs
👉 BITCOIN roadmap/outlook (from 27th february 2024) 💡
🎯 If you like this idea, please leave me a 🚀 and follow for updates 🔥⏰
Furthermore, any criticism is welcome as well as any suggestions etc. - You're also very welcome to share this idea.
Have a nice evening & successful trading decisions 💪
M_a_d_d_e_n ✌
NOTE: The above information represents my idea and is not an investment/trading recommendation! Without any guarantee & exclusion of liability!
recap - " Bitcoin reversal confirmed ?! "BITCOIN reversal confirmed?! 👀
BITSTAMP:BTCUSD
How did this idea develop? 🤔
🥇Recap of the idea(s) from March 14, 2025 (see right 👀 under “Related Publications”)🎯
Hello ❤TradingView Community 👋
After the sell-off/correction ended on April 7, 2025' - Bitcoin reached an absolute low of $74434. This was followed by a nice rally and the complete fulfillment of the price targets from the idea of March 14, 2025 (push the play-button 😍).
Everything important is in the chart!
💡 This idea is closed at this point ✔
👉 All targets have been achieved 🎯💪
💥Follow me to stay up to date and be the first to receive these important updates/news & not miss anything! ⏰🔔
Furthermore, any criticism and suggestions etc. are welcome. - Feel free to share this idea.
Have a nice day & happy trading folks 🔥💪
M_a_d_d_e_n ✌
NOTE: The above information represents my idea and is not an investment/trading recommendation! No guarantee & exclusion of liability!
👉 BITCOIN roadmap/outlook (from 27th february 2024) 💡

Analysis of CAC 40 IndexIn our recent analysis, we predicted a price decline based on harmonic patterns, with an anticipated bottom of €7,200.
However, recent fluctuations indicate that French shareholders have yet to liquidate their holdings. This suggests a potential shift in market sentiment that could impact future trends.
We foresee that these declines may continue until reach the golden level of the Golden Crab pattern. As savvy investors, staying informed and adapting to market movements is crucial.
SEYED.

Buyers Trapped Between Two Golden Levels !!Palladium prices may rise from $977, located at the golden level of the Crab pattern,
towards the target zones within the order block in the Golden Fibo Level.

Gold-to-Silver ratio doing the Crab WalkEyes on that golden Crab level for a possible bounce back to 110 ( Target of Previous Idea) .
Precious metals drama never disappoints! 💰✨

Brent Crude OilBrent crude oil prices might see a rise from the golden crab level 🦀📈
Could this be the start of an upward trend?

Bullish Crab Pattern at Golden Ratio LevelNatural gas prices may see a potential increase based on the Crab Pattern forming at the golden ratio level.
This technical setup suggests a bullish reversal, aligning with key support.

BTC Bullish Deep CrabAn idea to display an potential Deep Crab idea. This might hit the support line at 98k that was the last resistance from the last rally. Whether this holds is another story. Thank you

FTSE 100: Bearish Order flowBearish Crab Pattern via the 1H timeframe. Let's see how this plays out.
There's also an order block at the bottom on the H4 timeframe. Maybe price could go bearish to mitigate it. As they say, false move beginning of the week.

Crab vs Order BlocksThe Dow Jones Crab 🦀 finds itself caught in the web of order blocks, navigating a treacherous sea of buyers and sellers.
The golden level of the crab has crept dangerously close to the sellers' order block territory, and all eyes are on the impending tumble.
It seems the crab might just scuttle its way down to the buyers' order block nestled at the very bottom, right by its own clawed feet.
Hold tight, folks—this crustacean's market dance is about to get interesting!

GBPUSD: Bearish OverflowWe got this potential Deep Crab Pattern that aligns with FVG on the Daily timeframe. It's possible we'll continue to break structure to the low if the Dollar continues to rises.

NASDAQ Harmonic pattern indicating strong bounce incoming.AI vs. Dot-Com Bubble
When drawing parallels between #AI and the dot-com bubble of the late 1990s, many express concerns that current valuations may be excessively inflated. However, significant differences are apparent.
To begin with, the current price-to-earnings (PE) ratio of the NASDAQ-100 is approximately 30, whereas during the dot-com bubble, it skyrocketed to 200, with many companies lacking any earnings in sight.
Additionally, the market capitalisation to #GDP ratio reached unprecedented levels in the late 1990s, while today's figures, although still high, are supported by robust earnings and solid cash flows from established business models.
Innovations in AI, cloud computing, and digital transformation have fuelled revenue growth, exemplified by #NVIDIA's data centre sales, which surged 409% year-over-year in Q4 2024, and Microsoft's Azure, which experienced a 28% year-over-year increase in 2024. This surge in productivity is being driven by individuals, businesses, and governments alike.
As a result, major tech firms are making substantial investments in AI research and development, with clear strategies for monetisation.
AI is poised to become a transformative force, akin to the transistor, a groundbreaking invention that scales effectively and permeates various sectors of the economy.
Lastly, the Federal Reserve raised interest #rates to 6.5% to tackle inflation after previously lowering them to address Y2K concerns before the bubble burst in 2000.
In contrast, current expectations suggest that interest rates will stabilise or decrease, which would support valuations.

Bearish Crab Pattern Will Start from 100.7The dollar index has retreated from 100.7, a movement potentially correlated with a bearish crab pattern observed in market analysis.
Further observation is warranted to confirm the validity and predictive power of this pattern in forecasting future dollar index fluctuations.

Understanding the Crab's Potential Ascent Before the DescentCurrent market analysis suggests a potential temporary surge in the Nasdaq index, colloquially referred to as a "crab walk," possibly reaching a level of 20.4 before a significant correction.
While this upward movement may present short-term opportunities, it is crucial to recognize its potential transience.
