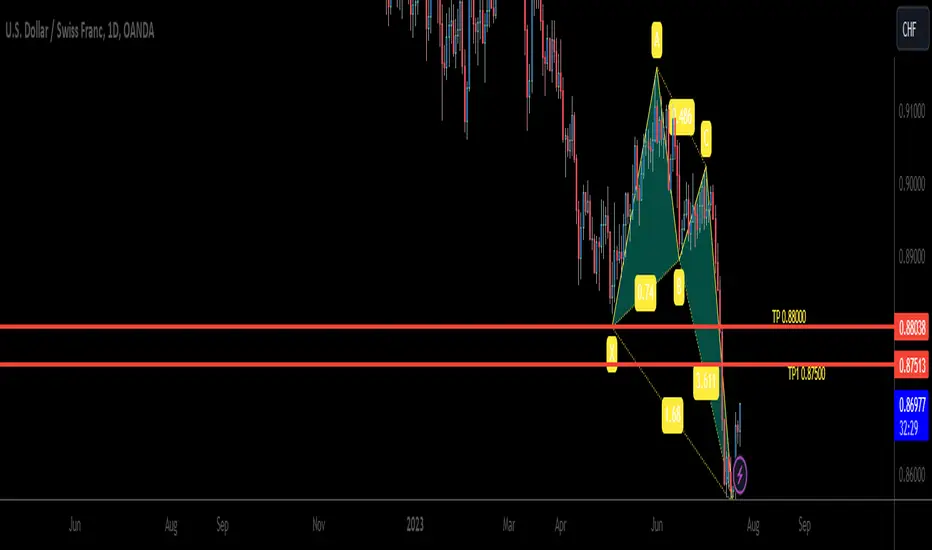
BUY USDCHFAfter an extremely poor performance of the USD on this pair, we saw an even deeper fall after yesterday's US inflation report,.. However, price has reached the potential reverse zone of a bullish Harmonic Crab pattern,.. we have longed the market in this regard,. remember to manage you risk.
Crab

IPCA LABSHello & Welcome to this analysis
The outlook has been down from quarterly, monthly, weekly & daily chart study.
Its been in a 2 years downtrend, now near a support but yet to give any reversal confirmation. If this level of 700 fails to hold the next major support comes in at 600.
Overall its a wait and watch stock even from a bounce back point of view

BULLISH CRABLooking forward to some nice bullish movement here for about 60-80 pips. Price formed support just after the 161.8 to form a nice crab pattern.
Unleash the Bullish Potential on GBPUSD!📍 Don't miss out on the ongoing bullish trend – a perfect opportunity for trend traders! Wait for confirmation before entering the market. 💪
⏱️ Spend just 15 mins a day for lucrative trades! Join our community to learn effective strategies. 📚👥
📉 For counter-trend traders, keep an eye on the harmonic bat pattern at 1.2951 for a potential shorting opportunity. You need to be familiar with the rules before engaging the trade 📊
Trend Traders we have the Bullish Gartley Pattern at 1.2652 and Bullish Deep Crab Pattern at 1.2477, wait for buying opportunity only after confirmation.
🎯 Pro traders might be waiting for a buying opportunity within the buy zone between 1.2854 to 1.2593. Aim for the first target at 1.3092 for long-term gains. 🎯
💡 Master the art of reading trends and trade with confidence. Set alerts and enjoy your free time! 💰💫
👉 Follow my only account @raynlim for daily insights and trade ideas. 📈💡

NIFTY - "Aliens" in Wonderland It was about UFO's, confirmation of their existence was revealed. Existence of non-human bodies of pilots. The tweets on Aliens also one of the trending in India. While bulls and bears were fighting, the move unfolded as alien to both of them. Bears practically vanished and booked long holiday, while bulls ruled as if no one to worry. With Global cues green, the last hike feeling, pushing to start the day with high octane comes the thunder of sell off. Add to that the FII numbers huge negative. Typically Aug/Sep/October are volatile months, will that be the case this year too. Looks one will get more than bargained for. Dow for its start printed 200 plus move ended in near 200 minus. With stronger economic number came the NIKKI reports of BOJ widening the band. All let loose, Dollar Rallies, err. JPY rallies across the board. This morning Australian inflation data colled, while Japan inflation data roared. The global liquidity support is predominantly Asian led by Japan. This is the cause for concern to the bulls or kings of carry. With the ATH followed by three crows, the green day remained short lived. Yesterday candle is three day engulfing bearish line or even four day as it covers the body. Weekly does not move much. However, the bi-monthly candle would print warning signal of grave stone doji. Too early a call though. For the day 19730 caps (this was the best case scenario) while 19580 is under attack. Initial signs of perfect bullish crab, half the pattern is complete, but this is not the way harmonics is seen but that can be the input to watch. PIP Graph. Trade from short below 19700-730 for move towards 19500.

SELL EURCADThis previous week has been super bullish for this pair but considering the structure level price action is at we notice a major resitance and supply area confluencing with a 61.8% retracement of the main previous high and a bearish harmonic crab pattern with a potential reverse zone at its 161.8% fib level. We use the PRZ as the entry to short this pair. We anticipate bearish momentum.

MSFT: Bearish Crab with Double MACD Bearish DivergenceMicrosoft has traded up to a 1.618 Fibonacci Extension and has formed a Bearish Crab with Double MACD Bearish Divergence, so long as $350 holds as resistance, I think it could go as low as about $295 to fill the gap below.
In the meantime, I have sold $350 multi-week calls.

AXP: Confirming Break Below Lead-In Trend at Bearish Crab PCZAmerican Express has broken below the Lead-In trend line and looks to be confirming a lower high below the breakdown zone, all at the PCZ of a Bearish Crab on the Weekly Timeframe.
If we get the desired performance from this we should see AXP go down about 30-60% from the current levels.

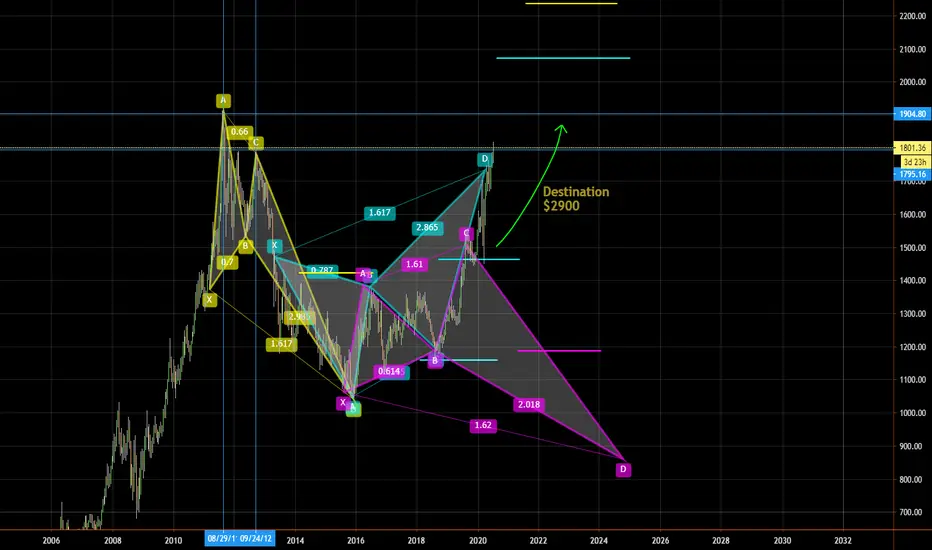
GOLD MARKET GO BULL-rrrI had short term reservations on GOLD, but zooming out and looking at MAX Potential Gold appears to be on an upper trajectory of
2900/ oz. for paper gold. This is an upper area - ther are other significant targets marked on the chart as well. Physical Gold could end up being much more.
Yes there will be some corrections as the DJI, NDX, and SPX move, but overall with the approaching Bear Market GOLD is primed and has not even begun to show off yet.
CHEERS!
Scott Carney's "Deep Crab" & the Fields Medal in MathematicsQ: What does the former have to do with the later?
A: The intuition in the former (S. Carney) is born out by the later (A. Avila; Fields Medal - 2014)
From Scott Carney's website;
---------------------------------------------------------------------------------------------------------
"Harmonic Trading: Volume One Page 136
The Deep Crab Pattern™, is a Harmonic pattern™ discovered by Scott Carney in 2001.
The critical aspect of this pattern is the tight Potential Reversal Zone created by the 1.618 of the XA leg and an extreme (2.24, 2.618, 3.14, 3.618) projection of the BC leg but employs an 0.886 retracement at the B point unlike the regular version that utilizes a 0.382-0.618 at the mid-point. The pattern requires a very small stop loss and usually volatile price action in the Potential Reversal Zone."
---------------------------------------------------------------------------------------------------------
From Artur Avila's Fields Medal Citation;
---------------------------------------------------------------------------------------------------------
"Artur Avila is awarded a Fields Medal for his profound contributions to dynamical systems theory, which have changed the face of the field, using the powerful idea of renormalization as a unifying principle.
Description in a few paragraphs:
Avila leads and shapes the field of dynamical systems. With his collaborators, he has made essential progress in many areas, including real and complex one-dimensional dynamics, spectral theory of the one-frequency Schrödinger operator, flat billiards and partially hyperbolic dynamics.
Avila’s work on real one-dimensional dynamics brought completion to the subject, with full understanding of the probabilistic point of view, accompanied by a complete renormalization theory. His work in complex dynamics led to a thorough understanding of the fractal geometry of Feigenbaum Julia sets.
In the spectral theory of one-frequency difference Schrödinger operators, Avila came up with a global description of the phase transitions between discrete and absolutely continuous spectra, establishing surprising stratified analyticity of the Lyapunov exponent."
---------------------------------------------------------------------------------------------------------
The connection here, as it is related to the specific "Deep Crab" harmonic pattern in trading, between intuition and general, analytical result, is illustrated somewhat simplified (but without distortion).
In essence, Avila has shown that in dynamical systems, in the neighborhood of phase-transitions in the case of one-dimensional (such as: Price) unimodal distributions, after the onset of chaos, there are islands of stability surrounded nearly entirely by parameters that give rise to stochastic behavior where transitions are Cantor Maps - i.e., fractal.
From that point it is an obvious next step to generalize to other self-affine fractal curves , such as the blancmange curve , which is a special case of w=1/2 of the general form: the Takagi–Landsberg curve. The "Hurst exponent"(H) = -log2(w) , which is the measure of the long-term-memory of a time series .
Putting it all together, it is not pure coincidence that a reliable pattern (representation) emerges from intuition (observation) which proves to be a highly stable (reliable) pattern that is most often the hallmark of a near-term, violent transition.

EURJPY ADVANCE HARMONICS PATTERN CRAB BULLISH EURJPY has formed on its hourly chart an Advance Harmonics Pattern Crab Bullish an the price is trading above the long entry level EL: 153.757.
ST: 153.425
Target: 100% AB: 156.648


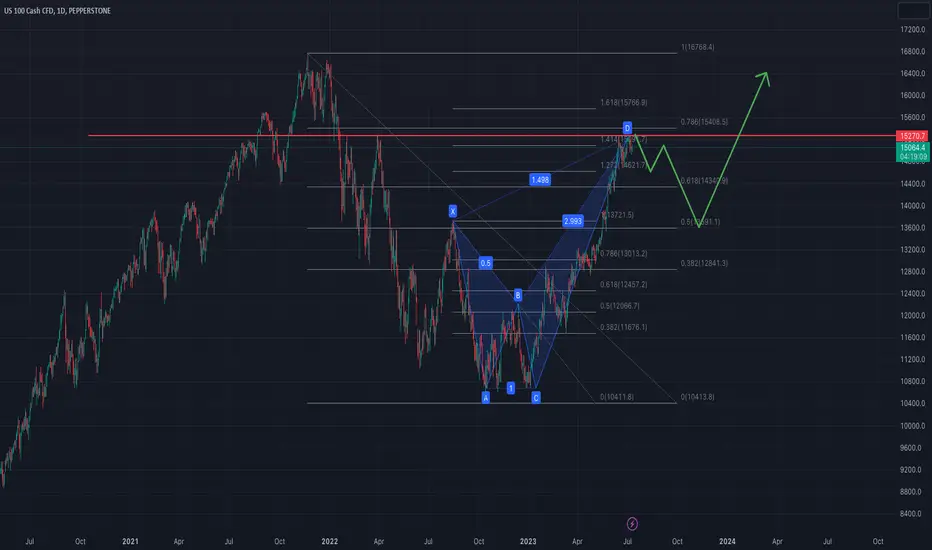
NDX at technical resistance- NASDAQ is completing CRAB pattern.
- Prices of mega-cap tech companies seem to be exhausted
- We may see potential correction from 15300 down to 14360
Major Counter-Trend Trade🔍 Dive into my latest analysis on the related article and compare it with my previous week's analysis.
📉 Just like last week, we have identified the formation of a Bearish Shark Pattern. This pattern suggests a potential bearish movement in the market.
⚖️ For conservative traders, it's recommended to wait for a violation of the trendline on the 4-hourly chart. Once the trendline is violated, patiently wait for the retest before considering entering the trade.
Stay updated with my analysis as we navigate the market and uncover potential trading opportunities. Don't miss out on valuable insights! 💼📈

Finally, Shorting Opportunity📉 After a week of waiting, the market has finally retested my preferred entry price for a short position on the Bearish Crab Pattern(daily chart), which complements the Bearish Shark Pattern(weekly chart) at the 88.50 level. Check out the link article in the TradingView post for a refresher on last week's discussion.
💼 Trading is all about minimizing initial stop-loss and maximizing profits sensibly.
🔄 A retest of the key resistance level at 88.60 on the 1-hourly chart would confirm this trading idea for me.
🔝 This trade holds the highest priority for me in the upcoming week.
Share your highest priority trade for the week! 📊💭

Grimace new GemWe can see clearly accumulation of smart money and smart people. In a next couple days i can clearly see bullish momentum. I also add Fibs to the graph so you would probably understand how serious am I right now. Don`t be the one who lost hypetrain while waiting on the station.
P.s 15 dollar target

GBPJPY: Bearish Crab Visible on the DailyThere is no Bearish Divergence or anything at this level, but I have a pretty good feeling that GBP will be Bearish against both the CAD and the JPY in the near future, so I think this Bearish Crab has a good chance of playing out.

Trend Doesn't Matter!!I'm not saying that trend isn't important, but on this particular trade, it is NOT.
And that is because the NZDJPY is on a sideway market, and it didn't show a particular prominent sign.
My top focus is to wait for a shorting opportunity on the Bearish Crab Pattern that shows up on the daily chart. It is common for crab patterns to have their retest before the actual move.
Why this Crab Pattern?
It coincides with the Bearish Shark Pattern on the Weekly Chart.
If you want a buying opportunity, a magic candle confirmation 87.21 on the 1-hourly chart will allow you to engage the trade. Gartley Pattern is the first pattern that was discovered. What makes this Bullish Gartley Pattern interesting is that the completion falls on the Key Support Level on the Daily Chart, marked as the Blue Horizontal Line, indicating a Key Support Level.
This is both amazing and disturbing to see for both traders.
What's your take on the NZDJPY?

Measurable Data Token (MDT) formed Crab for upto 23% pumpHi dear friends, hope you are well and welcome to the new update on Measurable Data Token (MDT) token.
Our last successful trade of MDT was as below:
Now on a 4-hr time frame, MDT with Bitcoin pair has formed a bullish Crab move for another price reversal.
Note: Above idea is for educational purpose only. It is advised to diversify and strictly follow the stop loss, and don't get stuck with trade.

League of Kingdoms Arena (LOKA) Formed Crab For upto 21% pumpHi dear friends, hope you are well and welcome to the new trade setup of League of Kingdoms Arena (LOKA) with BTC pair.
Our last successful trade of LOKA was as below, and it was more than 117% pump
On a 2-hr time frame, LOKA formed a bullish Crab move for another price reversal.
Note: Above idea is for educational purpose only. It is advised to diversify and strictly follow the stop loss, and don't get stuck with trade.


