WKHS 4 Hrs NASDAQ:WKHS
DISCLAIMER:
I am not a financial or investment advisor. All information found here, including any ideas, opinions, views, predictions, forecasts, commentaries, suggestions, or stock picks, expressed, or implied herein, are for entertainment purposes only and should not be construed as personal investment advice. If you decide to invest, please make your own decision, or contact the specialists’ institutions. Thank you
Crab

TRXUSD: Falling Three Methods Bearish Continuation PatternWe recently reversed from and hourly Crab and now we are looking at a falling three methods daily continuation pattern while it's below the 55 day moving average.

Bearish 🎭 - Shark (with $1 Deep Crab)HEXO makes headlines today
>>> such a nasty Bearish 🎭 Shark (with $1 Deep Crab) ... one more thing, bring a bottle of HEXO (shaken not stirred) ...
>>> wow, this type of reversals 🎭 only happen at the Bottom ($2 price tag for HEXO is ridiculously cheap)
>>> my dear it's a Gift for Christmas, if HEXO can turn around in december/february to $11

EUR/USD Bullish Deep CrabPotential Bullish Deep Crab pattern forming on EUR/USD. I think we're about to bottom for a while. I think we are in wave 2 of a much larger wave 3 as well. The US dollar relative value(DXY) is about to top off. A much larger wave of inflation coming to the US, Maybe even temporary hyperinflation.

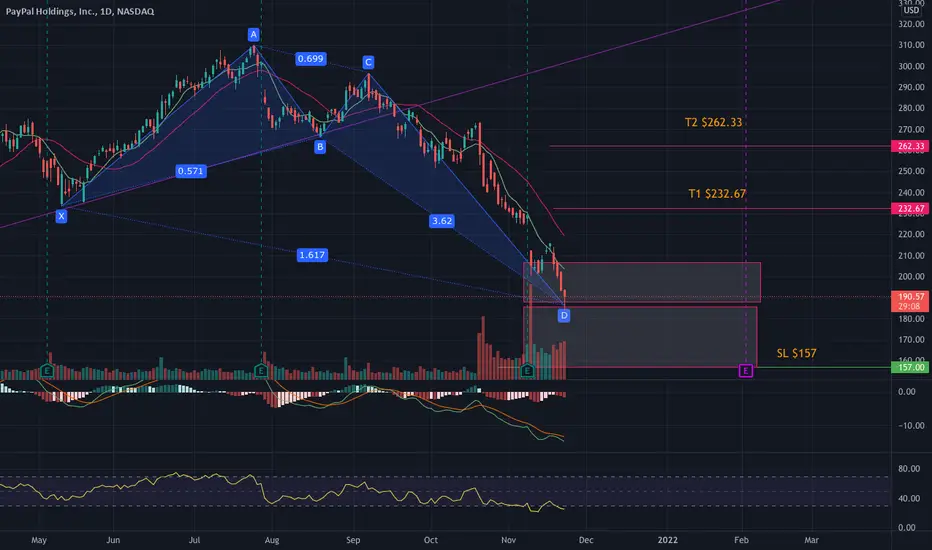
Paypal Bullish Pattern Long-TermPYPL Bullish CRAB pattern.
All indicators are negative, wait for rebound and indicators to show reverse before getting in.

eternal otoPANCAKESWAP:ETERNALBUSD eternal oto crypto testing trading view utilitys
eternal oto crypto testing trading view utilitys
eternal oto crypto testing trading view utilitys
eternal oto crypto testing trading view utilitys
eternal oto crypto testing trading view utilitys


PAYPAL Bullish on DailyPYPL formed a Crab pattern on daily.
Watch for current levels to be held and notice the weak RSI and Negative divergence.
AXS/USDTP (Interval 2H) Bullish CrabAXS is making a bullish crab pattern, I have marked all TPs with Entry and SL according to Fibonacci values. Lets go!

Master CardNYSE:MA Formed a Positive Harmonic Crab on a 30 Mins it will reach T1,T2 RSI,MFI ready to take off


Crab Complete 🦀EUR/CAD - Deep Crab Complete on a strong demand level, we have multiple BOS and bullish momentum on LTF, I'm looking to swing this to at least 50% to cover imbalances above/take out liquidity.
Let me know your thoughts!

Potential Crab Forming 🦀EURUSD - Potential Crab Pattern, waiting for a pullback/test before potentially entering this retracement up to the PRZ zones, D point of crab lands on nice imbalance zone and theres another zone above which is also nice where the .768 lands, all depends how strong the downtrend is.
I'm looking to trade this from as low to the DL as possible with LTF confirmation.
(Remember if you trade this be careful with your lots as your trading against HTF momentum)
Let me know your thoughts!
** Disclaimer ***
These ideas I never trade until the end target with my initial lots, I focused on high probable entries with higher lots and use a specific partial taking strategy giving me a very high win rate and take most of my profits very early, I only leave a small % of my capital to run the entire trade. On the flip side im constantly monitoring LTF momentum and will close early if things change, these analysis's are for research purposes only.
If your interested in knowing more about my specific trading strategy contact me directly or follow the link to one of my free groups!
Thanks guys!

Bearish Crab on TRXUSDWe have a spike in volume with the RSI overbought and a bearish engulfing of the terminal bar at this potential PCZ why not give it a shot.

Potential 🦀USD/CHF - Potential Crab Pattern Forming on LTF, HTF we have a double bottom forming (Not confirmed until we get a neckline break so right now i'm analyzing price based on LTF price action/structure.
We have a lot of imbalance left over from the weekly pushes and the D point lands on a strong OB (Which will potentially make a nice sell too whilst also covering previous imbalances and will take out trapped liquidity)
I expect to drop towards the 1.23285 level before rising to then break the DH.
let me know your thoughts!

REVV potential to increase 400%#REVVUSDT
$REVV broke out from long term descending resistance, but rejected from parallel resistance and touched the support zone, still above support and struggle to break out from resistance.
a CRAB pattern shows price have potential to increase 400% to reach $1.

Long Term Play for BTCTrend looks strong. The fisher doesn't lie. Crab looks like $90k is the target currently.


🟡can BNB reach around 1000$ ?...Hi every one
BINANCE COIN / TETHERUS
BNB has done a Impressive Pump Recently. But this is only a Preparation for more Bullish Movement! as you can see the Price was in a Symmetrical Triangle But the Break out has happened (Weekly Time Frame) and the Price has the potential to Increase as much as the Measured Price movement (AB=CD). another Thing is that If we Put a Crab pattern on the Chart(EX ret is 1.618 so it is reliable ), we can Understand that The Price is only half way of The Expected Bullish Movement! after reaching the top of the Pattern (around 950-1000$) a correction is Expected to happen up to 0.236 line of Fibonacci Retracement!
Summery:
-BNB was in a Symmetrical Triangle and now is in a Crab Pattern!
-It can Reach 950$
-a correction is expected after that!
💎Traders, if you liked this idea or have your opinion on it, write in the comments, We will be glad.
Things can change...
The markets are always changing and even with all these signals, the market changes tend to be strong and fast!!
Thank you for seeing idea .
Have a nice day and Good luck

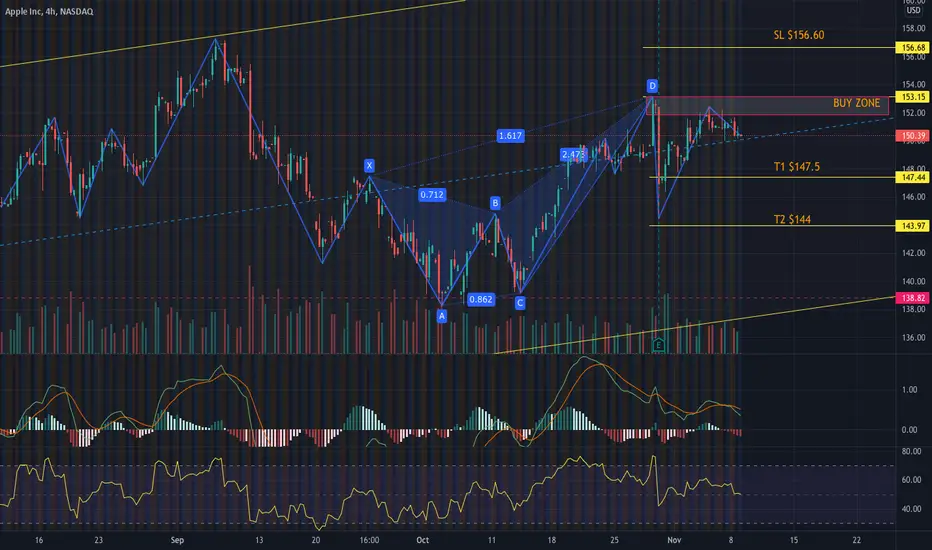
Apple Bearish Pattern 4HAAPL formed a Bearish CRAB Pattern.
Rebounded and achieved T1 and almost T2 and now on its way to T1 again after hitting resistance.