LCTITAN SHORT TERM SET UPMy plan as stated in chart by using Falling wedge and Crab Harmonic pattern for target around 1.618% at point D.
#TAYOR MYX:LCTITAN
Crab


Trade Complete, Now Potential Crab Todays trade completed, beautiful, no DD 120 Pips, i've taken profits due to hitting some liquidity, price may get choppy and its probably not worth holding so im going to wait for the price to hit my Buy zone (D point of the crab)
This fills a nice imbalance, moves nicely with PA and lands nicely on an OB! Mark this level up for an alert on your charts!

GER30 4HR DEEP CRAB 15045 | T2 REVERSAL
Type 2 reversal off the HOP around 14820. Expecting to see bullish impplements above the Focus point at 15045. Price has already showed bullish confirmations above the Terminal range.
Targets: 15410 - 15648
My style of trading focuses on flowing with the trend, and patiently waiting for the story price reveals. Fibonacci, Harmonic Patterns, Wave Sequences, Price Action, and a mixture of Multi-Time Frame Confluence. Most importantly the visual realization of emotions cycled into the chart.
As always THANK YOU and if you found this video helpful, please let me know by giving a like and/or leaving a comment below.
Also, feel free to share your opinion on this setup or any other. The more ideas we can generate together, the more information we can spread to the trading community. STAY PATIENT & BLESSED!
~T$

Potential Crab GBPNZD - Potential Crab pattern, price has broken structure to the upside and taken out the last liquidity zone before a large imbalance. The crab finishes on the OB that caused the imbalance, I can see a strong reversal from this zone if price reaches.

ATOMUSDT CRAB SET UPMy plan is Crab pattern will complete if price BO above B level and achieve at point D around 1.618%.
SL(stop loss) if price below C level and this setup will invalid.
#TAYOR HUOBI:ATOMUSDT

KTB WILL LU 100%?By using Crab pattern projection and Fibo extension show that price will achieve max to 0.34
Risk management 1:10 ratio.
Price must BO above B level for confirmation and CL if fall below 0.15
#TAYOR MYX:KTB

DCRUSDT CRAB PATTERNCrab pattern will complete if price achieve to point D around 1.618% Fibo ext.
It shows freshly BO from downtrend line (yellow line) and that for reversal signal confirmation.
CL (cut loss) if price below point C level.
#TAYOR HUOBI:DCRUSDT

AUDNZD SellThis is my idea on AUDNZD pair.
Pattern: Bearish Crab
What do you guys think?
Good Luck Everyone.

DNEX COMFIRMATION BO DTLMy plan as stated in chart.
Target by using Crab pattern around 1.618% (gren line).
CL if BO below C level (red line).
#TAYOR MYX:DNEX

Bat Inside Crab Potential Bat inside the deepcrab, possible pullback to clear the imbalance before continuing the downtrend.
If price reaches this zone I'll look to take a short!
What's your thoughts?

Great Entry LTF Shark completed, price dropped lower and hit consolidation, it's now breaking to the upside after multiple touches to the low and is bullish on the HTF

BTC Sell at 47800
BTC Sell at 47800
Targets around 46780 & 46290 at the -13 & -618 Fibonacci levels
My style of trading focuses on flowing with the trend, and patiently waiting for the story price reveals. Fibonacci, Harmonic Patterns, Wave Sequences, Price Action, and a mixture of Multi-Time Frame Confluence. Most importantly the visual realization of emotions cycled into the chart.
As always THANK YOU and if you found this video helpful, please let me know by giving a like and/or leaving a comment below.
Also, feel free to share your opinion on this setup or any other. The more ideas we can generate together, the more information we can spread to the trading community. STAY PATIENT & BLESSED!
~T$

Mini Potential H&SMini potential H&S, if neckline breaks....
I think price will tap the .816 or the .786, fill the imbalance maybe tap the 50 EMA then continue on the downtrend towards the D point of the Crab, i'm not trading this one though until I have more confirmation.
There is a schematic forming on the lower TF at current price, LTF is bullish.

AUDCAD - Bearish CrabA bearish crab pattern may emerge and complete at 0.9240 for a shorting opportunity.
On the other hand, traders who are looking at the 4-hourly chart might have a different view. A bullish bat pattern.
This is why it is very important to follow your trade plan and stay out of the trade if you aren't certain.
I'll be checking the candle formation on Monday morning for a 3-bar reversal for a buying opportunity within the Bullish Parallel Channel and I will observe how the market will react at Point D of the Crab Pattern.

GBPUSD-Weekly Market Analysis-Oct21,Wk2Having the Weekly Support level 1.3606 turns into the Key Resistance Level, GBPUSD is set for a ride down for the foreseeable future.
I'm waiting for a shorting opportunity when the market retest 1.3606. Another shorting opportunity could be the bearish trendline that went across Point A to Point C on the Emerging Bullish Deep Crab Pattern.

XTZUSDT DEEP CRAB FORMATIONDeep crab will complete when price achieve point D around 1.618% fibo extension.
This for short term target and CL(Cut loss) if price below 7.16 (red line).
#TAYOR BINANCE:XTZUSDT

Potential Crab Forming Crab Pattern forming, D point lands in a previous orderblock & fills an imbalance, we should get some nice rejection here, 30/50 pips which will cover imbalance left by the previous drop before the trend continues downward.

Potential Crab Potential Deep Crab, almost complete, (So Im going to scalp down the remaining gap)
I missed the 1000 pip drop yesterday on my limit order buy a few pips, (Check my other analysis) However price has broken previous support and now the weekly low, the next target is the 1H imbalance & Orderblock which alighns with the D point of the crab!
Whats your thoughts?

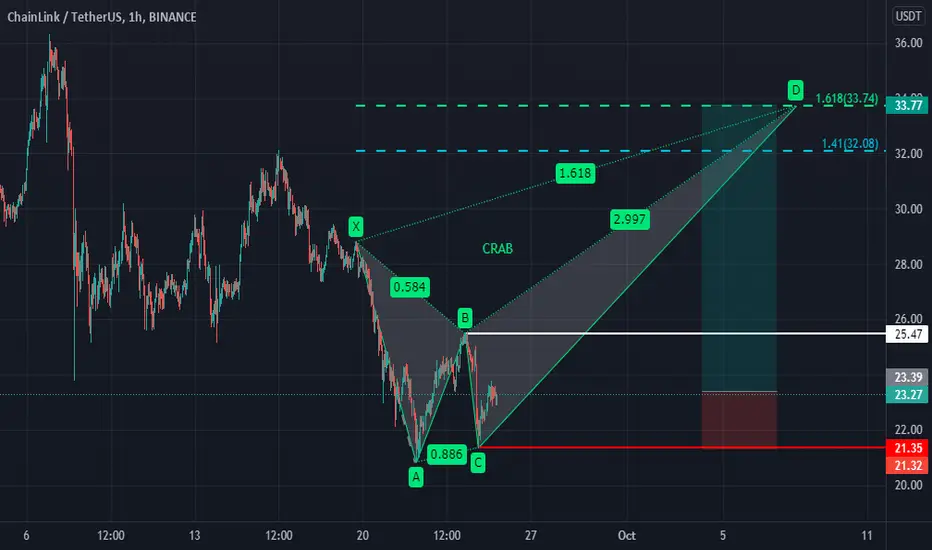
CHAINLINK CRAB PATTERN SETUPMy prediction it will make reversal from DTL and form Crab pattern as stated in chart.
#TAYOR BINANCE:LINKUSDT
Crab Before Reversal?USDJPY, this is where I believe price will reverse and if not reverse give a strong reaction/bounce at least 50/100 pips, I will be setting a limit order here, we have a daily order block + and imbalance fill in the same zone which lands directly inside the D point of this crab on the Daily chart.
Lots of confluence here.
What's your thoughts? a

Deep Crab@1.618XAGood morning,
look to that, the pattern it's really close to completion and we got get ready to trade it soon;
But the price it's already being denied even though it has not reached the PRZ and completed Pattern yet.
Rules:
1. Harmonic Patterns Completion (Deep Bullish Crab@1.618XA) - 99% Complete;
2. PRZ Hit - Waiting;
3. PRZ Test -Waiting;
4. Terminal Bar - Waiting;
5. Type-1 Reaction - Waiting;
6. Type-2 Reversal - Waiting;
7. Candlestick Reversal Sign - Waiting;
8. Candlestick Confirmation Sign -Waiting;
9. RSI Reversal Sign - Waiting;
10. RSI Confirmation Sign -Waiting;
11. Risk Management - Applied;
12. Risk / Reward - 1/3.
" And this is my prayer: that your love may abound more and more in knowledge and depth
of insight, so that you may be able to discern wht is best and may be pure and blameless
for the day of Christ."
Philippians 1:9-10 NIV

Deep Crab Complete! Deep Crab Complete, tapping into an imbalance/demand zone, should get a nice 30/50 pip pullback before the trend continues! (Need to wait for price action confirmation on LT)
