A short on S&P at 5770S&P has been moving up quick strongly over the past few days. It has reached a level that is a strong resistance and we will show this pair today.
1) There is deep crab pattern
2) H1 is overbought
3) There is RSI divergence on M15, M30 and H1
We will take profit when RSI is oversold.
Crab

Wheat Crab Tell us about Talks.Wheat futures remain in a consolidation phase as market participants closely monitor developments in Russia-Ukraine negotiations, which could significantly influence global grain supply dynamics.
Meanwhile, technical analysis highlights a potential bullish signal, with the Crab harmonic pattern suggesting a possible price rebound from the 5,300 level.
Traders are advised to stay cautious, as geopolitical uncertainties and technical factors could lead to heightened volatility in the near term.

Sell HK50 at 24800There is a pattern to sell this pair at the stop loss level (24800)
This level was resisted yesterday. It is the all time high and a counter trend.
Will look to exit as soon as it goes oversold and attempt to go long.

USD/CHF: Bearish Continuation Towards Key SupportUSD/CHF has maintained a strong bearish trend, forming a series of lower highs and lower lows. The chart highlights a **Deep Crab** harmonic pattern, which previously triggered a corrective move before resuming its overall downtrend.
Currently, price action is trading near **0.8767**, approaching a key support zone at **0.8722** (HOP level). The recent rejection from the **H4 supply zone** around **0.8920** further confirms bearish momentum, suggesting sellers remain in control.
**Key Considerations:**
- A breakdown below **0.8722** could accelerate further downside, extending losses towards lower psychological levels.
- A potential pullback may occur if buyers step in at support, but the overall bearish structure remains intact unless a significant reversal signal appears.
**Conclusion:** USD/CHF remains under bearish pressure, with a high probability of further declines. Traders should monitor price action at support for potential continuation or reversal signals before committing to new positions.

EUR/JPY Market Analysis: Potential Reversal at Key Resistance LeThe EUR/JPY pair, on the 4-hour chart, exhibits a strong bullish impulse that recently peaked around 163.64 , aligning with a key Fibonacci extension level (1.618). This area marks a critical resistance zone, where price action has shown signs of rejection.
The Harmonic pattern, such as the b]Crab , suggest potential exhaustion of the uptrend. The latest leg upward reached a 2.618 extension , reinforcing the possibility of a corrective move. Support levels to monitor include ** 162.23 ** (BC) and ** 160.59 ** (T1), which could serve as downside targets if bearish momentum gains traction.
For traders, a decisive break above **163.64** could invalidate the short-term bearish bias, paving the way for further upside. Conversely, sustained rejection from this level may trigger a deeper retracement towards key Fibonacci and harmonic support zones.
Conclusion : The pair is at a critical inflection point, where price action and confirmation of rejection signals will determine the next directional move. Traders should watch for price action at resistance and key support levels to assess trade opportunities.

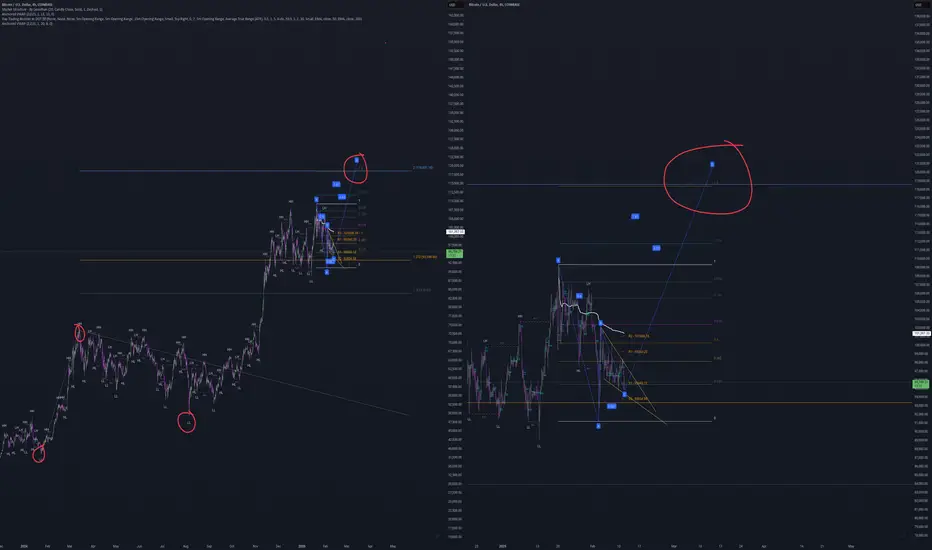
BTC Macro - Medium Short Term - Trivial Analysis BTC Macro - Medium Short Term - Trivial Analysis
Projected Target based on previous time frame fib extension:
Trend based Fib Extension from LL begining 2024 to HH to LL - extension 2.0
Current (Point A):
Local CRAB Harmonic Target previouse fib 2.0 target
X A B C D -> crab pattern with fib extension pointing to target from Fib noted in point A
----
If I get anymore warnings from TradingView on False advertising - I will stop posting all together!
USD/CAD - Harmonic Patterns and Momentum IndicatorsTechnical Analysis of USD/CAD - Harmonic Patterns and Momentum Indicators
Overview:
The USD/CAD chart illustrates price action on the hourly timeframe, incorporating harmonic patterns, Fibonacci retracements, and momentum indicators to identify potential reversal and continuation points. The presence of a Crab harmonic pattern suggests a critical turning point, while momentum oscillators provide additional confirmation.
**Harmonic Pattern Analysis:**
1. A **Crab harmonic pattern** is evident, with the price reaching the terminal point at approximately **1.44627**.
2. The **XA and BC Fibonacci extensions** align with key retracement levels, reinforcing the likelihood of a reversal at this zone.
3. The price has **rejected the high point**, indicating potential exhaustion of bullish momentum.
**Support and Resistance Levels:**
- **HOP (Harmonic Optimal Point):** **1.44627** - The potential completion zone of the Crab pattern.
- **XA Retracement:** **1.43968** - A key structural support level.
- **BC Level:** **1.43721** - A secondary support level for price continuation.
- **T2 (Target 2):** **1.42596** - A potential downside target if bearish momentum continues.
**Momentum Indicators:**
- **Stochastic RSI & Relative Strength Index (RSI):**
- The **Stochastic RSI** shows a recent overbought condition, followed by a decline, indicating potential bearish momentum.
- The **RSI also exhibits bearish divergence**, where price made a higher high while RSI formed a lower high, suggesting weakening bullish strength.
**Market Sentiment & Potential Trade Opportunities:**
- Given the rejection at **1.44627**, a **short position** could be considered if confirmation of further downside emerges.
- A break below **1.43968** could reinforce the bearish bias, with **1.42596** as a potential target.
- However, if the price finds support and rebounds, a bullish continuation could be anticipated, requiring further validation.
**Conclusion:**
The **Crab harmonic pattern, overbought momentum indicators, and Fibonacci confluence suggest a possible bearish reversal**. Traders should monitor **key support levels and momentum shifts** to determine whether the bearish scenario plays out or if buyers regain control. Risk management and confirmation signals are crucial before entering a trade.

The time of problems has passed, now only up to conquer the heigIn fact, everything is going perfectly for us and now is the perfect moment to buy a company for many years to come

GBP/USD: Distribution Signals a Drop to 1.25GBP/USD appears to be in a distribution phase, struggling to break through resistance around 1.2620. The price has formed multiple rejection points at this level, indicating weakening bullish momentum.
The recent lower high, combined with a potential break of the ascending trendline, suggests sellers are regaining control. If price breaches the key support zone, a move towards the 1.2500 region becomes increasingly likely.
With a bearish harmonic pattern and liquidity grab indications, GBP/USD could see further downside as selling pressure intensifies.

GBP/USD at Key Resistance: Potential Reversal or Continuation?The GBP/USD 15-minute chart indicates a strong uptrend, with price action forming a **Crab harmonic pattern**, suggesting a potential overextension. The pair has reached a key resistance zone at **1.26323**, aligning with significant Fibonacci levels, with the **Harmonic Optimal Point (HOP) at 1.26469** acting as a potential reversal area.
If a pullback occurs, the first downside targets are 1.26127 and 1.25993 , while the ** 200 EMA ** below may provide further support. A sustained break above 1.26469 could signal continued bullish momentum. Traders should monitor price action for confirmation before positioning accordingly.

GBP/USD Market Analysis – Bearish Reversal from Harmonic PatternThe GBP/USD pair has completed a Crab harmonic pattern , with price reaching the 1.618 extension level and reacting strongly at resistance near 1.2617. The rejection suggests a potential bearish reversal.
Initial downside targets (T1 and T2) are at 1.2515 and 1.2445. If price sustains below 1.2593 (AB=CD level), further downside is likely. However, a breakout above the high could invalidate the bearish setup. Traders should watch for confirmation signals before taking positions.

ITC short term target could be 300ITC on weekly time frame has broken support channel.
Moreover, it has formed crab pattern.
With this it has potential for 300 with following levels.
380 / 360 / 350 / 320 / 300.
SL:425

Harmonic Within a Harmonic on Gilead. GILDThey are crooked looking, but are present. Another tangent of evidence on the obvious fractal nature of markets. That thick candle to us confirms break of trend and the underlying indicators are also suggestive. It is prudent to note that the indicator readings have been formed by price action, volume and volatility immediately coming prior to that candle. Good luck out there!
GBPUSD BULLISH CRABHarmonic Pattern Trading Strategy:
1. Combine patterns with 2-3 confirmations (e.g., MA, BB, RSI, Stoch) for increased accuracy.
2. Implement proper risk management.
3. Limit exposure to 3% of capital per trade.
4. Exercise caution: Not every Harmonic Pattern presents a good trading opportunity.
5. Conduct thorough diligence and analysis before trading.
Disciplined approach = Enhanced edge.

Selling FTSE at the all time high of 8690The FTSE has reached a critical level and looks ready to come down.
1) There is a double top on D1 with Divergence
2) There is a huge pattern to sell for the 2nd time and target 8260 area
3) There is a smaller pattern to sell as well with a smaller stop loss.
We will take this trade with a smaller stop loss and the big target. This will be a long term trade that may take time to materialize but we will actively monitor it for profits.

USDJPY with a 2.95 Profit Factor on the 1-Hourly ChartI’m keeping a close eye on USDJPY right now, and here’s why:
- High Profit Factor : Target 1 offers a whopping 2.95 Profit Factor, which is quite attractive.
- Timing : Even though NFP is coming up tomorrow, this trade is on the 1-hourly chart. It’s possible that price action could reach my first target or meet the criteria that allows me to shift my stop to entry, thus achieving a risk-free trade, before the big event.
Key Points to Remember:
- Volatility Alert : NFP can cause sudden market movements. Keep that in mind and monitor your positions closely.
- Risk Management : Once the market fulfills the criteria for Target 1, I plan to shift my stop to entry. This approach helps protect any unrealized gains and reduces stress during high-volatility news.
If you’re considering this trade, stay cautious around the NFP release, and remember to include our stop-loss buffer to manage your risk effectively.
What’s your take on USDJPY heading into NFP? Are you eyeing any other setups? Share your thoughts below!
Happy trading, everyone! 🚀

UK100 Deep Crab Pattern
The harmonic pattern suggests a deep pullback in the London Stock Exchange index, with a potential drop from 8700 to the level of 8400.
It looks like we might be in for a bit of a rough ride in the market.
Keep an eye on your investments and be prepared for some fluctuations ahead.
It's always good to stay informed and stay on top of the latest market trends.

XAU/USD $$$
This zone. The new zone is valid and with confirmation from the lower timeframe we can enter. If this zone is broken, gold can fall to the lower 4-hour area.
Price: 2763.500 and 2758

FNMA near term resistance possibleFNMA daily update
Government has determined a path to release from conservatorship, if this happens then this stock will be relisted and be worth a lot more than the current value
At present the stock is nearing a short to medium term resistance level using elliot wave and fibonacci/ harmonics between $4.62 and $4.69
There is a clear crab pattern that aligns with Robert Miners 5th wave projection levels as well, with RSI closing in on 80 which is extremely overbought (But largely irrelevant in trends)
It does hint that there will be a short to medium term pause which would align with getting more details of the plan to release these massively profitable behemoths from government conservatorship
I've been long on this stock for years and already pulled my original money back out, but see some complex corrections happening for a while around where we are before blasting upward into a larger wave 3 structure

NRT NYSEOil and Gas Royalty trust
Multiple reasons to buy, but I will not be as my local broker does not enable purchases for this
Interesting chart with decent fundamentals
I do not know the rules around royalty trusts, or if you can trade these or purchase only and what the terms are on the lease agreements to extract oil and gas...

Hormonics Reversal PRZ Zone on Up side 23316-23265 Targer 24020
The Harmonic Reversal Potential Reversal Zone (PRZ) on the upside between 23316-23265 indicates a specific area where the price is expected to react or reverse based on harmonic trading principles. Here's how to interpret and potentially trade this zone:
1. What Does This PRZ Mean?
The zone 23316-23265 is calculated using Fibonacci retracements and extensions from a harmonic pattern.
It suggests a tight range where the price may reverse direction on the upside.
2. Why Is It a Reversal Zone?
This zone represents the completion point (D) of a harmonic pattern (e.g., Gartley, Bat, Crab, Butterfly).
Convergence of Fibonacci levels within this range increases the likelihood of reversal or strong price reaction.
3. How to Trade the PRZ?
(a) Wait for Confirmation:
Do not enter trades immediately. Look for price action confirmation:
Reversal candlestick patterns (e.g., Shooting Star, Bearish Engulfing).
Indicators showing divergence (e.g., RSI, MACD).
Trendline breaks or volume spikes.
(b) Risk Management:
Stop Loss: Place a stop loss slightly above 23316 (if expecting a reversal downwards).
Entry: Enter trades when price action confirms rejection from the PRZ.
Take Profit: Use Fibonacci levels or key support zones below 23265.
(c) Scenario Analysis:
If Price Breaks the PRZ on the Upside:
Treat it as invalidation of the harmonic pattern.
Look for potential continuation above 23316.
If Price Reacts Within the Zone:
Observe for strong rejections or consolidations before entering a short trade.
4. Visual Representation
The PRZ between 23316 and 23265 forms the critical price range where:
The harmonic pattern completes.
Fibonacci levels overlap, creating a high-probability reaction zone.

Understanding the US10Y Crab Pattern in 2024
The US10Y refers to the 10-year Treasury bond yield, which is a key indicator of the overall health of the economy and is closely watched by investors.
"Analyzing the US10Y trend, a bearish butterfly pattern has emerged at the 1.276 and 1.618 level, indicating a potential bullish trend in 2023. This pattern suggested a reversal in the current market direction, and The US10Y bond market has been exhibiting an intriguing pattern known as the "CRAB PATTERN," with implications for the year 2024.
This pattern suggests that the market may experience a period of consolidation before potentially reversing its direction. Additionally, the presence of a parallel channel further supports the notion of a bearish trend, as this technical indicator typically indicates a downward trajectory in the market.
Traders and analysts should closely monitor these developments and consider potential strategies to navigate the market amidst this anticipated trend.
It is crucial to conduct thorough analysis and consider various factors before making any significant trading decisions in response to the observed pattern and trend.

Weirdo ancient AI coin NMR may revisit its ATH after allTwo possible scenarios from here: either it reaches its long term trendline from many years ago and rejects from it again to reaccumulate or breakout or it flips it and carries onwards towards its ATH.
Lesson learned? Don't launch a coin if your last name is literally Crab. Your coin will keep crabbing....
Happy trading
