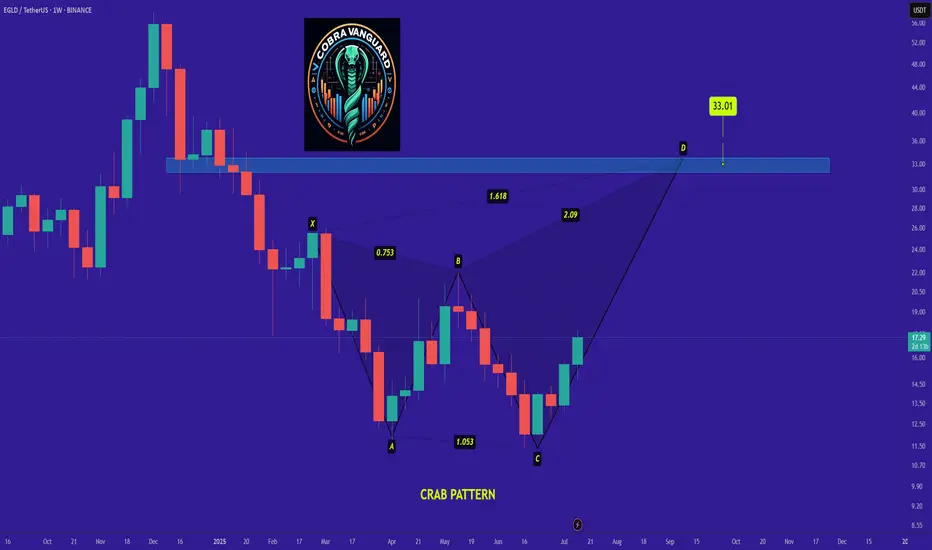
EGLD is bullish now & many Traders don't see it !!!Be careful with EGLD !!!
we can hope that the price will act like a Crab pattern and the price will grow well.
I expect that the price will grow very quickly...
Stay Awesome , CobraVanguard.
Crabpatterns
A quick long on NikkeiWarning: This is a counter trend quick trade.
JPN is in a downtrend on Daily. H4 is flat.
After last night's sell off there will be some buyers in the market looking for a deal.
We are going long based on:
1) There is a crab pattern
2) RSI divergence on M15
3) Strong support at 37500 area
Stop loss is 200+ pips and target is 400.

$MSFT – Breakdown Confirmed, Bearish Pressure Mounting?NASDAQ:MSFT
The stock broke key support at $404.37 in yesterday’s session, signaling a potential for further downside. This breakdown confirms the breach of a major consolidation triangle that had been forming since the August 5, 2024 lows, following a sharp decline from $468.35.
🔹 Bearish Scenario – Lower Levels in Focus:
With the triangle breakdown confirmed, price action suggests continuation to the downside. A Bullish Deep Crab pattern could emerge if the stock reaches $373.02 , aligning with the 161.8% Fibonacci extension level. This level also converges with the 38.2% Fibonacci retracement, making it a key area to watch for potential stabilization.
🔹 Key Levels to Watch:
📉 Support: $404.37 (broken), $373.02 (deep crab PRZ), key retracement levels
📈 Resistance: $412.85, $423.40, $437.22
💡 Momentum remains bearish, and we should monitor whether the stock accelerates toward the $373.02 zone, where a technical bounce could develop.
Is NASDAQ:MSFT heading for deeper correction, or will the deep crab pattern play out? Let’s discuss in the comments! 📉
Happy Trading,
André Cardoso
💡Risk Warning: Trading financial assets carries a high level of risk and may result in the loss of all your capital. Make sure to fully understand the risks involved before you start trading and carefully consider your investment objectives, level of experience, and risk tolerance. The data and information provided in this content do not constitute financial or investment advice and should not be considered as such. Only invest what you can afford to lose, and be aware of the risks associated with trading financial assets.

Gold Bearish Crab Signals Potential Reversal!FX_IDC:XAUUSD
Gold is currently testing a critical resistance zone near $2,947, where a Bearish Crab harmonic pattern has formed. This structure suggests potential downside risk as price approaches exhaustion at this key level.
🔹 Technical Breakdown:
📌 Resistance: $2,956
📌 Bearish Crab PRZ (Potential Reversal Zone): $2,947
📌 Support Levels: $2,916 → $2,795
If gold fails to break and hold above $2,947, we could see a pullback toward $2,795, aligning with the monthly fractal resistance. However, a sustained move above $2,956 would invalidate the bearish scenario, potentially opening the door for further upside.
Happy Trading,
André Cardoso
Risk Warning: Trading financial assets carries a high level of risk and may result in the loss of all your capital. Make sure to fully understand the risks involved before you start trading and carefully consider your investment objectives, level of experience, and risk tolerance. The data and information provided in this content do not constitute financial or investment advice and should not be considered as such. Only invest what you can afford to lose, and be aware of the risks associated with trading financial assets.

$BTCUSD Expansion or Reversal? Key Levels to WatchBITSTAMP:BTCUSD
Overview
We explore the key resistance and support levels, potential pattern formations, and what we should monitor in the coming sessions.
Bitcoin appears to be forming an expanding triangle within the broader range of its weekly fractals. Additionally, there is the potential emergence of a double top reversal pattern . This pattern has a critical support level at $89,164, which acts as a neckline. A breakdown below this support could threaten the weekly fractal support positioned at $91,530. If the breakdown confirms , Bitcoin may experience a significant decline, targeting the previously broken monthly fractal resistance at $73,794 , representing a potential 17% drop . This level coincides with the 200% Fibonacci extension, often seen as a default target for a double top reversal.
Despite the downside risks, a corrective move lower may provide a bullish setup. A key support level at $76,368 aligns with the 161.8% Fibonacci extension of the last bullish swing. A potential Bullish Deep Crab Pattern could form around this level, indicating a possible reversal. If Bitcoin reaches this zone, traders should monitor price reactions for signs of recovery.
Will Bitcoin break higher, or is a deeper correction on the horizon? Stay tuned for further updates!
Key Takeaways
Weekly Fractal Resistance: $109,359
Weekly Fractal Support: $91,530
Daily Fractal Resistance: $98,871 (rejecting 38.2% Fibonacci retracement at $98,314)
Daily Support: $93,340 (above weekly fractal support)
Critical Support Level: $89,164 (neckline for a potential double top)
Downside Target: $73,794 (previous monthly fractal resistance, aligning with 200% Fibonacci extension)
Bullish Reversal Zone: $76,368 (161.8% Fibonacci extension, potential Bullish Deep Crab Pattern)
It is important to remain neutral regarding bias unless the price confirms the pattern with a breakdown below the neckline. Until that happens, the market structure remains open to different scenarios, and traders should focus on confirmation signals rather than assumptions.
Happy Trading,
André Cardoso
Risk Warning: Trading financial assets carries a high level of risk and may result in the loss of all your capital. Make sure to fully understand the risks involved before you start trading and carefully consider your investment objectives, level of experience, and risk tolerance. The data and information provided in this content do not constitute financial or investment advice and should not be considered as such. Only invest what you can afford to lose, and be aware of the risks associated with trading financial assets.

Going long on HK50We are taking this position now because at 22760 because
1) H4 and D1 is uptrend
2) There is a M15 pattern
3) At strong support
4) M15 divergence
5) Previous day low
Target is the top 23500 which is about 700 pips away.

A quick buy on FTSE right nowWe are seeing the following on the FTSE
1) H4 is oversold
2) There is H1 divergence
3) 2 patterns at the same level
4) Yesterdays low at 8648
5) Daily trend is up
This is likely to be a quick trade as there is huge resistance at 8685. We may turn short if needed.

ITC short term target could be 300ITC on weekly time frame has broken support channel.
Moreover, it has formed crab pattern.
With this it has potential for 300 with following levels.
380 / 360 / 350 / 320 / 300.
SL:425

The S&P sell before the NFPWe are expecting a drop in the S&P later tonight based on what the charts are telling us.
1) The high of S&P is at 6118 and 6130.
2) There is a pattern to sell at the current level of 6080.
3) Yesterday's high to resist the trade.
4) H1 divergence present as well
The optimistic target is 5930 (1:3 risk to reward). We will monitor and post updates here as the trade moves.

$SPX500 Technical Analysis: Divergence Signals and Key LevelsOANDA:SPX500USD
The SPX500 is currently displaying notable divergence on the daily timeframe chart, highlighting resistance near $6121 while the critical daily fractal support teeters at $5920.
Key Levels to Watch:
Support and Resistance Dynamics: The index faces significant resistance at $6121. Meanwhile, maintaining support above $5920 is crucial to sustain current bullish sentiment.
Confirmation of Support Breakdown: A decisive drop below $5920 would signal a potential retest of the weekly fractal support at $5776. This level's breach would confirm a false breakout above resistance, potentially leading to further downside for the index.
Potential Downside Targets: If the SPX500 extends its decline below $5776, attention should shift to the 161.8% Fibonacci extension, projecting a deeper correction towards $5557. This scenario sets the stage for a potential bullish shark pattern formation near the golden Fibonacci extension level.
Technical Patterns: Previously identified patterns include a bearish deep crab around $6042, suggesting possible downside targets around $5737, near the .382% Fibonacci retracement level. A subsequent bullish shark pattern aligns with the .50% Fibonacci retracement level, reinforcing a critical zone for potential reversals.
Happy Trading,
André Cardoso

GBPUSD CRAB PATTERNHarmonic Pattern Trading Strategy:
1. Combine patterns with 2-3 confirmations (e.g., MA, BB, RSI, Stoch) for increased accuracy.
2. Implement proper risk management.
3. Limit exposure to 3% of capital per trade.
4. Exercise caution: Not every Harmonic Pattern presents a good trading opportunity.
5. Conduct thorough diligence and analysis before trading.
Disciplined approach = Enhanced edge.

WTF it's a crabPossible bullish crab pattern missing one leg down.
It's a harmonic pattern forming very often at the end of the downtrend.
It can make double bottom and finish the downtrend. It is possible to fall further down if this is extended version called deep crab.
Let's wait and see

Hormonics Reversal PRZ Zone on Up side 23316-23265 Targer 24020
The Harmonic Reversal Potential Reversal Zone (PRZ) on the upside between 23316-23265 indicates a specific area where the price is expected to react or reverse based on harmonic trading principles. Here's how to interpret and potentially trade this zone:
1. What Does This PRZ Mean?
The zone 23316-23265 is calculated using Fibonacci retracements and extensions from a harmonic pattern.
It suggests a tight range where the price may reverse direction on the upside.
2. Why Is It a Reversal Zone?
This zone represents the completion point (D) of a harmonic pattern (e.g., Gartley, Bat, Crab, Butterfly).
Convergence of Fibonacci levels within this range increases the likelihood of reversal or strong price reaction.
3. How to Trade the PRZ?
(a) Wait for Confirmation:
Do not enter trades immediately. Look for price action confirmation:
Reversal candlestick patterns (e.g., Shooting Star, Bearish Engulfing).
Indicators showing divergence (e.g., RSI, MACD).
Trendline breaks or volume spikes.
(b) Risk Management:
Stop Loss: Place a stop loss slightly above 23316 (if expecting a reversal downwards).
Entry: Enter trades when price action confirms rejection from the PRZ.
Take Profit: Use Fibonacci levels or key support zones below 23265.
(c) Scenario Analysis:
If Price Breaks the PRZ on the Upside:
Treat it as invalidation of the harmonic pattern.
Look for potential continuation above 23316.
If Price Reacts Within the Zone:
Observe for strong rejections or consolidations before entering a short trade.
4. Visual Representation
The PRZ between 23316 and 23265 forms the critical price range where:
The harmonic pattern completes.
Fibonacci levels overlap, creating a high-probability reaction zone.

Trading Reflection: Embracing Low-Risk, Low-Stress TradingWould you risk $266.38 for a potential return of $757.23?
That's the kind of trade setup I'm focusing on these days.
My Trading Philosophy
Over my 19 years of trading experience, I've encountered many "trading gurus" who claim that achieving a profit factor of 2 is impossible—that it's merely a textbook scenario and unrealistic. I chose to keep my thoughts to myself, but their perspective revealed a lot about their trading approach:
1. Constant Break-Evens and Overtrading: Chasing big wins often leads to overtrading and settling for break-even results, reminiscing about those rare "good feelings" when trades went their way.
2. High-Stress Environment: They operate under constant stress, obsessing over being "right," frequently intervening in trades, and deviating from their trade plans—all justified by their years in the industry.
Finding What Works for You
There are countless ways to trade, and results will vary depending on your strategy. Personally, I prefer a method that allows me to:
- Spend Just 15 Minutes a Day: I review my trading pairs, set alerts, and let the market notify me when it's time to act.
- Use Candlestick Confirmations: I decide whether to engage in a trade based on candlestick patterns at my predetermined entry points.
This approach ensures my profit factor for the final target is always at least 2—often even higher.
Mathematically, I can be profitable with only a 40% accuracy rate.
This allows me to seek trades with high returns and live my life freely for the rest of the day.
Current Trade Idea: Bearish Crab Pattern
I'm eyeing a Bearish Crab Pattern on the 15-minute chart. It might not be picture-perfect, but it offers a profit factor of 2, and I have RSI divergence supporting my idea.
Trade Management
- Once the market touches 164.02 or breaks and closes below 164.21 , I'll shift my stop to the entry price to attain a risk-free trade.
- Remember to include our stop-loss buffer when setting your stops.
Final Thoughts
Trading doesn't have to be high-risk or high-stress. It's about choosing a strategy that aligns with your goals and lifestyle.
Whether you prefer a fast-paced environment or a more relaxed approach, the choice is yours.
What's your trading style?
Do you prioritise low-risk, low-stress strategies, or do you thrive in the thrill of the fast-paced markets?
Share your thoughts and experiences below!
Stay patient, trade wisely, and happy trading! 🚀

NEO Analysis - What Shall we Expect !!!BINANCE:NEOUSDT
As you can see, the price is in a Megaphone. If the price can break this megaphone, we can hope that the price will act like a Crab pattern and the price will grow well.
❤️Stay awesome my friends.
✨Traders, if you liked this idea or have your opinion on it, write in the comments, We will be glad.
_ _ _ _ __ _ _ _ _ _ _ _ _ _ _ _ _ _ _ _ _ _ _ _ _ _ _ _ _ _ _ _
✅Thank you, and for more ideas, hit ❤️Like❤️ and 🌟Follow🌟!
⚠️Things can change...
The markets are always changing and even with all these signals, the market changes tend to be strong and fast!!

Be careful with AMD !!!Be careful with AMD !!!
we can hope that the price will act like a Crab pattern and the price will grow well.
I expect that the price will grow very quickly...
✨We spend hours finding potential opportunities and writing useful ideas, we would be happy if you support us.
Best regards CobraVanguard.💚
_ _ _ _ __ _ _ _ _ _ _ _ _ _ _ _ _ _ _ _ _ _ _ _ _ _ _ _ _ _ _ _
✅Thank you, and for more ideas, hit ❤️Like❤️ and 🌟Follow🌟!
⚠️Things can change...
The markets are always changing and even with all these signals, the market changes tend to be strong and fast!!

GOLD - Time to buy again!As you can see in the chart, after breaking the wedge, the price fell to the support zone, and from now on, the price can follow the crab pattern and go up.
❤️Stay awesome my friends.
✨Traders, if you liked this idea or have your opinion on it, write in the comments, We will be glad.
_ _ _ _ __ _ _ _ _ _ _ _ _ _ _ _ _ _ _ _ _ _ _ _ _ _ _ _ _ _ _ _
✅Thank you, and for more ideas, hit ❤️Like❤️ and 🌟Follow🌟!
⚠️Things can change...
The markets are always changing and even with all these signals, the market changes tend to be strong and fast!!


TSM BEARISH CRAB PATTERNHere is why I think we have a perfect bearish crab pattern on weekly time frame on TSM which gives us a huge short opportunity. Please let me know what you think in the comments section...

Mastering Bullish & Bearish Crab Patterns - Entry, SL & TPs LevlHarmonic patterns are integral to technical analysis in financial markets, and the Crab pattern is one of the most distinct among them. Both bullish and bearish Crab patterns provide precise trading opportunities by indicating potential reversal points in the market. This article delves into the structure, identification, and trading strategies for both bearish and bullish Crab patterns.
____________________Bullish Crab Pattern_________________________
Structure and Identification:
A Bullish Crab pattern is a reversal pattern that signals a potential bullish reversal at the end of a bearish trend. It consists of five points labeled X, A, B, C, and D, forming distinct Fibonacci retracement and extension levels:
XA: The initial move from X to A.
AB: Retracement from XA, typically 38.2% to 61.8% of XA.
BC: Retracement from AB, typically 38.2% to 88.6% of AB.
CD: Extension of XA, typically reaching 161.8% to 224% of XA, and is the longest leg.
Entry, Stop Loss, and Take Profit Levels:
Entry: Place a buy order at point D, where the CD leg completes the 161.8% to 224% Fibonacci extension of XA.
Stop Loss: Set just below point D to safeguard against potential false breakouts.
Take Profit: Use multiple levels:
TP1: 38.2% retracement of the CD leg.
TP2: 61.8% retracement of the CD leg.
TP3: Point C level.
_____________________Bearish Crab Pattern_________________________
Structure and Identification:
A Bearish Crab pattern signals a potential bearish reversal at the end of a bullish trend. It mirrors the Bullish Crab pattern with the same Fibonacci retracement and extension levels but in reverse:
XA: The initial move from X to A.
AB: Retracement from XA, typically 38.2% to 61.8% of XA.
BC: Retracement from AB, typically 38.2% to 88.6% of AB.
CD: Extension of XA, typically reaching 161.8% to 224% of XA, and is the longest leg.
Entry, Stop Loss, and Take Profit Levels:
Entry: Place a sell order at point D, where the CD leg completes the 161.8% to 224% Fibonacci extension of XA.
Stop Loss: Set just above point D to protect against potential false breakouts.
Take Profit: Use multiple levels:
TP1: 38.2% retracement of the CD leg.
TP2: 61.8% retracement of the CD leg.
TP3: Point C level.
Conclusion:
Crab harmonic patterns, whether bearish or bullish, provide traders with high-probability reversal signals by leveraging precise Fibonacci retracement and extension levels. Correctly identifying these patterns and setting appropriate entry, stop loss, and take profit levels are crucial for capitalizing on their potential. As with all trading strategies, it's essential to complement harmonic pattern analysis with other technical indicators and sound risk management practices to enhance the chances of success.

AAPL Bearish Crab Pattern Will Start at 197$the detail is shown in the above Idea.
I made this Idea based on Candlestick Analysis and Harmonic pattern.
We are still in an uptrend and probably we see a significant decline toward the Crab support line in the Next Weeks.
AAPL Resistance and Support Levels Is shown in this chart.
GOOD Luck

Selling AUDUSD now at 0.6574This is a counter trend but here is why we are selling.
Trend:
W1: Down
D1: Down
H4: Up
Moving Average:
Within the Daily MA
H4 pointing downwards
Pattern:
Deep Crab on m30
Strong resistance at 0.6600 to 0.6610
H1 has a double top and divergence.

Bullish Outlook with Retest OpportunityIf you caught the short opportunity on the previous Fib3 Bat I mentioned months ago, congrats on the 836 pips (~8,360 USD/lot) gain! (Link to related analysis available in post)
My overall stance on USDJPY remains bullish. For those eyeing buying opportunities, keep an eye on the daily chart for a potential market retest at 142.47 (refer to the left chart).
What's your strategy or trade plan for USDJPY? Share your thoughts below!
