Best of Both WorldsMy long-term bias on Dollar Appreciation had not ended, however, that doesn't mean I can't short the Bearish Crab Pattern that was completed at 140.42. If you had traded this, it would have given you 106pips(approx. 1,060usd/lot) of running profits.
If you are like me, having the bias to long the USDJPY, the Bullish Gartley Pattern that completes at 137.84 could provide you with such a trading opportunity.
Either way, the M.C confirmation has to appear in both situations.
Crabpatterns

A counter-trend move, is it a good ideaIf you have been following me for sometime, you would know that I've my bias in looking to long the US Dollar.
At this moment, there isn't such opportunity, but multiple shorting opportunity presents itself, in this moment, the bearish crab pattern, retest on the 4-hourly chart.
I will take the trade once the market has show the confirmation and will treat it as a counter-trend trade.

EOSTRY EOS #EOSTRY $EOS LONG UPDATEWe will see new actions after EVM lauch and new projects on EVM will fly to Eos as like Solan and Avax

Important Idea! SHORT - Potential Bearish Crab 31.7kCOINBASE:BTCUSD Potential very early Bearish Crab at 31.7k. Confluence with the upsloping trendline

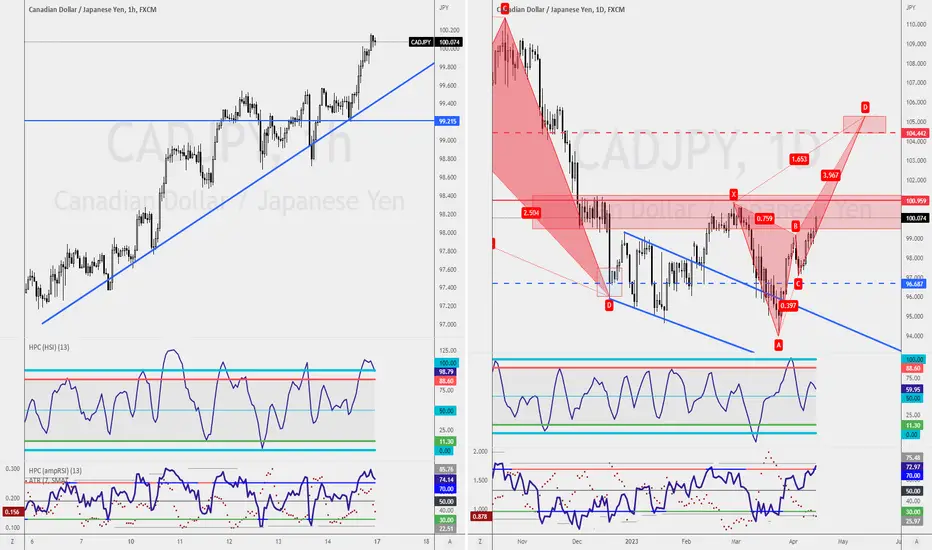
The Art of TradingOn the right, the Bearish Crab Pattern on the daily chart is going to form at 105.29. Like you, I did have the impulse to buy it up and short it down, but that couldn't be the way. At the minimum, the strategy has to be tested.
If you have that thought, you could wait for buying opportunity on the lower timeframe.
I'm waiting for the retest of the trendline on the 1-hourly chart to long.
DOLLAR CRASH!? NOPE! NOT NOW!!If you are on the Media, you would have heard that the DOLLAR is CRASHING, countries are ANTI-US DOLLAR, etc, etc...
I don't see any crashes happening on the chart. It is important for independent traders like ourselves, not to get swayed by the news headline; see it for yourself.
What I'm seeing right now, saddens me more than the crashes; the market is going into the consolidation phase.
How do I know that?
A series of Bat Patterns, that's it. The market reflects on what market participants felt.
If you are looking for shorting opportunity, you are in luck.
On Daily Chart(left), Bearish Bat Patterns completing at 136.96 and on the 1-hourly Chart, we have the Bearish Crab Pattern completing at 132.54 and Bearish Bat Pattern completing at 132.87.

Biggest Profit Potential of the WeekThe Bearish Shark Pattern has been completed on the Daily Chart (right), but it will be crazy to trade off the Shark Pattern on the Daily Chart.
A better way is to engage it off the 1-hourly chart(left) using the Bearish Crab Pattern at HOP at retest with an RSI Divergence.
Hooooooo! It's a mouthful, but that's what I need to engage the trade. Even if it sounds like a perfect heist, there's a chance that we get multiple stop-out before hitting our first profit, but that's the trade I'm willing to take.
This GBPAUD trade almost synchronises with my GBPJPY trade, links at the bottom of this TradingView post. The only thing is that the trade is traded in an opposite direction, which creates a perfect hedge on the UK Pound.
As much as my brain loves to think 1 of them will hit stop-loss, not only does it create a perfect hedge, but I do see trades like these worked out.
That is why I'll trade once the market confirms my entry, regardless of what other traders might think.

Perfect automated detection of Butterfly & DeepCrab PRZ - ShortA bearish-type Butterfly pattern occurred.
If the price rises to 22.862, a bearish-type DeepCrab pattern could occur.
Also on the daily chart, bearish-type BlackSwan pattern is occurring.
Short after seeing the rebound.
*Harmonic patterns are automatically detected using the indicators below.
- Harmonic auto-detect PRO

FTM can Rise from hereFTM has created a Crab Pattern and The length between A and C point shows 0.68 number which means the pattern is reliable. The price shouldn't fall any much further and we shall see a good Pump pretty soon.
_ _ _ _ _ _ _ _ _ _ _ _ _ _ _ _ _ _ _ _ _ _ _ _ _ _ _ _ _ _ _ _ _
🌍Thank you for seeing idea .
Have a nice day and Good luck

55-65$ could be in playThe crab harmonic pattern will create a bigger wave 3 on higher timeframes with a lot of fluctuation in between.

Bullish Crab on 4hr, 12hr, 1DBINANCE:BTCUSDT A fun way to potentially draw what could happen in the long term. Just for fun. Since the Gartely Failed, I am leaning toward a Bullish Crab very soon $1000 away. I believe there will be some sort of reaction on the 1.618. From there, not sure, maybe make a Bat to a Deep Crab all the way up to 30k. From there, not sure. Thanks

USDJPY is still on a Bullish TrendAfter the Friday Non-Farm Payroll move, lots of retail traders see USDJPY as a Bearish pair. But from what I see the Bullish Trend still stands.
I will wait for the retest of support in the looks of waiting for an opportunity to engage for a buying opportunity at 134.30.
Alternatively, I'm waiting for a buying opportunity at 134.06 on a Bullish Crab Pattern Formation. This shows how Bullish I am on this pair.

Perfect automated detection of Butterfly & DeepCrab PRZ - LongA bullish-type Butterfly pattern occurred.
If the price drops to 0.97606, a bullish-type DeepCrab pattern could occur.
Also on the daily chart, bullish-type Butterfly pattern is occurring.
Long after seeing the rebound.
*Harmonic patterns are automatically detected using the indicators below.
- Harmonic auto-detect PRO

EURGBP: BULLISH CONTINUATIONOn February 28th, the EURGBP currency pair exhibited a medium-term uptrend, resulting in a rise of approximately 140 pips. Subsequently, the market underwent a downward correction within a defined range, leading to an 80-pip decline. Recently, there was a breakout from the downward channel driven by a harmonic reversal pattern, which provided confirmation of the continuation of the medium-term bullish trend. This claim is further substantiated by the breach of the H1 resistance level.
Consequently, I anticipate that buyers will push prices strongly higher in the coming days towards the 0.89232 level. If the broken resistance level is retested or broken slightly to the downside, buyers will have the opportunity to accumulate positions at a much discounted price.

If you miss the Crab, read thisIf you missed the Bullish Crab Pattern on the 4-hourly chart(right), the Bullish Gartley Pattern could be the next best thing that could happen for you.
A retest to 0.9126 on the Bullish Gartley Pattern(left) could get you back on track.


CRAB BULLISH GPUSD has formed an advance harmonicas pattern (CRab bullish) on its hourly chart.
The price is trading near the EL: 1.20013.
Pattern invalidation 1.19120
ST: 1.19565
EL: 1.20013
Target:
38% AD: 1.21470
62% AD: 1.22627
79% AD: 1.23445

CRAB BULLISH EURUSD has formed an advance harmonics pattern on its hourly chart (Crab).
The price is trading above the Entry level EL: 1.07108.
ST: 1.06969
Targets1:
62% AD: 1.09286
79% AD: 1.09747
Target2:
127% AD: 1.11073
162% AD: 1.12012

AUDCHF COMPLETED BULLISH CRAB!!AUDCHF has completed bullish crab pattern.
This is a good trade opportunity to take.
Trade with care.
I will update at here if the trade opportunity is given.
Do follow and boost if you found this idea helps.

GBPNZD: SELL OPPORTUNITY !!GBPNZD is trying to complete the ABCD pattern and also potential bullish crab pattern.
Price broke the support level of 1.9057 and now going to retest.
This is a good trade opportunity to take.
Trade with care.
I will update at here if the trade opportunity is given.
Do follow and boost if you found this idea helps.

Perfect automated detection of Alternate Cypher & Crab PRZA bullish-type big Alternate Cypher pattern occurred.
If the price drops to 1.1889, a bullish-type Crab pattern could occur.
Long after seeing the rebound.
*Harmonic patterns are automatically detected using the indicators below.
- Harmonic auto-detect PRO

Conflicting trading ideasOn both Daily Chart and 4-Hourly chart, there is a Bullish confirmation from the Daily Chart Bullish Crab Pattern's with Wedge and RSI Divergence setup and 4-Hourly chart a potential Bullish Flag Pattern.
Personally I'm waiting for a counter-trend trading opportunity on the Bearish Shark Pattern 🦈 traded off at 97.95.
What's your trade plan for this pair?

BUTTERFLY BEARISHXAUUSD has formed an advance harmonics pattern on its hourly chart.
The price is trading near the EL: 1956.69.
ST: 1961.54
Targets:
38% AD: 1937.19
62% AD: 1923.31
79% AD: 1913.29
