5 ways to play the current macro environmentWhy We Rallied
It's been a strong few months for the S&P 500, which is up about 13% from the October lows. There were five reasons for the rally:
1) P/E ratios got attractive, especially for small-to-mid caps.
2) Inflation peaked, which historically has sometimes marked the bottom for stocks.
3) Global liquidity turned upward. Every major bond market was pricing a central bank pivot, and the big central banks (particularly Japan and China) added about $1 trillion to their balance sheets.
4) Economic data remained surprisingly strong, which raised hopes of a "soft landing."
5) Possibly there was a bit of forced buying due to a "short squeeze."
Why the Rally Is Probably Over
However, I believe we've now reached an inflection point where these tailwinds will turn into headwinds.
1) The S&P 500 and Russell 2000 P/E ratios are once again looking high (although S&P 400 and S&P 600 still look cheap). (See this report from Ed Yardeni.)
2) Inflation is no longer surprising to the downside. The last couple prints have been exactly in line with forecasts, and leading indicators of inflation have been creeping back up. See, for instance, this chart of service sector wages, this chart of copper prices, and this Goldman Sachs forecast of crude oil prices. This is partly because of the global liquidity boost and continued deficit spending , and it's partly because of China ending its Covid-zero policy and reopening its economy. (China is the largest importer of crude and the second-largest importer of liquified natural gas in the world.)
3) With inflation set to stay high, liquidity has tightened a lot. The market is no longer pricing a Fed pivot , and analysts suggest the central bank liquidity boost may be over . Stocks have now gotten significantly higher than liquidity measures would predict , which suggests they may need to come down a little.
4) Economic data are deteriorating. Leading indicators have been pointing toward recession for months , but consumer savings and a glut of job openings have helped delay it. We're definitely starting to see weakness, though. Credit card debt has soared to an all-time high , we're seeing more late payments , and the housing market is cooling off fast , with inventories of unused construction materials piling up . We've seen "soft landing" hype before: in 2000 and 2007 , just before those recessions hit. Unless the Fed pivots immediately, it's probably not "different this time."
5) The short squeeze is over for large cap tech, with most of the shorts already forced out.
Five Ideas for How to Reposition
How to trade a coming recession?
1) The obvious trade is long bonds, short stocks. Bond market valuations are very attractive relative to stocks, with bond yields only a little below the S&P 500's earnings yield, and bond markets having perhaps gotten too hawkish relative to policy rates. Given the historical correlation between 10-year yields and S&P 500 valuations, the gap that has opened between them may imply an opportunity for a statistical arb. Either stock valuations should drop or bond yields should rise. Historically, in a recessionary environment, the bond market has tended to recover first, and the stock market second. So now would be the time to long those bonds.
However , it should be noted that this recessionary environment is an unusual one in a lot of ways. Stocks have already sold off a lot, and valuations are pretty mixed. Bonds should perform well if we get a deflationary recession that allows to Fed to lower rates, but a stagflationary recession might force the Fed to keep rates high even as the economy stumbles. Thus, it may be worth getting a little more specific with our trade. Here are some other ideas:
2) Long investment-grade bonds, short high-yield bonds. If recession is coming, then high-yield spreads are probably way too low . It's possible that high-yield bond rates will rise even as investment-grade, Treasury, and policy rates fall.
3) Long high-quality small- and mid-caps, short low-quality large caps. In my opinion, large cap tech is still way too crowded. I wouldn't want to short Microsoft right now, given the success of Bing AI. But I'd be willing to take a swing at Amazon, Apple, and Netflix as long as I could balance the risk by longing some cheap, quality smalls and mids on the other side. In my opinion, the size factor is ripe for disruption. If you'd asked me two years ago, I would have said that AI would most benefit large cap tech. Now I think it will most benefit smalls. What changed between now and then is that AI went from being the exclusive domain of big companies to being publicly available at shockingly low cost. This happened way faster than I ever would have guessed, and you better believe that small, agile companies will capitalize on the opportunities provided by access to AI!
4) Long cash to buy the dip on energy stocks. Energy historically has struggled in a recession, so it's quite likely that energy stocks will see some downside soon. However, the current free cash flow yield on energy stocks is quite high , and the sector trades at 10x forward P/E . Meanwhile, investment in the sector is still much too low . I believe there will be a decade-long structural bull market in energy due to constrained supply, but that there will probably be some recessionary pain first. Meanwhile, money market funds offer a really high return on cash. My Fidelity money market is giving me almost 4%. Ain't nothing wrong with just collecting that money market rate and waiting for energy stocks to dip for the buy and hold.
With retail investor inflows at an all-time high , I believe the current market environment offers a good opportunity for savvy bears to execute some well-constructed long-short trades. If you look at how the smart money is positioned, it's pretty much the opposite of retail positioning here. There will be a time to get bullish on US large cap stocks, but we probably need to see some weakening of coincident economic indicators like employment first. (Stocks tend to do best when unemployment rates are high .) Remember, market positioning beats market timing, but ideally you could do a little of both!
Thanks for reading, and please share your ideas in the comments below!
Credit

CREDIT CARD STANDARDS TIGHTENING LIFE BLOOD OF THE CONSUMER ON FUMES The chart posted. Shows us that the banks are starting to tighten the lose money.

Credit card interest rates at a record highCredit card interest has gone vertical to a new record high . How long can they pay rates this high before defaults I will post banks credit card standards have gone up just as fast btw Tic TIC TIC BOOM

EWZ Short Put - $25 (Jan 20th)*EWZ trades in a range with support level at $25,5
*open -P $25 (Jan 20th) at bearish candle
*neutral
*Credit (0,77$)

AMZN - Short Put ($80) (Neutral/Bullish)NASDAQ:AMZN
Short Put $80 (30 DEC)
*High IV
*AMZN at downtrend, next support level at $86
Credit: $0,91

Silver is outperforming Apple as global trust declinesCommodities are hard assets and are trustless. The geo political climate has made commerce more difficult. Russia conflict, China supply issues, USA raising the cost of funding, the world is de-globalizing at the moment. Silver is tangible, credit is a promise that requires trust. As credit and trust are stalling temporarily, businesses will find it difficult to grow.

💡 SPX 0DTE Trading - Nov 28’22 4025/4030 Bear Call Spread💡 SPX 0DTE Trading - Nov 28’22 4025/4030 Bear Call Spread
Credit Received: $95
The equity net short positioning is gone, but we are far from a meaningful net long. Skew has caught a bid (put demand > call demand) lately as participants have closed out equity shorts. The increase in skew suggests people are switching into hedging the downside via puts, instead of running delta 1 shorts (short stock).
In other words, in the case of a negative catalyst participant hedging may pressure markets lower and would quickly bid implied volatility. There may be a grab for some protection in the AM as participants await new data on 11/30.
Ultimately we continue to view $4,000 as fair value due to balanced gamma (calls + puts) tied to that strike and this may invoke mean reversion activity today.
If I am wrong on direction and the market rallies in the AM, I will simply convert to a butterfly. $4025 is our upside pin forecast.

Credit Conditions and the Fed: Part 2In part 2 I take a quick look at high yield corporates and describe a common mistake made in using ETF ratios to monitor changes in credit risk. Part one and an earlier piece that described how to use the TradingView platform to monitor secondary market credit spreads are linked below.
If there is any one thing that will produce a Fed policy a pivot, it is credit distress. Credit is far more vital to economic functionality than equity. If companies are unable to secure funding, they may face liquidity issues, and if liquidity problems become widespread, they have the potential to become systemic. In 2008 and again in 2020 credit markets were frozen. Particularly in 2008, many companies ran into barriers that inhibited their conducting their ongoing daily business lines. There were plenty of offers but, as I so painfully remember, in many cases zero bids…. None…at any price. It was this credit distress that convinced the Fed to move.
In part 1 we looked at the weekly chart of the option adjusted spread (OAS) of the broad ICE BofA Corporate Index and concluded that the there is no evidence of the kind of credit distress that would galvanize the Fed, and that, at least on this basis, that there was no compelling value (rich/cheap) argument to be made.
What of high yield? Does high yield OAS suggest a meaningful deterioration in credit markets? Again, I plot a regression mean and one and two standard deviation bands above and below. Just as in the IG market, high yield OAS has widened, but only to its long term mean, and this following a lengthy period of being nearly a standard deviation rich. In short, while spreads have widened somewhat, there is no compelling rich/cheap argument and certainly nothing that would suggest to the Fed that credit conditions are meaningfully impaired.
I frequently see commentaries that use price changes in the high yield ETF (HYG) and the investment grade ETF (LQD) as a measure of investor risk preference. Since the January high, LQD is down 26.15% versus 19.65% for high yield. At first glance it appears as if investors prefer the lower quality HYG. But the price changes do not account for the differences in fund duration. Put simply, LQD at 8.36 years duration has roughly twice the interest sensitivity of HYG at 4.06 years. In other words, a 100 bps change in rate, will change LQD 8.36% and HYG 4.06%.
LQD in Ratio with HYG and Ten Year Futures in Ratio to Five Year Futures: I also see analysis that uses the ratio between LQD and HYG to ascertain risk preference. But the direction of the ratio is almost completely due to the difference in duration. You can see this by compare LQD/HYG to the ratio between ten year and five year note futures. LQD/HYG ratio is almost entirely correlated with changes between five and ten year treasuries. When rates are volatile and directional the total return of many rate products generally a reflection of rates than it is investor quality preference.
And finally, many of the topics and techniques discussed in this post are part of the CMT Associations Chartered Market Technician’s curriculum.
Good Trading:
Stewart Taylor, CMT
Chartered Market Technician
Taylor Financial Communications
Shared content and posted charts are intended to be used for informational and educational purposes only. The CMT Association does not offer, and this information shall not be understood or construed as, financial advice or investment recommendations. The information provided is not a substitute for advice from an investment professional. The CMT Association does not accept liability for any financial loss or damage our audience may incur.

XELA How To Read The Chart When A Company is Diluting...Use McapXELA is in a descending wedge looking for trade. The company keeps diluting so the chart is difficult to grasp therefore using mcap instead of price.

A Minsky Moment is ComingThe economy has been going into the toilet for a while now. All the NBER coincident indicators are trending down to 0% growth. Some leading macro indicators have actually flashed negative. Housing volume is crushed, the treasury has started pricing in recessionary conditions while the credit market has been twiddling their thumbs expecting a soft landing (even bitcoin foolishly climbed to 25k on distorted hope, and some think that's going to happen again because of Elliot Waves and Fibonacci, the prophets of TradingView). But that is now changing, with the biggest drop still to come, and lessons will be taught all around.
We will probably have mass layoffs in Q4, based on the condition of deteriorating employment. The non-farm payroll survey, which does not survey households, is still downtrending in spite of double or even triple counting people holding two or three jobs as two or three employed. Household survey is dropping. People are starting to work less hours, which means there is trouble ahead for employment and the soft landing narrative.
We are still waiting for that turning point where the credit market and broad economy realizes a recession is unavoidable. And now, over the weekend, retail finally gets a headline it can work with: Bed Bath and Beyond CEO jumps to his death. I'm not going to short this index, its still too risky and I will keep my existing crypto shorts while rolling over everything else into USD and TLT; but I can see why one would short it. Things are rapidly coming to their crescendo, and the credit market will resume pricing in reality soon, if not on Tuesday.
2022: SPY woke up after labor day, wearing white, and chose violence.
Happy trading, fart knockers.

COMPOSITE INDEX Electric Vehicle Stocks TRENDING BEARISH In this daily chart, I made a composite index of electric vehicle stocks using
an approximate formula weighed by stock prices but not market cap.
( ( $NIO + $LCID + $RIDE + $NKLA +$WKHS) x 50 ) + $TSLA
This serves as an approximate normalization adjustment of the varying
stock prices in the collection of stocks.
I did this to later check to see if there is any effect of new legislation
impacting federal tax credits for electric vehicle adoption as a catalyst
for price action.
So far YTD, the composite at large has fallen 18.5% varying from
TSLA is down 6% and LCID as an example of others is down 36%
The composite will be a quick and easy way to see if the composite
and so the market cap of the underlying stocks inflects its downtrend
responsive to the federal legislation catalyst.

Consumer Credit - The Impending CollpaseConsumers are spent.
Mean
Median
Spent
_______________________
Observe CC closely as it is a leading Economic Indicator.

IWM 184/179 Mar 4th Put SpreadTrade entered today based on my thinking that
1. This is our second green bar in a row, and I believe that either we have found a new range in the 190-200 range or we are headed back up. Which leads me to point number two
2. If we are in fact in a range then the 184 short strike is outside of that range and then some, providing a decent margin of error.
184 was also the 16 delta short strike at the time, and met the return metrics for the trade (10% return on margin required - AKA Max loss). The plan will remain with these trades to close at -200% or take profit at +50%.
Fill on these was -0.57 on average after commissions.
That is it, mechanical and S/R based. Sorry there isnt more secret sauce!

A Chart Demonstrating How FED Policy Causes VolatilityDuring a discussion with a contact, I pointed out that watching the FED is one of the easy ways to forecast volatility.
Being specific here, FED policy on interest rates is a key predictor of market volatility.
To summarise, Federal Reserve interest rates induce tightening at institutions. This in turn causes credit crunches out in the real markets as institutions begin to tighten standards.
When this feeds through into the consumer level, this causes volatility n the real markets and hence we see peaks of the market-based components of credit conditions (I.e. the institutional banks and companies) coinciding very neatly with the VIX.
There are many reasons for this.
Firstly, tight credit conditions mean less margin is available.
This should be self-explanatory.
Secondly, it means that ultimately consumers are not able to consume on the level that they previously did and this of course hits institutions in their balance sheets.
As a third-order consequence, it can often mean that it becomes difficult to roll debt and service debt and this can sometimes force the selling of assets to meet short-term cashflow requirements.
A lot of the time, this means selling bonds and equities.
We can see that when the FED begins tightening, the market-based institutions begin tightening a few months to a couple of years later.
The FED's interest rates therefore clearly front-run interest rates and credit conditions out in the real world.
And thus, because these credit conditions are correlated to the VIX, the FED's activity is a clear predictor of big spikes in the VIX (As well as potential downside in the vix).

Azimut (AZM.mi) bearish scenario:The technical figure Triangle can be found in the Italian company Azimut Holding (AZM.mi) at daily chart. Azimut Holding is an Italian asset management company, based in Milan, Italy, with branches in Australia, Brazil, Chile, China, Egypt, Ireland, Luxembourg, Mexico, Monaco, Singapore, Switzerland, Taiwan, Turkey, United Arab Emirates and the United States. Traded on the Borsa Italiana, the company is specialized in investment management aimed at private and institutional clients. The Triangle has broken through the support line on 26/01/2022, if the price holds below this level you can have a possible bearish price movement with a forecast for the next 44 days towards 21.500 EUR. Your stop loss order according to experts should be placed at 26.73 EUR if you decide to enter this position.
Italian asset manager Azimut Holding said its U.S. subsidiary had struck a deal to buy a minority stake in U.S. private credit investment manager Pathlight Capital. Under the deal, Azimut Alternative Capital Partners (ACCP) will buy a stake of around 20% in Pathlight and contribute “permanent capital to the business going forward”, the companies said in a joint statement, adding there would be no changes to Pathlight’s strategy or management as a result of the agreement.
Risk Disclosure: Trading Foreign Exchange (Forex) and Contracts of Difference (CFD's) carries a high level of risk. By registering and signing up, any client affirms their understanding of their own personal accountability for all transactions performed within their account and recognizes the risks associated with trading on such markets and on such sites. Furthermore, one understands that the company carries zero influence over transactions, markets, and trading signals, therefore, cannot be held liable nor guarantee any profits or losses.

IWM 195/190 Put Credit SpreadSimple trade idea here. 1 month out, >10% RoM (Return on Margin) This one was filled at 0.55 credit, allowing for commissions on the way out to be covered and keep the 10% return.
I did not love that this was moving downwards still, but we are near the bottom of the range and this trade gives us 8% or so of room. Management rules will still apply. close at 50% profit, or -200% of credit received.

IWM Put Credit Spread (see related) into a ICIWM continued to fall today, so I decided to look on the call side to turn this into an Iron Condor.
Why?
1. Condors do not increase margin over a spread
2. IWM has been range bound
3. Large cushion past 2 resistance points
4. Additional Credit recieved
Opened Feb 2nd 236/238 IC for a 0.22 cent credit.

Affirm ~ AFRMCan see afrm possbily getting a push towards 88 R
above 84 , 88 follows . 95 - 104 resistance lvls follow above, likely these are just dead cat bounces and this will continue to fall.

Upstart ~ UPSTUpstart is right at our dip buying opportunity -- I'd buy with your stop loss at 191. Target is 270-310!!!!
If this falls down even more than the 190 lvl we're looking at 173..
-- If we break 170 area then we go to the 130 support next.

Potential Opportunity - Patience PaysPreviously I wrote a brief note explaining caution for the US Banking industry as illustrated by XLF.
This is due to:
- market risk of a broader market pullback - as currently being experienced
- impact from Covid-19 variants like Delta etc.,
- the cumulation of record high bank reserves (cash) which serve to stress Bank Capital and Capital adequacy ratios. These reserves have been building up due to the FED's policy of buying Bonds in the market. Once sold, the vendor banks cash at a Bank which severs to increase the Bank's liabilities. The FED has tried to mitigate this effect by using reverse repos - which is ridiculous - it should stop the buying / QE ie the naughty word - Taper!!! :)
The opportunity to be long includes:
- market risk subsides as debt ceiling is mitigated.
- infrastructure bill goes through which is GDP positive.
- further recovering of the US and European economies noting n increased travel facilitated by increased vaccination rates.
- Bank capital being strong as it is, has seen some Banks start to sell assets which have a lower capital rating (for the purposes of capital measurement) and will eventually open the door to strong lending programmes noting the prior comment.
- still good fiscal support - so economy, GDP and the broader market is growing.
In other words a decent credit cycle may ensue which will be very positive for Banks and of course XLF.
However - Patience Pays!!!
Buying in smalls around key support areas and build a position - no 'binary' trading.

Sold $SPX put verticalRelatively speaking, $SPX is till kind of weak, but I'm slightly bullish towards the end of Thursday. I sold Sept. 15th $4435/$4440 put vertical for $1.1 credit.

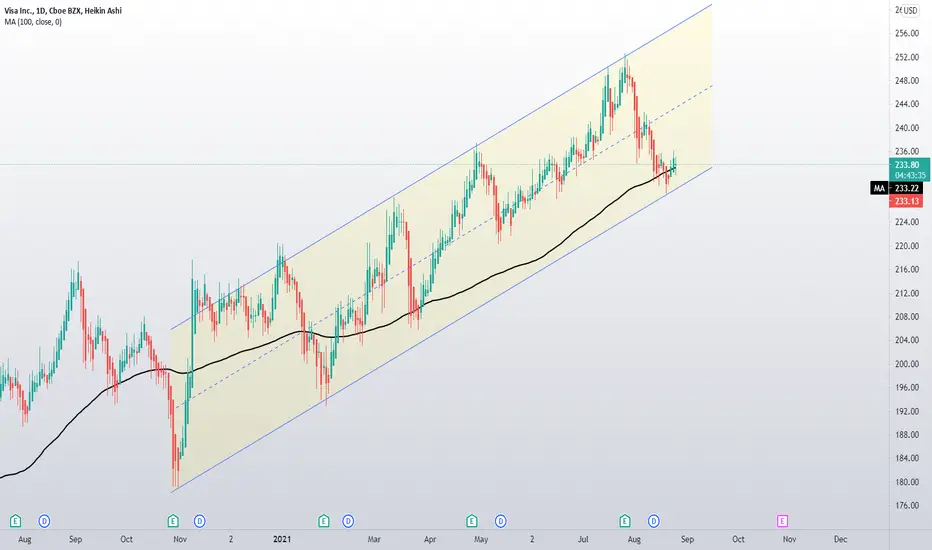
$V Trading the ChannelRemoving some indicators to eliminate some noise.
Break out of channel invalidates trade, looking for a move to middle of channel
Entered 10/15 240 Call and 230/225P bull credit spread
Simple Credit Indicator to Watch Out for Equity InvestorThere is a classic saying that credit markets tend to lead equity markets.
The rationale is that credit investors are solely more concerned about downside risk (as they worry whether coupons will be paid and whether they will get their principal back at maturity) and measure risks and determine spreads - over the risk free/benchmark rate - by factoring in the probability of default into the spreads amongst other factors.
While equity investors, given their ability to participate on the upside as opposed to debt/credit investor, tend to be more forward looking with an optimistic bias (glass half full attitude).
Hence, credit tends to turn first when risk is slowly bubbling in the cauldron. That's what I've been told anyway.
Without further ado, if you refer to the chart published, you will be able to see how credit has played out during the past few crisis. Data used are S&P500 and ICE BofA US High Yield Index Option-Adjusted Spread (inverted)
