Bitcoin: Multiple time frame analysisWhat is your favorite time frame? When you finally decide on your preferred time frame, that’s when the fun begins!
SHORT-TERM (SWING)
PERSPECTIVE: "Earning assets with trades. Looking to sell near the top to buy near the bottom.".
Short-term traders use hourly time frames and hold trades for several hours to a week.
ADVANTAGE: More opportunities for trades. Less chance of losing months.
DIFFICULT: HARD - The smaller the time frame, the greater the difficulty. Study the market daily and be prepared for the worst.
MEDIUM-TERM
Mix of shorts and longs. It's my favorite.
LONG-TERM
Trades usually from a few weeks to many months, sometimes years.
PERSPECTIVE: "Buy and to forget and when it falls, buy more."
ADVANTAGE: Don’t have to watch the markets intraday.Fewer transactions mean fewer times to pay the spread. More time to think through each trade.
DIFFICULT: EASY - With cash in reserve to take advantage of opportunities, it's easy.
Criptocurrency

Bitcoin is going down, but until where?Here, in the daily chart we have a big SHS and small descending triangle, and the major probability is btc lose that 29k level and achievement new suports, so, i see that big opportunity to gain big profits, on the similar inverse pump move in the past. I see supports at 20,22k , 16k , 10k. Lets watch what goint happening next...I shorted.
I beliave, any altcoin gonna make multiples profits in at short position, folowing the btc move.
Today we are testing the break line of the descending triangle at a probably pullback but Any analysis can be change at the action of the price action, the stop point is the break of descending triangle resistence.
Any action with your own capital, is own your enterely responsability.

Bitcoin 2021: Bears prepare to break support.28k is no longer as big a psychological barrier as it used to be. Gradually, the bears are gaining ground. The ascent at this point occurs without significant volume in a figure called the "descending triangle". The result you already know...


short term ETH outlook.-SHORT-short term outlook the identified head and shoulders structutre is being broken, can go up for retest and then continue the dump,
also wach btc moving lower for confirmation
monrhly is red
weekly is red
dayly is red
if 2.000 usd is broken can be at 1675ish in this week before friday

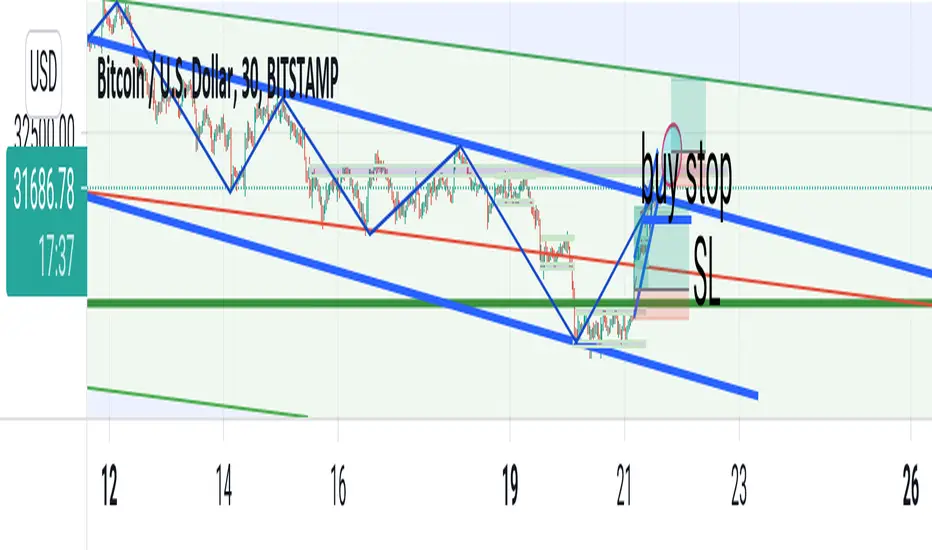
now i want to buy.i will close sell positions.walls are buying👌👍(bybt:a site)i will buy 33% of my money.(buy 32500)(120000dollars) lets buy the dip.i checked1. hash ribbons
2.funding rate3.btc poul4.check the related ideas.


XRPUSD: Bullish Continuation & Long Signal
XRPUSD
- Classic bullish pattern
- Our team expects growth
SUGGESTED TRADE:
Swing Trade
Long XRPUSD
Entry Point - 0.66006
Stop - 0.61734
Take - 0.72406
Our Risk - 1%
Please, leave a comment and support us with like.
❤️ Please, support our work with like & comment! ❤️

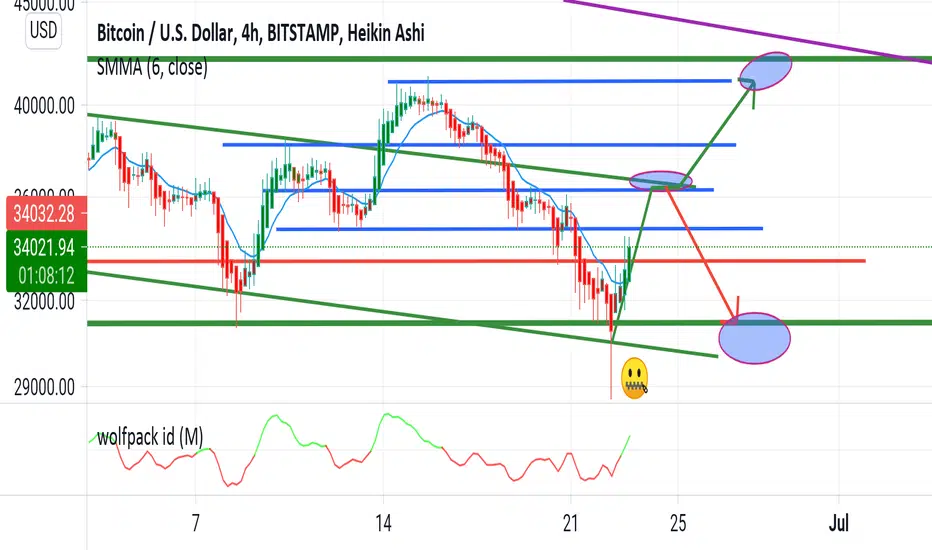
Possible higher low for BTCPossible reversal in the short term may get us to the higher low that we need
MACD weaker, 5 waves in 1h timeframe and break of the trendline are the factors leading me to think about the reversal


buy signal by wolfpack and smoothed moving average.buy signal.blue areas are important.see related ideas
Mana, another buy opportunity It is touching a strong support level around its 250 period EMA (daily candle), there is a great probability of a reaction, at least to push the price to $0.8.


2 bullish scenarios for BTC2 fib trend based scenarios for btc assuming we are finishing the 3rd wave now. I expect a correction at this timeframe after the 5th is finished

20000_30000.rsi should touch 24😆.30000dollar this weekend.like please.see related ideas than you will follow me🤗see wolf strategy(how a wolf see the chart).

we gained 20%in the green area🐺🥳short and long position.if you gained 50% you are wolf of wallstreet👌.i gained 20%and thats enough for me.how much you gained?


BTCUSDT Price Analysis (4h)The price is placed in a triangle pattern and if it crosses the triangle and the marked yellow lines, it becomes a position long or short .The triangle pattern is a corrective pattern and the reason for its formation is the existence of ambiguity in the market and sometimes it can move in the opposite direction of the previous trend. So we wait for the triangle pattern to break. (Horizontal white lines are drawn based on Price Action and we can wait for the price reaction to them) . BINANCE:BTCUSDT


buy signal after 17 days🥳very good news on 24hour time fraim.lets start bull market.last two week was piggy market and bear market.now i have 280000dollar .i closed all my short position.lets buy👍😎.i still say 1bitcoin should be25000dollar but not this week 😀 maybe next month.
