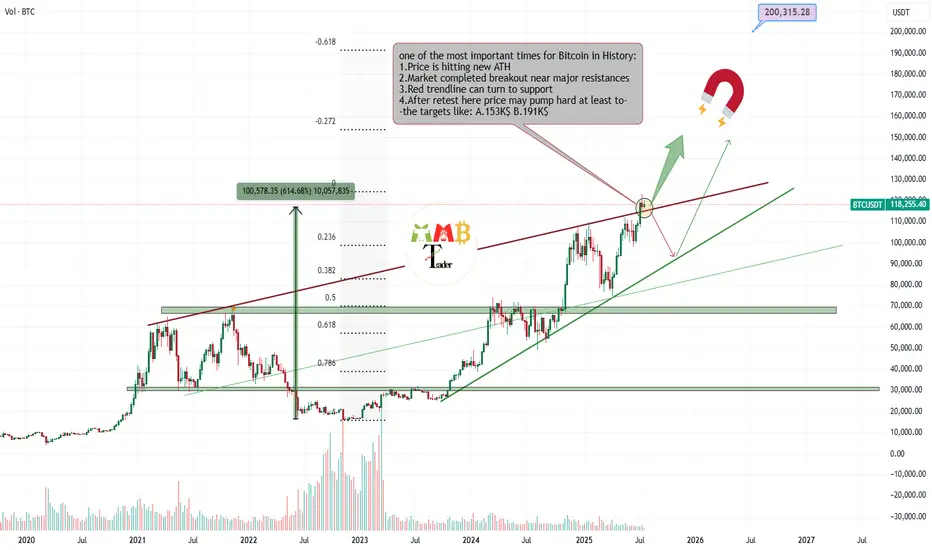
Bitcoin is retesting Critical zone for targeting almost 200K$Most traders around world now don't know what to do with their own trades or spot holdings, because some are in profit and how doubt of more pump and are still holding and some others miss this massive pump and think it can rest and fall now and it is not a good time to enter long.
And many other questions and thoughts At this time is simply check the chart and do these simple steps which are some mentioned and some not due to huge content.
Delete all of my previous drawings and start new Charting the price and see new trendlines or supports and resistances formed.
Then technically check the volume and breakouts and ... once again and here for Bitcoin i still find out chart looks extremely bullish to me and at this orange zone which is price is getting a little slow some important things may happen.
30% is expecting price fall below red trendline again and see short-term fall.
70% is expecting price complete retest of breakout here or pump more ASAP and then hitting targes like 150K$ and more for $BTCUSDT.
DISCLAIMER: ((trade based on your own decision))
<<press like👍 if you enjoy💚
Criticalzone
Alt coin bullish Alligator pattern wishful thinking predictionUnseasoned investor and inexperienced charter's 'wishful thinking' alt coin bullish alligator pattern price prediction with doodle. I watched an Alex Becker video and didn't notice why he kept saying alligators was his favorite animal in a joke multiple times. I didn't think anything of it at first, but later on a different day I was attempting to look at the charts and do some 'technical analysis' I googled some different chart patterns that may looked similar to the chart I was looking at. That is when I came across the alligator pattern. I started to think that was why Alex kept saying it over in that joke he made on that 1 video. Now idk if they will release m-pox and start war for mail in votes and for money, or if the economy will crash and then we will go into depression, because I still haven't learned how to research and what data to research to 100% know that answer, and I know that could also just be an okie doke from Alex Becker doing that to intentionally still throw ppl who reading between the lines as a joke, but from a few charts I looking at is pointing towards that 'banana zone' phase for alts. If you are an experienced investor, chartist, and macro understanding, then you may see something totally different and see a bearish depression ahead. If so, feel free to inform me kick some knowledge

Critical Resistance Reached, Trend Change or Short Play? INFAHi guys! This is a Technical Analysis on this relatively new company Informatica, Inc. (INFA). But the focus is not the company but rather on finding these specific trends in price action.
This analysis is done on the 1 Week timeframe.
Main takeaway is that its powerful to be able to identify when Price action reaches a Major Resistance or Support level. It can make for taking short or long positions.
Notice how INFA is in this Downward Channel.
We've had some touch points on the Support trendline in black.
With every touch, we've had Uptrends.
With our most recent touch of Support, we've had an Uptrend that brought us to our Resistance trendline in RED.
Note, this recent uptrend has created a Higher high from a previous lower higher. Good sign for trend change attempt.
We have also printed our 1st Golden Cross between the 21 EMA(Purple) and the 50 SMA (Green).
This is a powerful bullish sign, even more so that it has happened on the 1 Week. This can provide necessary momentum to break out.
Our current Price action is in a crucial zone. We are attempting to breakout of this Major Resistance trendline.
If we can break through and CONFIRM, it may indicate a Trend Change.
However, do note that this is our 2nd time directly touching this trendline. Trendline theory states it requires atleast 3 touches for that trendline to break. This being a powerful Resistance area, It is important to also look for signs of Rejection.
One sign currently is the presence of Upper Wicks of candles. This shows sell pressure off this trendline.
A Clear sign of rejection would then make this area a solid spot to take short positions.
Target being the Support line below us which coincides with the previous Lower Higher or the 21 EMA.
Now going back to if we can breakout ABOVE the Major Resistance Red Line and Confirm. Our target would be the Horizontal Resistance line Above us.
In my opinion if we can break through the horizontal resistance line. Reaching all time highs becomes very likely. As we dont have much Market Structure above.
One sign to assess if we breakout is VOLUME to increase or spike. That would show signs of increased liquidity which is what we need when trying to trend change. If we breakout with Low Volume, it may lead to a FAKEOUT.
If we reach ABOVE Major Resistance and CONFIRM, this would make for an area for Long positions especially Longer Term Positions/ Investment. This would also signify a Trend Change.
Look to the 1 Day for further signs of whats to come. I will be sure to update as well.
__________________________________________________________________________________
Thank you for taking the time to read my analysis. Hope it helped keep you informed. Please do support my ideas by boosting, following me and commenting. Thanks again.
Stay tuned for more updates on INFA in the near future.
If you have any questions, do reach out. Thank you again.
DISCLAIMER: This is not financial advice, i am not a financial advisor. The thoughts expressed in the posts are my opinion and for educational purposes. Do not use my ideas for the basis of your trading strategy, make sure to work out your own strategy and when trading always spend majority of your time on risk management strategy.

BTC fall The critical 20k area for BTC is now converted to stiff resistance. We'll see if it drops again to lower amounts and at least 19K
let's see


btcusdt
The price is in the last third wave of the ABC Zigzag correction
ABC zigzag correction is the latest wave of wxy correction expansion
The fourth wave will probably end with the wxy correction wave pattern on the 23800 demand range.
When the fourth correction is complete,
The fifth (impulsive) wave is waiting for the market

BTC hangoverBTC hangover mode activated
this is what I think is most possible
that's not a financial advice
look at my last idea link. if BTC loose that area we will see 19.5-21 K

LUNA - Moment of truth!!Luna and the crypto market is at a possible turn point to go higher or to give up some more.
We are just completing a Gartley Buy pattern @ 47.15. If it doesnt hold this level then we could see it drop to 34.00 where there are major ABCD patterns and FIB levels.
We do have the 61.8% level from the May 2021 low but more likely to head lower if the current level breaks.
The whole market is at a critical level the next couple of days are going to be interesting.
I hope this helps, Enjoy the weekend.

$BTC BTC/USDT - The calm before the storm...Bitcoin keeps grinding up that trendline, that was created in beginning-mid october, but obviuosly is losing some steam.
We had about a 10% pullback from the top lately and now it could seem, as bitcoin is starting to form some kind of bottom right at striking distance to the old ATH at around 65k .
This is clearly some kind of accumulation phase going on, the on chain data back up that theory too, since more and more Bitcoin are put into cold wallets, what shrinks the overall Bitcoin supply that's there to trade.
The 4h chart in Bitcoin and Ethereum is showing bullish divergence , what kept being respected over and over, will it be respected again?
Then next target is 75k in BTC , but there's also a chance the market wants to see BTC at 60k again, to load up even more Bitcoin .
Seasonality wise we head into the strongest months to own crypto, what makes me think bullish into the end of the year, a break below 57k at this point though, would be a problem, but till then we're in a bullish accumulation phase before we could see much higher highs in crypto at the end of '21/beginning of '22

BTC must break out now!!! If BTC doesnt break this level, we could see a 18-22% correction. If we do break this level we will break ATH.

BTC Critical Zone 10/06/2021 Testing Idea ChartBTC chilling around critical zone. So many support and resistance lines. Let"s see what's gonna happen 👀

BITCOIN - Show Us What You Got!Hello everyone, rouzwelt here
well If have been my following posts lately, you know that I've been talking a lot about a potential local uprise and a break-out above the down-trend line (blue down-sloping line) and I've been pointing out the possible projection of this scenario happening, as you can see in the screenshot of my last post about BTC (picture below - full article link at bottom of the page " Wyckoff Redistribution Update") Candles actually printed with good accuracy compared to my projection and I have posted a scalping trade based on this idea, I personally took it and my entry was at 34700 USDT, I hope that you have followed this idea and entered a long position along with me but if you've not, let me say that there might still be a chance for that as I'll be explaining later on.
Right now price is entering a local resistance area of 36.5/37.5K (first gray box on the chart), It's a critical level for BTC at this stage if we want to see higher levels. We have not got a retest of the down-trend line (blue down-sloping line) yet, but that might come with a good probability, if it happens and manages to hold the support around that area that would be good entry point for those of you that didn't open any positions, and for me personally I'll be increasing my position in that case (likely price action projection NO.1 - green arrow).
But a retest might not happen and we may rise up from here without one, although that is not the best scenario for a sustainable uprise but if we somehow see BTC starts to build some support near the 36.5/37.5K area and spend some time around there and also manages to hold the up-trend line (purple up-sloping line) then that may actually be a good indication of upper levels. (likely price action projection NO.2 - green arrow)
But if we see a breakdown of the up-trend line (purple up-sloping line) followed by failed retest of the main down-trend line (blue down-sloping line) we would see the bearish scenario playing out which will be the case when we start to see a momentum shift and increase of volume at rally down and decrease of it at reactions.
Right now we see increase of volume at rallies up and decrease of volume at reactions which is a good indication of more buyers are willing to step in and increasing demand. this needs to be sustainable.
My Stop-Loss is still at the last swing low, right at the break-down of the blue down-trend line, but I'm going to move that to entry as soon as price starts its next rally up or a successful retest.
That's all for today, I hope it'll be helpful and like always have fun and trade safe.

Ethereum's make it or break it!Whilst Bitcoin has shown clear technical signs of a bullish reversal (see earlier posts) and a C-phase of a Wyckoff accumulation, Ethereum is at a make it or break it point.
Just like Bitcoin will be inherently bearish should it break below $30 000, Ethereum so far shows strength after having wicked on the diagonal primary trend line on the weekly. This area neatly coincided with the 618 fib.
IF, however, Ethereum were to break these levels of support, things can turn sour and they can turn sour FAST!
As we can see, Ethereum recently made an upper bearish blue RSI closing (for more on this, please watch the RSI trilogy on YT). The last time this happened was in February 2018 (see blue arrow) after which Ethereum proceeded to lose no less than -90% of its value over the upcoming ten months.
Bitcoin and Ethereum both stand at an important cross roads. And as technical analysis is all based on probabilities and in identifying key areas of importance, as long as Bitcoin holds up its $30k support and Ethereum can defend the zone on the picture things do look good.
On a final note, when things look good technically but feel bad emotionally, you're usually on the right track. That's why it usually feels great to buy at the peak and sell at the bottom. Adhering to the opposite whenever the technicals speak in favour for the bulls and vice versa is the winning path to go.

🔥 Bitcoin is on Contracting Triangle 🔥 (Road map)🧐First, I have to say sorry for the busy chart (BTCUSDT) , but my chart needed these lines . Please spend a few minutes on it.🙏
Location : BTC is on Corrective Structure ( Zig zag 5-3-5 ) for about 51 days (From 64795$ until LIVE price) and I think that this correction will take more time from us (maybe 2 months , just prediction ).
My idea : still, BTC is on microwave 4 of Main wave C . as you know, one of the shapes of wave 4 is a triangle . I was able to find the 3 main points of the triangle A-B-C ( Contracting Triangle ). Point C has found with Bearish Gartley Harmonic Pattern + 78.6% Fibonacci (Point A ) until ( Point B ).
For finding Point D , we have to concentrate on correcting microwaves (a-b-c) that are on the way to point D, I was able to find Bullish Crab Harmonic Pattern on the end of microwave a. microwave b can be around 37040$ or 37960$ .
I think that Point D can be around 35698$ == 61.8% Fibonacci ( Point B ) until ( Point C ).
I have three Scenario :
Scenario 1 : when the price arrives to Point D , it can break the lower line of our triangle , and then the price starts to go down, so the end of microwave 4 of Main wave C was at Point C + microwave 5 of Main wave C has started.
Scenario 2 : when the price arrives to Point D , then the price goes up until Point E . Point E can be a Critical Point for us (It is the end of microwave 4 of Main wave C ), better, I had to say that market will decide to go UP or DOWN ( UP will make my Scenario 3 // DOWN will make my Scenario 2 ). If the price goes DOWN at Point E , we can say that microwave 5 of Main wave C has started.
Scenario 3 : when the price arrives to Point D , then the price goes up until Point E . Point E can be a Critical Point for us(It is the end of microwave 4 of Main wave C ), better, I had to say that market will decide to go UP or DOWN ( UP will make my Scenario 3 // DOWN will make my Scenario 2 ). If the price goes UP at Point E , we can say that BTC will go UP by 5 new impulsive waves .
My Suggestion : please do not buy Coins for Midterm and Long-term investment until the market finds a way.
Do not forget to put Stop loss for your positions (For every position you want to open)
Please follow your strategy , this is just my idea, and I will be glad to see your ideas on this post.
Please do not forget the 'like' button :) & Share it with your friends, Thanks, and Trade safe.
Good luck

PTON at Crucial Support Level Ahead of Earnings!A week ago, I posted a short idea on PTON with the Head and Shoulders pattern as my reasoning. That idea is still active, but I will be looking to this week's upcoming earnings call for confirmation of the pattern. The neckline of the pattern (~$95) is a critical support level and the earnings call will ultimately choose the direction in which the stock will proceed for the upcoming month(s). As of right now, the earnings call could go either way, but I am leaning more towards PTON falling short of expectations. If the earnings call is able to pull the price down below the neckline, then I will most likely open a short position on the stock. If the earnings call pushes the price above the right shoulder's peak, then I may or may not be looking to enter a long position. My decision on the long position will depend on how well PTON is able to resolve the issues that have risen around the country involving their treadmills.
I will update this idea with my position on this idea and stock after the earnings call on May 6, 2021 after-hours.

#BTCusdt #Bitcoin ((Critical analysis))This is how can u imagine about #BTCusdt BITBAY:BTCUSDT prediction...
We have been waiting for following actions on BTC price chart.
Let see what's going on till 2-1 day later...
I think two area are more important to Buy:
$47.900
$42.500 - $44.000
Share ur idea if u like...
(( critical analysis over Bitcoin ))

Possible break out of channel for ARWEAVE, but maybe too soon...ARWEAVE has been trading on an upward channel, awaiting a breakthrough..... It seems too have crossed the line, but it doesn't have much momentum to carry it downward. Stochastics indicate a possible buy while the Elliot Wave Oscillator indicates a possible downward trend.... I guess I'll let you decide. Maybe you should GO BOTH WAYS, if you can handle it. I know I couldn't....

GRT Critical zone: about to go crazy either for good or for bad
I've been doing TA for months before sharing my first idea so I believe I've a tiny bit of knowledge to share. Anyway take this information with a pinch of salt and do your own research.
Long scenario: We can see a falling wedge pattern about to breakout in the daily chart. For this to happen we need to keep the $1.3 support so I would put a stop loss at around $1.17.
Short scenario: If we lose this support we can expect a breakdown to $0.80 (-38%). The 50 period daily EMA suggest that we could continue going down, specially if the support breaks.
Entry for long:
March 26th we saw a good retest of this support although with a good volume. We can enter the trade right now that the support has been retested and there is a good buy volume accumulated since February 7th if we compare it to the sell volume.
We can see that March 9th and 20th the buy volume crossed the volume average which suggest a breakout is about to come.
The other option would be to wait a retest of a breakout of the wedge, wich is safer but with a lower RR ratio.
Onchain metrics:
As we can see in coinmarketcap's analysis tab (intotheblock website) (sorry I don't have enough reputation to post links) whales have the 96% of the total GRT which supports my accumulation of volume theory and the GRT network is growing nicely (4.27%). Other indicators are not-so good but overall the onchain metrics suggest that GRT is mostly bullish.
Exit for long:
The first take profit zone would be at around $1.9 and the final target would be at $2.38.
Disclaimer: This is not financial advice. The above references an opinion and is for information purposes only. It is not intended to be investment advice. Seek a licensed professional for investment advice and invest at your own risk.
BINANCE:GRTUSDT

DXY Break Above Key Level!The DXY, or the dollar index, is inversely correlated with the markets (in this case). Overnight we saw a break of a critical Fib resistance level, so unless the Fed steps in and implements Yield Curve Control or a similar market positive policy, expect the dollar to move up to the next resistance level.

The Time is HERE! **CRITICAL ZONE**This is a follow up on a previous post on the ascending channel on the daily chart. Taking a few more steps back looking at the weekly chart there are few indicators that are flashing *ALERT*
Waddah Attar - The green candle has fallen below the Explosion Level (Yellow Line). Should the next candle stay below the Explosion Level this would be a conventional sell signal from this indicator.
VPVR - Price action is teetering on this heavy volume support line. Should price action slip it could be a slippery slope to .34 or lower.
MacD - Upward pressure is continuing to weaken
We are coming up to a critical meeting of price level and lower trendline of the ascending channel I mentioned in my last post. I have also circled the number of touches of each trendline upper and lower. Price has touched 3 times on the upper and now 4 times on the lower. XLM is ready to blow. I have heard sentiment of XLM is a stablecoin and will never moon, but I disagree. I believe this next move to be explosive. Technical analysis of the breakout would tell us that the move will be the height of the channel itself putting us at the bottom end around .20 and at the high end around .94 maybe even a dollar with continuation. One thing I did not mention is the RSI. RSI is still screaming overbought (sell) on the weekly, but the level at this moment in time has leveled out from the earlier decline.
In summary, this thing is primed and ready to blow. Get a plan together for yourself and trade wisely!
I am not a professional trader by any means. All comments are greatly appreciated. Let me know what you think below.

A Ripple in the ChannelBINANCE:XRPUSD - 1D
I've been pretty shocked XRP has had the rebound its seen. The fact that the SEC can take Ripple to court speaks volumes to its true essence, nonetheless it has always been a black sheep yet maintained a top 5 position for years.
XRP is currently in a downtrend since Nov 24, which is marked by the yellow channel lines. The dashed purple line was a long time resistance on hourly charts, that flipped to strong support. The coming battle at $.25 is going to be make or break. If $.25 fails as support and turns into resistance again, XRP could drop below a dime by mid-February. Given that XRP was just restricted from trading on Kraken, prospects aren't looking great.
Conversely, if $.25 holds as support, then it'll setup a battle with the trading channel somewhere above $.30. If that fails, another retest of $.25 would presumably follow.
These are just my thoughts on the chart as I interpret it, none of this is investment advice and trading cryptocurrency is high risk.

NZDCHF: BUY the dips - High probability trade ideaAs you can see NZDCHF is at a very critical area which is support now, after the breakout of the ascending channel.
RISK MANAGEMENT:
At 1:1 take parochial profits (1/3)
At 1:2 take another 1/3 parochial.
If the target breaks the previous high,
extend your take profit target.
If the market struggles at 1:2 close the trade.

NAKED ANALYSIS BASED ON CANDLESTICKS FORMATIONNAKED ANALYSIS - 1:1 TRADE IDEA
ENTRY: (1.1700)
STOP LOSS: (1.1665)
TAKE PROFIT: (1.1735)
*If you see the market bounce up strongly you can extend the take profit target.
The market is an a critical area (1.1700-major support) where the price reject to go lower. (Buyers are trying to get in control of the market)
& we can confirm that with the 4 in a raw indecision candlesticks in 1H.
With this stop loss we are covering 2 more critical areas as a result if it breaks this area we will still got a chance ! ! !
HAVE FUN & HAPPY PROFITS ! ! !
