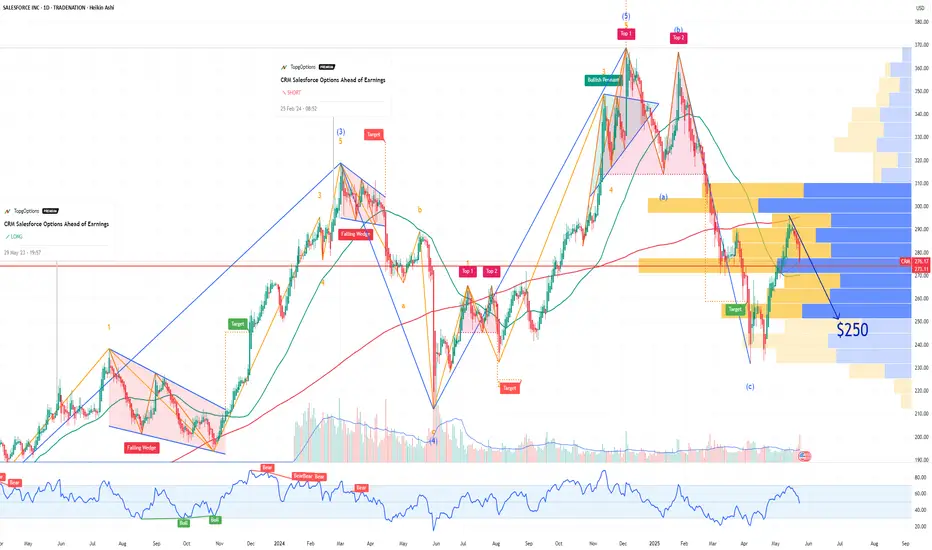
CRM Salesforce Options Ahead of EarningsIf you haven`t bought CRM before this rally:
nor sold this top:
Now analyzing the options chain and the chart patterns of CRM Salesforce prior to the earnings report this week,
I would consider purchasing the 250usd strike price Puts with
an expiration date of 2025-6-20,
for a premium of approximately $5.15.
If these options prove to be profitable prior to the earnings release, I would sell at least half of them.
Disclosure: I am part of Trade Nation's Influencer program and receive a monthly fee for using their TradingView charts in my analysis.
CRM
Breaking key resistance — could $BGM repeat $RGC’s 100x rally?Let me introduce a stock that has already generated a profit of nearly 40% and I have no intention of selling it yet. Because both the chart and fundamentals suggest the stock seems to be approaching the point of potential explosion, and it is even possible to increase several times.
This stock is NASDAQ:BGM , a traditional Chinese pharmaceutical chemical company but now it has transformed into an AI productivty platform. More on that later—let’s first take a look at the technicals, which I always pay close attention to.
Firstly,the uptrend remains intact.
Since last year’s stock split, the price has been climbing steadily within a clear uptrend. After breaking above $8.50, it has consistently held above that level for months, showing strong momentum. (I bought in when it dipped back to $8.50 earlier this year and have held since.)
In the recent days, the stock price has successfully broken through the upper limit of the consolidation range that has persisted for nearly 3 months, and has stabilized above $12.
This is a significant breakthrough, and it may indicate that the stock price could potentially start a significant upward rally at any time.
Secondly,the stock is almost fully controlled by the market maker.
There’s a saying in trading: “Volume precedes price.” Since December 2024, BGM’s trading volume has clearly increased, with each spike in volume followed by a small price uptick—money was buying.
Interestingly, each rise is followed by a pullback, but on much lower volume. This volume pattern—rising on gains and shrinking on pullbacks—suggests that the maket maker have accumulated most of the shares and now have strong control. The dips are likely just shakeouts to flush weak hands before a bigger breakout.
Thirdly, low short interest means minimal resistance to a price surge.
According to Nasdaq's data, BGM’s short position was 34,466 shares by 31th March, but dropping to 18,889 shares by April 30,the number of short positions has significantly decreased.
This was showing that as the stock price rose, short sellers mostly exited or turned bullish—clearing major obstacles for further gains.
Technically, everything is set—just waiting for the trigger. Pull the trigger could spark a massive rally, and that trigger may come anytime as the company nears to complete a key transformation.
Yes, the company is transforming from a traditional pharmaceutical firm into a leading AI tech ecosystem. Since last year, it has been actively acquiring companies to enter AI-driven healthcare, insurance, and wellness sectors, aiming to become an industry leader.
①In December 2024, BGM acquired RONS Tech and Xinbao Investment, integrating the AI insurance platform “Duxiaobao” (powered by Baidu’s NASDAQ:BIDU technology). Leveraging 704 million monthly active users, they aim to disrupt traditional insurance sales and drive exponential customer growth.
②In April 2025, BGM acquired YX Management to boost AI applications in insurance and transportation, accelerating the “pharma-insurance-health” ecosystem.
③In May 2025, BGM acquired HM Management and its two subsidiaries—SHUDA Technology and New Media Star—strengthening its algorithm optimization、data modeling and traffic-driven customer acquisition capabilities
After several acquisitions, the company has initially completed its transformation plan. So the "trigger" we are pursuing might emerge during the next major acquisition by the company to complete the final transformation.This is an important milestone. According to reliable sources, the company's next acquisition is likely to take place in the coming June. Let's wait and see.
Another "trigger" may be the company’s next earnings report, which will include the “Duxiaobao” AI insurance business for the first time, expected to add over $5 million in revenue, might to confirm the initial success of the company's transformation. And this is potentially spark a strong stock rally.
These two potential "triggers" are both approaching soon.
If all goes well, how far could this rally go? Let’s refer to the recent strong gains of Chinese stocks like $RGC.
Technically, RGC saw a clear volume increase and price rise around July-August 2024. Then it had a six-month shakeout with low volume pullback (similar to BGM’s current pattern). In March 2025, it launched a major rally, rising over tenfold.
In May, RGC surged again, supported by fundamental news: the company announced FDA approval for its new neurostimulation chip and a Parkinson’s study with Mayo Clinic. From the start to the peak, RGC gained over 100 times in a short period!
Looking at BGM again: after the breakout, the stock will likely first test resistance near $15, which may not be a big hurdle. The real test could be at $24—the pre-split high and the upper boundary of the current “megaphone” consolidation.
Even if the price only reaches around $24 , current investors could nearly double their money. After the company’s fundamental transformation, its revenue and profits potential could grow beyond RGC. So, how high can BGM’s stock go? Let’s wait and see.

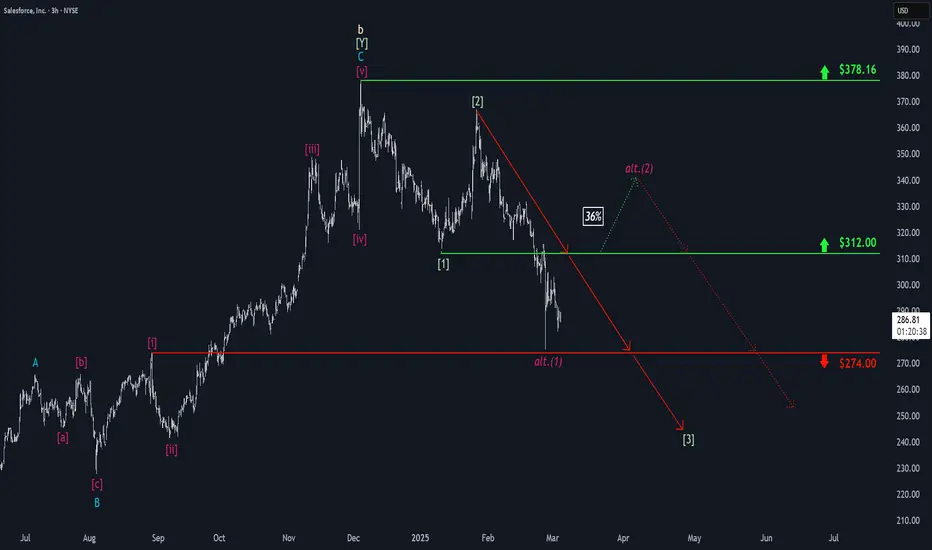
Salesforce: Further ProgressDue to continued downward pressure, Salesforce has made further progress in realizing our primary scenario. During the ongoing green wave , we still expect the stock to sell off below the support at $274. However, if the price imminently climbs above the resistance at $312, we will have to reconsider the structure of the ongoing decline and reckon with a magenta five-wave downward move. We currently assign this alternative scenario a 36% probability.
$CRM short setup part two. $280 target.Check out my recent post on $CRM. This name is down from it’s highs already 11% or so but 20% is correction territory so I can see this name hitting $280 area. $280-$285. Multi day put swing.
WSL

$CRM lower guidance, weak numbers, AI poopieNYSE:CRM should see sell pressure into the $285 zone and if it doesn’t hold expect $270’s.
WSL

Salesforce (CRM) – Bullish Setup AnalysisWeekly Chart – Cup and Handle Formation
• The stock has formed a classic cup and handle pattern on the weekly timeframe.
• Moving Averages (20 & 150) are trending upwards, supporting bullish momentum.
• After breaking out, CRM retested the breakout level as support and is now showing signs of continuation.
• The potential long-term target stands at +60% upside, aligning with the measured move projection.
Daily Chart – Consolidation & Breakout Retest
• The stock is currently trading within a converging channel, stabilizing near the breakout level.
• A wick rejection at the breakout price suggests strong demand at this level.
• Stochastic oscillator is turning upwards, indicating the start of a potential bullish cycle.
Final Thoughts
If momentum continues, CRM has the potential for a strong bullish move. Watching for confirmation and volume increase on continuation.
What’s your take on this setup? Let me know in the comments!

$FROG - About to fly! 129% Upside potentialNASDAQ:FROG
As I've been calling out for the past month Tech Services and SaaS companies are the next phase of Ai and very hot right now based on the massive moves after meh to good earnings from the likes of NASDAQ:TEAM NASDAQ:MNDY NYSE:NET NASDAQ:CFLT
I believe this trend continues and this small 4B Mkt Cap company could really get going after earnings on Thursday!
- CupnHandle forming while Bull Flag breaking out
- Two year trendline is our safety net
- Massive Volume Shelf with GAP
- H5 Indicator made bullish cross and is GREEN
- WCB has formed
PTs: $43/ $57/ $67/ $84
NOT FINANCIAL ADVICE

Don't miss the Next AI Gold Rush! WATCH NOW!In this video, we delve into the next phase of artificial intelligence and explore the companies set to benefit the most. From giants like Microsoft and Salesforce to rising stars like Snowflake and CrowdStrike, we break down how each company is harnessing AI to revolutionize their industries. Don't miss out on this deep dive into the tech titans leading the AI charge and shaping the future. Subscribe and hit the bell icon to stay updated on the latest in AI advancements! NASDAQ:CRWD NYSE:CRM NYSE:SNOW NASDAQ:MSFT NASDAQ:TEAM NYSE:PATH NYSE:SHOP NASDAQ:DDOG NYSE:NET NASDAQ:MDB
What companies are you positioned in or ready to start a position in?
Let me know in the comments below!

$CRM $340 lagger in AIHello, I like this name for a pickup speed off the new presidency, CEO love and support for Trump and I personally like the technical setup here. $340c short term, 1/31 or out further.
In $2.07.
WALL ST. LOSER

Salesforce: Wave b Top Established!On December 4, CRM peaked briefly, hitting a new record high at $378.16. Since then, the price has been unable to revisit this level, initiating a first downward impulse. Therefore, we now consider the prominent wave b top as established and are preparing for a significant sell-off, with extension targets below the $274 support. Thus, the still ongoing correction should continue.

Don't Miss the Second Wave of AI Opportunities!Are you still regretting missing out on NVIDIA's 10x growth? This time, you may not need to worry. The second wave of AI is forming, and this time, the opportunities are not limited to hardware, but are fully penetrating enterprise-level applications. For investors, this is an unparalleled new window of opportunity.
A Look into the Future: The Development Patterns of AI
Reviewing history, from the power revolution a century ago to the internet revolution in the 1990s, we see similar development patterns. Each revolutionary technology wave will go through three key stages. Let's take the internet revolution as an example:
Infrastructure Construction Stage
In the late 1980s and early 1990s, the internet was just emerging, and its applications were still very limited. The companies that benefited most were those in the foundation layer, such as Cisco and Intel.
The first stage of AI development was similar, with chip giants like NVIDIA driving the construction of AI infrastructure.
2. B2B Application Rise Stage
In the mid-1990s, the internet gradually entered the enterprise-level application field, with CRM and supply chain management software emerging, improving corporate production efficiency.
AI is currently entering this stage, with companies optimizing operational processes using AI technology to achieve cost reduction and efficiency improvement.
3. C2C Consumer-Level Application Popularization Stage
In the late 1990s, various C2C killer applications began to emerge, such as Amazon, PayPal, and Yahoo!, which became familiar companies.
Now that the first wave has stabilized, the question is: when will the second wave arrive in B2B applications?
Many ordinary people have a feeling that AI applications are limited to chatbots like ChatGPT, and that true killer applications have not yet arrived or will take a long time to develop.
As a result, some people believe that AI investment is still too early, and that what's being blown up now is just a bubble.
Indeed, we can see that C2C applications are still in development and will take a long time to mature. However, in B2B applications, AI has already been widely deployed and has shown significant effects in certain specific fields. It's just that ordinary people haven't yet felt it.
As investors, we must be more sensitive than ordinary people because corporate changes will be critical to the second wave of AI.
The Second Wave of AI: The Golden Era of Enterprise-Level Applications
The following graph is a summary of the top-ranked industries in which AI-driven companies are most likely to benefit.
As for software companies like ETFIGV, we can see from their financial reports that AI is driving significant improvements in corporate operating efficiency.
The following graphs show the gross margin and EBITDA margin of three typical software companies: Shopify, Salesforce, and ServiceNow.
Explaination:
Gross margin reflects the main product profit of software companies, while EBITDA margin reflects the company's operating profit after deducting depreciation and interest.
In other words, it represents a company's ability to generate profits from limited resources.
We can see that these three companies have seen significant improvements in their EBITDA margins over the past two quarters while maintaining stable gross margins.
Data does not lie; this may indicate that AI is already seeing effects in enterprise-level applications.
• Shopify: By optimizing internal processes using AI, it maintained stable gross margins while improving EBITDA margins and directly driving stock price growth by 30% after reporting earnings.
• Salesforce: It launched its "INS Instant" AI tool to automate 370,000 tasks, saving 50,000 hours of labor time and significantly improving employee efficiency.
• ServiceNow: Its AI accelerated data extraction speed by 53%, work flow efficiency by 27 times, and RPO growth by 26%, providing more powerful workflow optimization services for enterprises.
These data clearly show that AI is not just a buzzword but brings actual efficiency and profitability improvements to enterprises.
Snowflake: A Breakthrough in Enterprise Data Analysis
Snowflake's case is more representative. This data analysis platform focuses on providing intelligent operational support to enterprises using AI technology.
This quarter's RPO increased from $52 billion to $57 billion, reflecting enterprise trust in its AI capabilities. CEO's "All-in-AI" strategy not only drives data mining efficiency but also drove its stock price up by 30% after reporting earnings.
Insurance Industry Digital Transformation: AIFU and BGM's Strategic Cooperation
The insurance industry is an important target area for AI transformation due to its information-intensive nature. It is at the forefront of digital transformation, especially with AI technology driving it forward.
AIFU's smart future has already achieved insurance industry transformation through its core product "Duxiao" platform.
"Duxiao" is an AI-driven insurance platform developed jointly by AIFU and Baidu. By combining big data and AI technology, it can provide personalized insurance solutions for customers.
The platform analyzes customer health insurance needs, education planning, and wealth management needs in depth and generates highly customized insurance configuration plans. This has significantly improved agent productivity and accuracy while reducing operating costs.
As of December 2023, AIFU's revenue reached $31.98 billion, with a year-on-year growth rate of 14.98%. Net profit was $2.89 billion with a year-on-year growth rate of 237.25%.
AIFU's PE ratio (TTM) is only 3.5 times. In comparison to industry giants such as Prudential (PUK) and AXA (AXAHY), which have PE ratios above 12 times or even higher than AIFU.
AIFU's strategic acquisition of two subsidiaries by BGM on Friday includes core technology assets such as "Duxiao" platform. BGM is a global pharmaceutical and chemical company that has actively promoted its AI strategy in recent years.
By integrating AI with data analysis, BGM is reshaping its business model towards a more intelligent future.
How to Seize Opportunities in the Second Wave of AI?
What kind of companies will ultimately succeed? I can share with you my thoughts on what kind of companies need to possess these characteristics:
Strong Competitive Moat: Companies that can continuously strengthen their competitive barriers through AI.
Data Monopoly Advantage: Companies that build models using high-quality private data rather than public data.
Flexible Business Model: SaaS platforms with pay-as-you-go pricing models have more scalability and profitability potential.
Strong Execution Ability: Agile and decisive management teams that can quickly deploy technology.
Conclusion:
The future belongs to those who dare to layout!

10% December slide for Salesforce (CRM)
Despite raised guidance, we see a 10% correction ahead for Salesforce. This doesn't mean it won't experience a next leg up. Near-term short opportunity! Wave 5 ending and overbought. The stock's rapid ascent may have led to overvaluation, making it susceptible to a pullback as investors take profits.
We see a 10% reversal to the $320 price range this December.
Keep your charts clean and easy to understand.
Your strategy should look for easy-to-identify repeating patterns.
Be alert.
Trade green.

Salesforce - $CRM - Set to FLYSalesforce is primed for a major move higher, and here’s why:
1️⃣ H5 Indicator is GREEN
2️⃣ Hasn't reach bull flag measured move yet
3️⃣ Massive 3-Year Cup-and-Handle Pattern Breakout with a retest. Now NYSE:CRM will move higher!
4️⃣ Wr% consolidation box is thriving
5⃣ All Time High Free Range 🐔
6⃣ Impressive FCF Growth: Driving higher margins and profitability. Intrinsic Value (Fair Value): $419 - 21% higher
🎯 $383 (Aug 2025)
📏 $502 (Before 2028)
Are you sold on this H5 Setup?
NFA

Salesforce (CRM): Decision Point ApproachingNYSE:CRM has risen higher than anticipated, but we are still holding on to our bearish scenario. Initially, we expected another leg down following the wick that we identified as wave ((a)), but the stock surprised us by pushing to a higher high, surpassing the levels of wave 1 and wave B at $348.86.
This move invalidated our first bearish scenario, activating our secondary outlook of a flat correction where wave ((b)) exceeds wave 1, which aligns with the current structure.
From here, our outlook is straightforward: if our bearish scenario holds, NYSE:CRM should drop below the wave ((a)) level, which is yet to be determined. However, if the stock rises above $360 and sustains trading at that level, the bearish outlook will be invalidated, requiring a complete re-charting of $CRM.
A decision point is approaching, and we will monitor the stock closely for further developments.

SALESFORCE $CRM | STRONG TREND UP TO EARNINGS Dec. 3rd, 2024SALESFORCE NYSE:CRM | STRONG TREND UP TO EARNINGS Dec. 3rd, 2024
BUY/LONG ZONE (GREEN): $338.75 - $400.00
DO NOT TRADE/DNT ZONE (WHITE): $331.00 - $338.75
SELL/SHORT ZONE (RED): $250.00 - $250.00
Weekly: Bullish
Daily: Bullish
4H: Bullish
1H: Bearish
NYSE:CRM releases earnings today, Tuesday Dec 3rd, after market close. Price ranges up to previous earnings on Aug 28th. This range finally breaks out and creates a bullish trend that has held strong leading up to today's earnings. High timeframes show bullish trend (my trend determining indicator), along with current chart trend bands (my channel/bands directional bands). ATM Straddles suggest the expected move to be around 7.25%, or $24.00 in either direction. This is on pace with it's average and historical earnings moves (previous 8 - 12 quarters).
My estimated moves:
Downside: ~$300
Upside: ~$360
(30-45 DTE)
This is what I would personally look at before entering trades, everything is subject to change on a daily basis and as I analyze different timeframes and ideas.
ENTERTAINMENT PURPOSES ONLY, NOT FINANCIAL ADVICE!
trendanalysis, trendtrading, priceaction, priceactiontrading, technicalindicators, supportandresistance, rangebreakout, rangebreakdown, rangetrading, chartpatterntrading, chartpatterns, crm, NYSE:CRM , salesforce, salesforce earnings, earningsplay, salesforcetrend, salesforcetrade, crmtrend, crm earnings, crmtrade, crmstrongbullishtrend, salesforcestrongbullishtrend, options, optionstrading, atmoptions, atmstraddles, atmstrangles, willcrmbeatexpectedmove, expectedearningsmoves,

CRM potential Breakout to 424+CRM is setting up for a classic bullish breakout trade, showing multiple strong technical patterns that align with a high-probability long setup. The short-term moving average has crossed above the long-term moving average, a strong bullish signal indicating sustained momentum. CRM has shown strong bullish momentum, confirmed by multiple technical patterns. Look for increased volume on the breakout above $348 to confirm the move. The trade offers an attractive risk-to-reward ratio of at least 1:3, depending on the stop placement.
Ascending Triangle
Higher lows are forming as buyers step in at increasing levels, while resistance remains flat at $348. This shows accumulation and strong bullish sentiment.
Breakout Target: $348 + $76 = $424
Targets:
First Target: $ 400 (psychological level).
Final Target: $ 424
Trail stops once the first target is hit to lock in profits.
I will enter this week a position (options) and will update this post accordingly.

SALESFORCE $CRM - 5/17 - THE STOCK GAUNTLET CONTINUES! ⚔️🛡️ THE STOCK GAUNTLET CONTINUES! ⚔️🛡️
STOCK/ TRADE SETUP UPDATE: 5/17
5⃣ NYSE:CRM - SALESFORCE
Video Analysis:
Show some love by: ❤️
LIKING l FOLLOWING l SHARING
Hit the🔔as well to be notified when each video drops
NFA #tradingstrategy #HIGHFIVESETUP
NYSE:CRM

Reversal Incoming CRM Sells Are PossibleWhat do you know about Gravestone Doji?
The Gravestone Doji candlestick pattern can be interpreted as a bearish reversal when it occurs at the top of uptrends. The Gravestone Doji can help traders see where resistance to a pricing increase is located. It is typically used with other technical indicators to identify a possible uptrend. What Does a Gravestone Doji Look Like? The Gravestone Doji chart pattern is an inverted “T”-shaped candlestick created when the open, high, and closing prices are nearly equal. The most important part of the Gravestone Doji is the long higher shadow.
Why Is the Long Upper Shadow Important?
Technicians generally interpret the long upper shadow as meaning that the market is testing to find where supply and potential resistance are located. Bulls Rejected by Bears The construction of the gravestone doji pattern occurs when bulls press prices upward. However, an area of resistance is found at the high of the day, and selling pressure pushes prices back down to the opening price. Therefore, the bullish advance upward was rejected by the bears.
Limitations of the Gravestone Doji
Although the Gravestone Doji can indicate the coming of a bearish price change, traders should not rely on this indicator alone: True Gravestones are rare since open, high, and closing prices are seldom the same. Successful traders will typically wait until the following day to verify the possibility of a downtrend after a Gravestone. If the Gravestone appears after a pricing downtrend, it can indicate that a price increase may follow. A Gravestone accompanied by higher-than-usual volume is more reliable than one with low volume.

CRM inverse head & shoulders - Going UP ?CRM Inverse head & shoulders + Cup & Handle patterns + Above the average line 150.
Only an idea and not a recommendation for trading

CRM 100% UP ?CRM Cup & Handle pattern + Above the average line 150.
Only an idea and not a recommendation for trading

Salesforce Set to Soar: Here’s Why!NYSE:CRM
Salesforce Set to Soar: Here’s Why!
Salesforce is primed for a major move higher, and here’s why:
1️⃣ #HIGHFIVESETUP: Our proven trading strategy signals bullish trends.
2️⃣ Bull Flag Breakout: Already breaking out, heading toward the next key point.
3️⃣ Massive 3-Year Cup-and-Handle Pattern: NYSE:CRM is on the verge of a significant breakout.
4️⃣ Impressive FCF Growth: Driving higher margins and profitability.
🎯 Price Targets:
First Price Target: $383 (Aug 2025)
Second Price Target: $500 (2028)
What do you think of this trade setup? Are you adding it to your watchlist?
NFA
#trading #QQQ #SPY

CRM’s Bullish Setup: Inverted Head & Shoulders BreakoutSalesforce Inc. (NYSE: CRM) continues to innovate and maintain its position among the leading players in the cloud space, as highlighted in recent financial reports. The company’s growth has been driven by its focus on customer relationship management (CRM) technologies and its expansion into artificial intelligence, which has bolstered its offerings. Despite broader market headwinds, Salesforce has managed to navigate the tech sector’s volatility with strategic initiatives and solid earnings performance.
Technical Outlook: Inverted Head and Shoulders Pattern
On the weekly chart, Salesforce stock shows the formation of a classic inverted head and shoulders pattern, a bullish signal indicating potential upward momentum. The key resistance level stands at $314.70 , which the stock attempted to breach earlier this year, experiencing rejection in February, marking the stock’s all-time high. A retest of this key resistance appears likely in the near term.
If the stock manages to confirm a breakout above this zone, our target price is set at $339.48 , a level that aligns with historical resistance and bullish momentum projections. To manage downside risk, we suggest placing a stop loss at $259.75 , a lower support level that provides solid technical backing in case of market reversals. This setup offers a risk-reward ratio (RR) of 1.5, making it an attractive option for traders seeking a medium-term position.
Quantum Probability Indicator: Strong Momentum Signals
Our proprietary Quantum Probability indicator, W.ARITAs , further strengthens the bullish outlook on CRM stock. The indicator points to strong technical momentum, suggesting a high probability of the stock moving toward our target zone. This momentum aligns with Salesforce's broader market positioning and favorable investor sentiment.
Conclusion: Positive Short-Term Outlook for CRM
Salesforce Inc. has demonstrated resilience in a challenging market environment, and its technical indicators now suggest a potential breakout. With a target price of $339.48 , a stop loss at $259.75 , and a 1.5 risk-reward ratio , this setup presents a favorable opportunity for traders looking to capitalize on bullish market conditions. As always, investors should remain cautious and monitor key resistance levels for confirmation of a breakout.
Disclaimer: This analysis is based on technical indicators and market observations. It is not financial advice. Investors should conduct their own research and consult with a financial advisor before making any investment decisions.

Salesforce (CRM): Potential bearish flag formingOne of our members asked for an analysis on Salesforce ( NYSE:CRM ), and we've taken a closer look at it. Initially, it's a bit challenging to see the full picture, but if our Elliott Wave count is accurate, we marked the end of wave (2) at $115.29 after establishing wave B, which was exactly between the 127.2% and 138% Fibonacci levels.
It appears that wave 1 was put in with a new high slightly above wave B, taking out the resting liquidity (likely due to profit-taking and closing of long positions). Following this, there was a 33% drop, and here's where it gets tricky. Normally, we would expect this decline to continue, suggesting that the current rise is merely a relief pump. However, wave ((a)) perfectly touched the HVN POC, which indicates a slight chance that this could be the bottom. That said, we still believe that a continuation down to the 61.8-78.6% Fibonacci level is more likely.
Zooming in on the blue-circled area, we notice a textbook bear flag pattern developing. While we don't typically trade based on chart patterns, it is difficult to ignore this one given its clear structure. It becomes even more significant if there is a wick above the upper trend line of the flag, which could trigger another sell-off by taking out the liquidation levels. Such a wick would also fully close the gap and enter our targeted area where we anticipate a possible reversal.
To be clear, we are not trading this bear flag pattern or the targeted area just yet. Instead, we are using this setup as a means to validate whether our bearish outlook is correct or not. We’ll continue to monitor the development closely and provide updates as we gain more clarity.
