SNOW poised to meltAnother money losing covid era IPO with failed double top. This company reports "earnings" on March 2. The last 3 annual reports have posted larger losses than the prior year. The era of fed induced stimulus and QE with bubblelicios low interest rates is over. This stock looks to be printing a death cross in the coming days same as NOW and CRM. Look out below!!
CRM


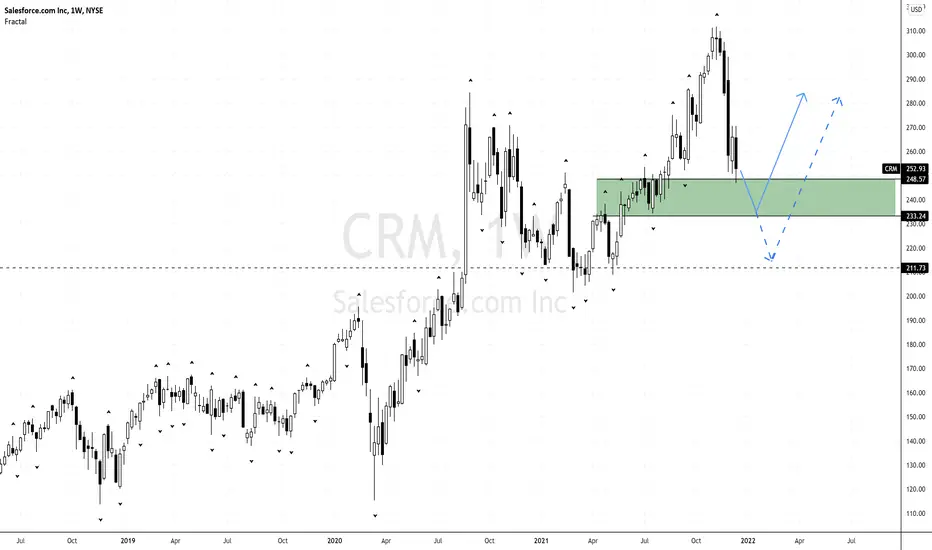
Do you think the shorts are still hidden in here ? $CRM idea$CRM nice lower shadow and an inside candle. Can this projects us higher or lower from here ? Drop a comment of what you think of the outcome

CRM - Potential buy zone at 200
One more push down to 205 or 200 should see a hard bounce.
If you are short, it'd be good idea to trim your position.

CRM - Institutional Box + Fib levels6.854 level lines up with Consolidation Box POC (Point of Control)

Potential Falling Wedge on CRMBulls tried to reclaim the 200 EMA, but were strongly rejected. Salesforce is down 11% in two days. We're entering my "Buy Zone" (where it's on my radar, but I need a confirmation, like divergence, before I'm ready to take a position). I'm expecting a Falling Wedge to form, and will likely wait for it to play out further. It's too risky for me at these levels, but more aggressive traders may have an opportunity to scalp some short-term profit before we head down further.
----------------------------------------------------------------
These are my personal views and not financial advice. Please do your own research before investing.
I'd love to hear your thoughts, ideas and feedback. Feel free to Comment and I'll try and get back to you quickly.
If you appreciated this analysis, consider Liking or Following . Thanks!

$CRM: Short term bottomCalling a short-term bottom on CRM here. This is not a bloated tech stock, it's valued over time. They are currently at a P/S ratio of 8 and I think the stock might have put a temporary bottom. All in all, the stock would still go through the market correction cycle in the long term. In the short term, I expect it to close at least GAP 1. Also, notice the stock has extended below the lower Bollinger bands and oversold on all time frames.
Entry: $227 - $230 (I got 03/18 230 calls)
Targets: 247,260,291
Stop Loss: 220 (The stock still has a gap at 221)

Nancy Pelosi bought calls for these companiesNancy Pelosi bought calls for these companies... what more do you need to know?

$CRM Long Trade ideaCRM is a stock with great fundamentals and I honestly believe every company would eventually move to a automated customer relations management system. The stock has been beaten down since last month with no changes in fundamentals and I think it might be time for a reversal after the 20% drop.
Trade Idea:
01/21 260C on break of 253 in a 30 mins chart
Target: 257,264,267,271
Stop: 249

CRM dailyEverything is on the chart.
We tend to see a bounce when it comes to the 20 monthly MA for CRM. It is currently at 238, its also a demand zone. If we don't bounce this week, watch for that area for a potential long term buy.
Chart that goes with the December DD that include CRM !

Expecting Salesforce Price Rejections Below $240Expecting to see price rejections around 234 level as sell off continues on Salesforce. With the daily rejection on last week trading day, this might be a reversal signal...
N.B
- Let emotions and sentiments work for you
-ALWAYS Use Proper Risk Management In Your Trades
Software at 200sma + HorizontalIGV, a Software based ETF, is currently at the 200sma which has shown support before. It is also at horizontal support from February highs.
Trade setup is drawn in chart. The risk-reward-ratio is above 4.
Top 10 holdings
MSFT (10%)
CRM (9%)
ADBE (9%)
INTU (7%)
ORCL (6%)
NOW (5%)
ADSK (2%)
PANW (2%)
SNPS (2%)
WDAY (2%)
Good luck.


CRM Ready to Crash?CRM looks to have lost its bullish momentum. My guess is that it'll consolidate near the $312 resistance before ultimately falling to AT LEAST $287. My bold prediction is that it'll fall to $267 by Dec 10 and use the top of the gap as a support for a bounce but...Only Time Will Tell

Let's all buy a metric shit ton of $CRM and get rich.This is a chart of $CRM. The bars pattern is of $FTNT. You can do this with $ADBE and a number of other tech stocks as well. You'll probably notice $ADBE is leading, I'm betting $CRM will follow. Both will catch up to $FTNT.
The structure is ready, we've been drawing this bull flag forever. We've lost all hope in stocks. Biden flushed everyone out that is scared of a little tax bump but only poors worry about taxes... they sold the bottom. It's time.


Short Ideas: Not investment advice** Thread belowAMD - Measured move complete.
CRM: Top of channel around 300. Scaling into some put spreads from here on up.
TQQQ:

CRM POTENTIAL 5 POINT MOVECRM is showing a potential break on the Daily Chart for a short 5 point move to 300.
The 1hr is already showing an entry with initial room to 295 first and if price breaks 295, it has room to 299-300.
Stop loss 289.50.
I like the consolidation back to the 21Ma on the daily chart and the weekly chart isn't bad either.

10/17/21 CRMSalesforce.com Inc. ( NYSE:CRM )
Sector: Technology services (Packaged Software)
Current Price: $291.66
Breakout price trigger: $284.50 (hold above)
Buy Zone (Top/Bottom Range): $289.80-$275.50
Price Target: $332.00-$335.90 (1st), $418.00-$422.00 (2nd)
Estimated Duration to Target: 110-117d (1st), 335-374d (2nd)
Contract of Interest: $CRM 1/21/22 300c, $CRM 1/20/23 400c
Trade price as of publish date: $12.50/cnt, $9.85/cnt

CRM is about to RIPCRM is setting up for a huge breakout. RSI & MACD are looking strong. Anticipating a gap and go over resistance tomorrow provided the FED doesn't tank the market today.

CRM what s Next ?CRM has reached the first target relative to the last Movement (see My idea : Sales Force : Signal confirmed to Buy 09/19).
Now we begun a correction phase, before to continue to next targets.
For the buyers not yet to enter, we must wait for rebound. May be at 269.26.
If we break this support it’s not good and we must stay outside.
For the sellers the trend is still bullish, but if the chinkou cross the prices it s a signal of weakness.
So let’s see ..

$TCEHY / TENCENT has bottomedTencent has bottomed.
- Inverse H&S
- High volume
- Support from 200 WMA
- Support from trend line
- Oversold RSI
What else bottoming out needs? Nothing IMO.
