Distribution signals flash at EU Open [$CRO, $MSTR, $BTC]EU Open today bring more sideways action for us all. +-1-2% moves over night, nothing much, all things considering. The market has clearly tightened it's range for the past 2 days, anyway. Volatility is still expected, as we remain sandwhiched between two massive gappers on either side of $MSTR current levels in the $210-235 $300-325.
$DXY continues to show strength, but given the double top, it's possible for a short-term reversal, if not a all out dump in September when the Jacksonhole rate hike announcements are made. Stay tuned!
My custom Accumulation / Distribution scripts are warning that the market is likely over heated (on the 15m scale), which aligns with the fact that BTC also rejected it's approach to the golen pocket formed from the most recent dump.
All this is to say, i'm still holding only my $CRO short position for the time being. Last night my take-profit limits only managed to cover 25% of my open position as I slept, when Asia brought us down into the .126 range before retracing back to current levels as EU opened.
With only 4% gains at the moment, it's nothing to write home about, but i'll be looking for good opporutnities to accumulate more shorts, as my overall thesis remains about the same as it was yesterday. Lots of resistence around the .13 levels for $CRO. And lots of resistence for BTC at 21450-21500 (golden pocket). Same like 282-285 for $MSTR.
Watch the $DXY! If it continues to rise quickly, expect asset prices to further collapse!
CRO

$BTC faces resistance exactly where expected [$CRO, Golden R.]Nothing more satisfying than charting out FIB lines and fining the place where prices are stuck aligns exactly with the FIB golden pocket... what else is there to be said? Waiting out the results for the day of my $CRO trade; short still and holding. No more accumulation, watching $DXY and $MSTR as we go!

$MSTR / $BTC Price Divergence$MSTR / $BTC (and many alt's in the green still for the day) are clearly off track from their usual correlation in the past hour+ from US market open. $DXY's pullback should imply we'll see $BTC / $MSTR head higher, but right now, it's any one's guess. $BTCUSD is forming a prety nasty little M pattern on the 5m chart. New York is looking prehaps to bring the prices down and cash in on the bull's who were too ambitions getting in on this morning's positive opening momentum? I'm still holding my short position. My guess is we're simply hitting too much resistence still, and the accumulation trend continues...

Dollar gains, Dollar Games [$DXY, $BTC, $CRO, $MSTR] i'm still holding my $CRO short trade, but since my last update the $DXY reversed off it's double top high's from yesterday, $MSTR has come down significantly and yet much of the market is mixed. Big moves for $BTC incoming!
$CRO price continues to stagnate as it's hitting strong resistance zone and the top of the daily distribution fann range. Check my previous update for more on that... GL out there!

$MSTR Lines of Liquidity [$CRO short in action, $DXY pump]I'm still working out how trading view recording works, and it seems the upload failed, so i'm not sure exactly what will be connected to this post, but let's see....
$MSTR opened strong today on the back of a slightly higher $BTC since yesterday's US market close. My hypothesis remains that volatility will be the name of the game in the coming days, as we are sandwhiched between two pre-market gaps. One from last Thu-Fri session at 300-325, which was nearly 5%, and multiple smaller ones down near 210-230. The shorter term gaps are more likely to be filled in the coming hours/days than the longer term-ones which have already failed to fill. But they'll all be filled, which means we can expect a range of at least 210-300 or 30+% moves in the coming days/weeks while we wait for summer to end and the US FED to announce it's highly anticipated rate hikes - estimated to be between 50bp and 100bp, depending on the inflation CPI numbers and other factors.
I'm active in a CRO trade, accumulating with anticipation for a move to the downside. I'm shorting through .125 - .129, with a stop loss set at .13. Looking to cover at ~.12
And I'm slowing distributing my open MSTR trade between 280-300.
The $DXY continues to pump, while $BTC remains relatively flat, which in my book indicates a divergence worthy of our close attention and a surprise up someone's sleeve. Who's playing games out there, who is it, really!?

CROSUSD Rising Wedge BreakCOINBASE:CROUSD
Rising Wedge abt 75% to apex
Decreasing Weis Wave Volume
Volume Profile Resistance unbroken
Increasing Downward Velocity
MACD Signal Down
Short and Long Term MFI Down
Price Object back to longer term trendline

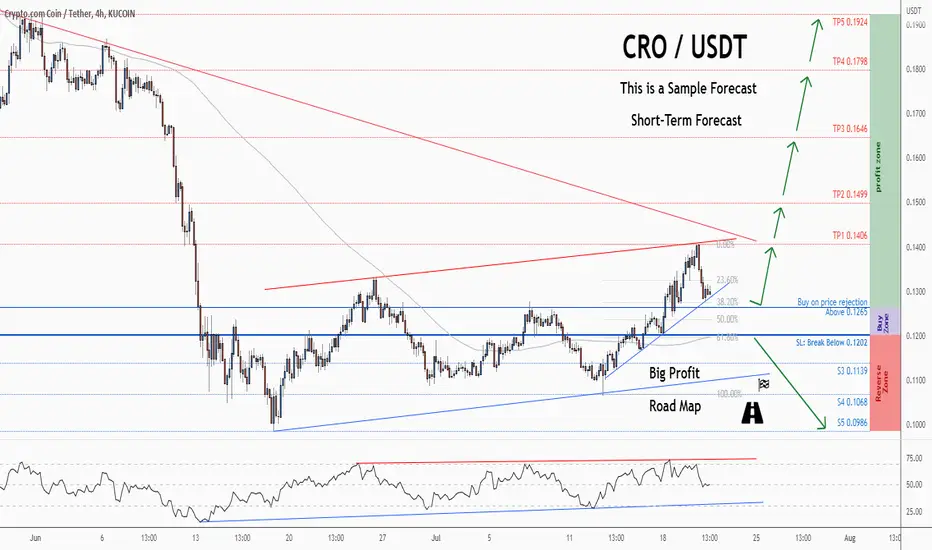
💡Don't miss the great buy opportunity in CROUSD @cryptocomTrading suggestion:
". There is a possibility of temporary retracement to the suggested support line (0.1265).
. if so, traders can set orders based on Price Action and expect to reach short-term targets."
Technical analysis:
. CROUSDT is in a range bound, and the beginning of an uptrend is expected.
. The price is above the 21-Day WEMA, which acts as a dynamic support.
. The RSI is at 50.
Take Profits:
TP1= @ 0.1406
TP2= @ 0.1499
TP3= @ 0.1646
TP4= @ 0.1798
TP5= @ 0.1924
SL= Break below S2
❤️ If you find this helpful and want more FREE forecasts in TradingView
. . . . . Please show your support back,
. . . . . . . . Hit the 👍 LIKE button,
. . . . . . . . . . Drop some feedback below in the comment!
❤️ Your support is very much 🙏 appreciated! ❤️
💎 Want us to help you become a better Forex / Crypto trader ?
Now, It's your turn !
Be sure to leave a comment; let us know how you see this opportunity and forecast.
Trade well, ❤️
ForecastCity English Support Team ❤️

💡Don't miss the great buy opportunity in CROUSD @cryptocomTrading suggestion:
". There is a possibility of temporary retracement to the suggested support line (0.1265).
. if so, traders can set orders based on Price Action and expect to reach short-term targets."
Technical analysis:
. CROUSDT is in a range bound, and the beginning of an uptrend is expected.
. The price is above the 21-Day WEMA, which acts as a dynamic support.
. The RSI is at 50.
Take Profits:
TP1= @ 0.1406
TP2= @ 0.1499
TP3= @ 0.1646
TP4= @ 0.1798
TP5= @ 0.1924
SL= Break below S2
❤️ If you find this helpful and want more FREE forecasts in TradingView
. . . . . Please show your support back,
. . . . . . . . Hit the 👍 LIKE button,
. . . . . . . . . . Drop some feedback below in the comment!
❤️ Your support is very much 🙏 appreciated!❤️
💎 Want us to help you become a better Forex / Crypto trader?
Now, It's your turn!
Be sure to leave a comment; let us know how you see this opportunity and forecast.
Trade well, ❤️
ForecastCity English Support Team ❤️
CRO / USDT Short on 1H IntervalHello everyone, let's take a look at the 1H CRO to USDT chart as you can see the price is moving below the local uptrend channel.
Let's start by setting goals for the near future that we can consider:
T1 = $ 0.1548
T2 = $ 0.1555
T3 = $ 0.1560
T4 = $ 0.1566
and
T5 = $ 0.1573
Now let's move on to the stop loss in case of further market declines:
SL1 = $ 0.1541
SL2 = $ 0.1533
SL3 = $ 0.1525
SL4 = $ 0.1521
and
SL5 = $ 0.1516
Looking at the CHOP indicator, we can see that in the 1H range we have very little energy and the MACD indicator shows a local downward trend.

CRONOS $CRO Long Idea - Hidden Bull DivI'm thinking we get a trend continuation here on $CRO, after that big rally a few days ago price has pulled back and bounced from the break out level
There was a breakdown and retest of the 20 period H4 simple moving average and is still currently below that level, so we may see another move down before up, however i think up is more likely due to the hidden bullish divergence on the RSI.
tldr
entry 0.140ish region
stop 0.13845 below prior swing low wick
target 0.15455 (previous candle close swing high) however if BTC continures to go up i expect further up side to 0.167 or so
Follow me on Twitter :) im just rebooting this account after sometime

CRYPTO.COM BULLISH Fundamentals:
- CRO token has utility in the crypto.com ecosystems for there holders:
cashback when paying for services with there visa card,
free services: for eg Netflix and spotify
stacking up to 10 % apy
trading fees discount
and more.....
- Top 10 exchange when it comes to transparency and tranding volume
- Aggressive marketing, have Matt Damon promoting, UFC branding ,Staples Center home of the Lakers and Clippers its now called
Crypto.com Arena on a $700 million deal for the naming rights, and many others.
Technicals:
- Week time frame shows 2 possible outcomes if market continues to range or dump the 0.22 $ target is the most likely, but if we
see btc pushing towards 26-30 k area the next target will be 0.4.
- You can see also a Big hidden bullish divergence forming withe the RSI oscillator and the price action(see image attached).
Overall i expect cro to rise in time and suppress the ath when we are in full bull run mode so its a good buy and hold bet.
When it comes to short term trading best bet is have a bot like myself to manage that.
KarbonAI is a good bet for that

CRO breaking out or fake out?4h volume seems to sustain this breakout, 1h and 15min volumes don't. This pattern usually it's bullish so I decide not to look at oversold RSI and rather focus on MACD and OBV.
My gut says this is going up but I'm not sure because lately I'm good only at shorting.
For a long I would wait for a retest at 0.1432-0.1436 USDT with a stop loss at 0.14, if price closes a 4h candle over 0.152 it's likely to keep going up 0.167.
If you wanna enter wait for confirmation.
good luck

Cronos longCronos broke trough the resistance level. Asset broke trough the descending trendline. Bullish movement to resistance level at 0.1743 is possible.

CRO re-test and ready to enter in the buy zoneI'm seeing a retest by CRO but a good opportunity to buy lower.
I'm still long but I'll DCA around $0.1320

CRO - 4H Reversal The CRO price is now on the top of the channel, which could be strong resistance. As you see, there is a long candle at the end of the bull run, so that it could be an exhaustion gap.
The price trend has been reversed three times by this pattern in this channel.

CRO/USDT Short Daily with good targets Hello everybody, I'm not Boris but lets talk about my new ideas
So CRO in daily is bearish
My first target is 0.09
The second target is 0.078
And the last one , small chance 0.050-0.066
Thanks and enjoy
Hasta la vista, baby

Wait for the break out! Always to your own analysis
But take what you can from others and make into your own.
No one trade or think the same, er alle have diff goals and targets and money.
But the fact is the course is where it is, now its up to you to find out what you wanna do IF you wanna do anything.

CRO short Entry Range, Take Profits and Stop LossCRO/USDT short
Entry Range: $0.11 - 0.13
Price Target 1: $0.10
Price Target 2: $0.08
Price Target 3: $0.06
Stop Loss: $0.14
the CRO short

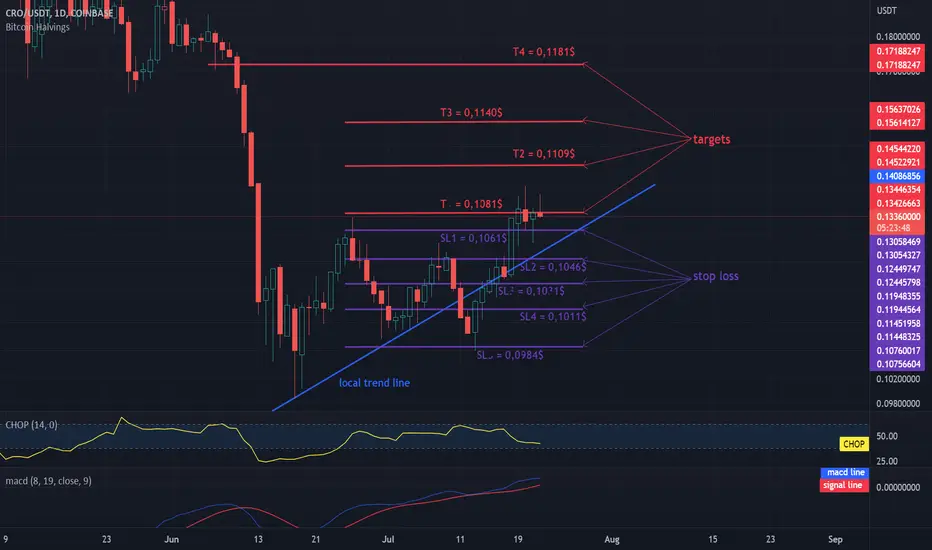
FTM continues the local uptrend.Hello everyone, let's take a look at the 1D CRO to USDT chart as you can see that the price has returned above the local uptrend despite its decline.
Let's start by setting goals for the near future that we can consider:
T1 = $ 0.1081
T2 = $ 0.1109
T3 = $ 0.1140
and
TT4 = $ 0.1181
Now let's move on to the stop loss in case of further market declines:
SL1 = $ 0.1061
SL2 = $ 0.1046
SL3 = $ 0.1031
SL4 = $ 0.1011
and
SL5 = $ 0.0984
Looking at the CHOP indicator, we can see that in the 1D range most of the energy has been used, while the MACD indicator shows a local upward trend.
CRO re-testing the support line before breaking itCRO has the opportunity to stay in the uptrend if it doesn't;t break the support line, otherwise it will need more time before to break the possible ascending triangle.

$CRO spot buy 15th of july at 0.1227As I mentioned in my $ALGO spot buy, the 50 MA also crossed the 200 MA what could lead to a bullish sentiment. At the right side of the chart you see the VWAP indicator. The big candles stands for the volume at that price range, at that price range I searched for S/R levels.
If we flip the first higher low (green cup drawing) I believe the uptrend will follow up, TP's are in the chart.
If you have any tips or feedback let me know pls!
Enjoy your evening!

CRONOS longSymmetrical triangle on CRONOS chart is broken up. Bullish movement to resistance level at 0.175 is expected to happen.

📈Cronos #CRO $CRO (July-15)CRO is forming a Symmetrical Triangle pattern to reverse the trend. On July 13, CRO had a False Break and this is a sign that CRO will increase sharply in the coming days.
If CRO breaks out of this pattern and turns up again, it could move towards the $0.16 zone by the end of July.
However, if it breaks out of this pattern and falls hard, we will consider buying it back at $0.08. The odds of this happening are very low but anything is possible
