CRO longterm targets.hello everybody.
CRO seems to be at the end of an ABC correction and compeleting C wave.
according to the 100% wave A retracement and 261.8% wave B extention
and these two levels overlaped.
this level is a good support level.
and momentum is in oversold area and pulledback to exit this condition.
after end of correction we can see a yellow target level that i show on my chart.
this level contains three important factor:
1-moving average 200
2-old valid trendline
3-50% fibo retracement level of ABC correction.
.
.
.
FUNDAMENTAL:
CRO have good fundamental and good news these days.
the most important news was partnership of crypto.com
with qatar fifa worldcup.
and in these 4 5 month we can see good grows in this lovely altcoin.
.
.
.
dont forget to manage your capital and risk.
.
.
.
if you take a trade you must set a good stoploss.
(NOTE!!! this article is my own opinion and its not a trade advice.
please tarde on your own opinion and use others opinion to improve your
analyze.)
.
.
.
so i will do that.please support me and i wish use your experience
and you can help me to improve my abilities.
thank you all.have good days.
CRO

CRO to $2. Will just leave this here ! 20x from here Hi guys, not sure why no one buys when things are at the bottom. Peeps gonna regret no buying cro at 10cents

CRO AnalysisOn the left we an see price hitting 0.5 fib which has been previously seen as a support area, also aligning well with the green uptrend line
On the right the Gaussian Channel indicator shows the middle band as a point of support, price on this BTC pair is just above this Middle Band right now

All set to hit .175?Its oversold and like to come back to test .17 previous high. Good swing trading setup at this point for a quick 5 points.

CRO - Gaussian Upper BandCROUSD chart on left, CROBTC chart on right
The USD pair can be seen to be touching the top of the channel, this provides a possible bounce and recovery point
While the BTC pair has poised itself right in the middle of a seemingly triangle structure, which has some fair supports (shown in the green box and along the white line)

DCA over the next yearI think 11 is gonna be the aproximate top next bull cycle topping out in late 2025 or early 2026. If CRO survives the winter and there comes a new crypto bull cycle then a 15 000% gain is possible.

CRO Oversold at SupportIf you haven`t sold CRO at the top:
Then you should know that it has retraced 89.45% and is now oversold at a support level.
I expect a bounce to the $0.17 resistance before heading lower this year.
Looking forward to read your opinion about it.

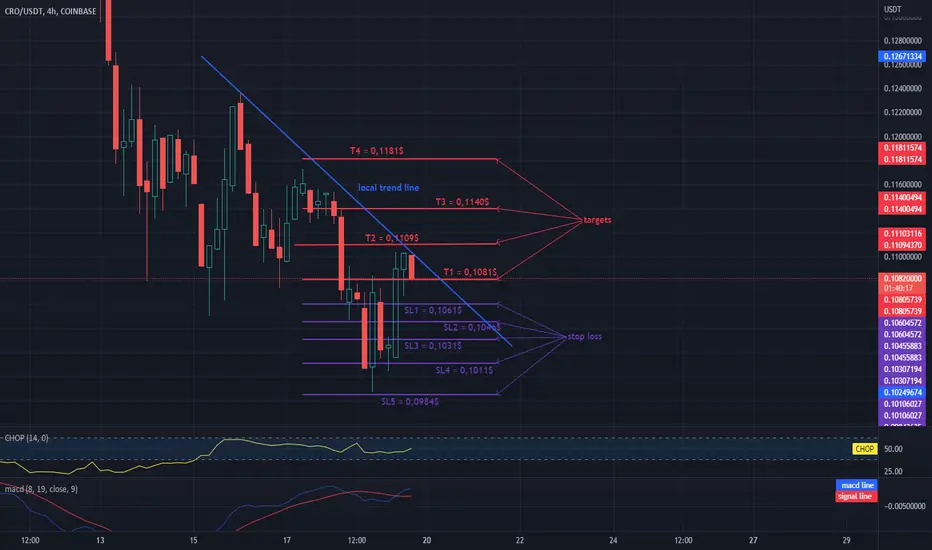
LOCAL REFUND OF THE PRICE CROHello everyone, let's take a look at the 4H CRO to USDT chart as you can see the price is moving below the local downtrend line.
Let's start with setting targets for the near future that we can take into account:
T1 = $ 0.1081
T2 = $ 0.1109
T3 = $ 0.1140
and
T4 = $ 0.1181
Now let's move on to the stop loss in case of further market declines:
SL1 = $ 0.1061
SL2 = $ 0.1046
SL3 = $ 0.1031
SL4 = $ 0.1011
and
SL5 = $ 0.0984
Looking at the CHOP indicator, we can see that at the 4H interval, the energy slowly begins to increase, while the MACD indicator indicates a local upward trend.
CRO LongHello Traders, here is the full analysis for CRO , let me know in the comment section below if you have any questions.
The ellipse could represent a possible zone with good risk/reward to accumulate long position.
Please note that all the information and publications hera are not meant to be, and do not constitute, financial, investment, trading, or other types of advice or recommendations. What you will find here, are only views of a Cat passionate about Finance.

Double bottom check? Will it hold the triangle format? Let's wait and see.
We also have a lower low, on the rsi, and an double bottom inside the triangle on the daily chart.

Cronos longCronos broke trough the resistance level. Asset broke trough the descending trendline. Bullish movement to resistance level at 0.203 is possible.


Cro price predictionCOINBASE:CROUSD
Just a long horizon support, has always worked, tested several times. You can swipe the x-/y-Axis to get the picture at the good place, so the red line is perfectly on the blue line!

CRYPTO.COM +200% Crypto.com an exchange token has been following a specific fractal that has been seen in the 2018-2019 bear market for bitcoin.
This of course is purely speculation and shouldn't be taken seriously until we breakout of the descending channel, I do believe however that we are coming to an end for this years bear market and personally this is when I will be dollar cost averaging into coins that have big upside potential... CRO being one of them
Not financial advice DYOR.

short CRO$CRO is bouncing off the Fibonacci 0.5 retracement zone which is also in line with the resistance level. Bearish movement is expected to continue and reach the support level at 0,175$

CRO short Entry Range, Take Profits and Stop LossCRO/USDT short
Entry Range: $0.17 - 0.19
Price Target 1: $0.15
Price Target 2: $0.13
Price Target 3: $0.60
Stop Loss: $0.10

Cronos longCronos broke trough the descending trendline. Asset broke trough the resistance level. Bullish movement to resistance level at 0.236 is expected to happen.

short CRO$CRO broke through the ascending trendline. Bearish trend is expected to continue and reach the support level at 0,1913$

CRO the beginning of the end.CRO as many other PoS cryptos are now finding out; has a bear market burning rate issue. PoS is a return to the old central bank dilemma. You hold for more tokens/currency you burn for the advantages it provides. Without scarcity in times of Stag-Flation these tokens are best positioned to make ATL's. The problem with them from here is that banks are still getting money from the Central Banks and insurance protections. Crypto PoW used to be the biggest threat to banking due to scarcity but PoS now poses a threat that can be countered. I expect 98% of PoS tokens to face legal issues come 2023 due to the Infrastructure bill provisions which protect PoW (No Ethereum is not going PoS untill legal gets cleared. Anyone selling you its a update need is lying. Refer to the infrastructure bill to understand. Vitalik is smart, going PoS before the bill changes would be death.) and make it very easy for prosecurtors to go after PoS for a multitude of compliance challenges that border on the un-feasible.

CROUSD Is it replicating Bitcoin's 2018 Cycle?Cronos (CROUSD) has fallen more than -68% since its March 28 High and is currently consolidating after a rebound on oversold 1D RSI. Being in a Bear Cycle since the November 23 2021 High, this pattern resembles Bitcoin's 2018 Bear Cycle. Notice the similarities.
Following their blow-off tops and the initial drop that followed, both have consolidated within a Descending Triangle of Lower Highs and when the Support broke, they went into 1D RSI oversold (below 30.00) area. Bitcoin bottomed higher on a -63% drop, marginally breaking the 1.5 Fibonacci extension. Cronos has so far marginally broken the 1.618 Fib ext on its recent low.
Is it repeating Bitcoin's 2018 Bear Cycle and if so can this be the bottom?
--------------------------------------------------------------------------------------------------------
Please like, subscribe and share your ideas and charts with the community!
--------------------------------------------------------------------------------------------------------

FTT/CRO FUTURESThink of FTX token as Apple & Crypto.Com as Gamrstop... Now you know where retail will pile into and where the deep liquidity is.
FTT = stability
CRO = affordablity

CRO daily chart still intact?CRO daily looks as it may of hit the bottom
according to the DeMark 9 Indicator. Outlined
in the green oval was the crash that happened
the last week...CRO appeared it was going to
start an uptrend until then, if CRO can get back
up to $0.20 and hold it, it should make its way
back up and the RSI is way low and oversold and
should only be able to make a move upward.
When i overlaid CRO and BTC together, it became
very evident that they move togther.

IT ONLY TOOK 5 MONTHS TO GET HERE - CRYPTO.COM ANALYSISNext up on the list of coins to swoop is CRO/USDT
In our previous analysis we predicted the drop down from just under a dollar and identified our current level as a possible bottom for CRO as shown below;
Only took us 5 months but we got here lol.
Following a zig-zag correction currently, in theory, wave C of this pattern should be 61.8%, 100%, or 123.6% of wave A. If it extends to 161.8% then we can expect Wave C to be a wave 3 of a 5-way impulse move (this is why we should apply proper risk management).
Price has currently retraced 100% of Wave A and we'll be hoping it doesn't go beyond our possibble bottom zone aligned with the 123.6 fib support level.
Our targets provided we don't drop to the 161.8% fib support will range from $1.85-$3.6 dollars before a top is in.
Past analysis linked below.
If you agree, pls leave a like, share and comment your thoughts below.
As always, feedback is appreciated!
