$CRON Possible resistance but by the 5th Moon.......CRON could move lower on a SHORT but by the 5th Moon
we will see if the line of resistance can be broken!
Cronos

CRONOS Group $CRON is breaking outIt is forming ugly double bottom that needs to hold above $6.65. The volume is well above the average, rsi is breaking out too.
If you find my charts useful, please leave me "like" and "comment"
thx

Ascending Triangle or Head & Shoulders?On the RSI there's a H&S patter so visible if I need to draw it I'm not sure you're familiar with a Head & Shoulders pattern.
What Is A Head And Shoulders Pattern?
A head and shoulders pattern is a chart formation that resembles a baseline with three peaks, the outside two are close in height and the middle is highest. In technical analysis, a head and shoulders pattern describes a specific chart formation that predicts a bullish-to-bearish trend reversal. The head and shoulders pattern is believed to be one of the most reliable trend reversal patterns. It is one of several top patterns that signal, with varying degrees of accuracy, that an upward trend is nearing its end.
Key Takeaways
A head and shoulders pattern is a chart formation that resembles a baseline with three peaks, the outside two are close in height and the middle is highest.
A head and shoulders pattern describes a specific chart formation that predicts a bullish-to-bearish trend reversal.
The head and shoulders pattern is believed to be one of the most reliable trend reversal patterns.
What Does The Death Cross Tell You?
The death cross occurs when a short-term moving average (typically 50-day SMA ) crosses over a major long-term moving average (typically 200-day SMA ) to the downside and is interpreted by analysts and traders as signaling a definitive bear turn in a market.
The opposite of the death cross occurs with the appearance of the golden cross, when the short-term moving average of a stock or index moves above the long-term moving average. Many investors view this pattern as a bullish indicator. The golden cross pattern typically shows up after a prolonged downtrend has run out of momentum. As is true with the death cross, investors should confirm the trend reversal after several days or weeks of price movement in the new direction. Much of the process of investing by following patterns is self-fulfilling behavior, as trading volumes increase with the attention of more investors who are driven in part by an increase in financial news stories abut a particular stock or the movement of an index.
Limitations Of Using The Death Cross
All indicators are “lagging,” and no indicator can truly predict the future. Once & while a death cross can produce a false signal, and a trader placing a short at that time would be in some near-term trouble. Despite its apparent predictive power in forecasting prior large bear markets, death crosses also do regularly produce false signals. Therefore, a death cross should always be confirmed with other signals and indicators before putting on a trade.

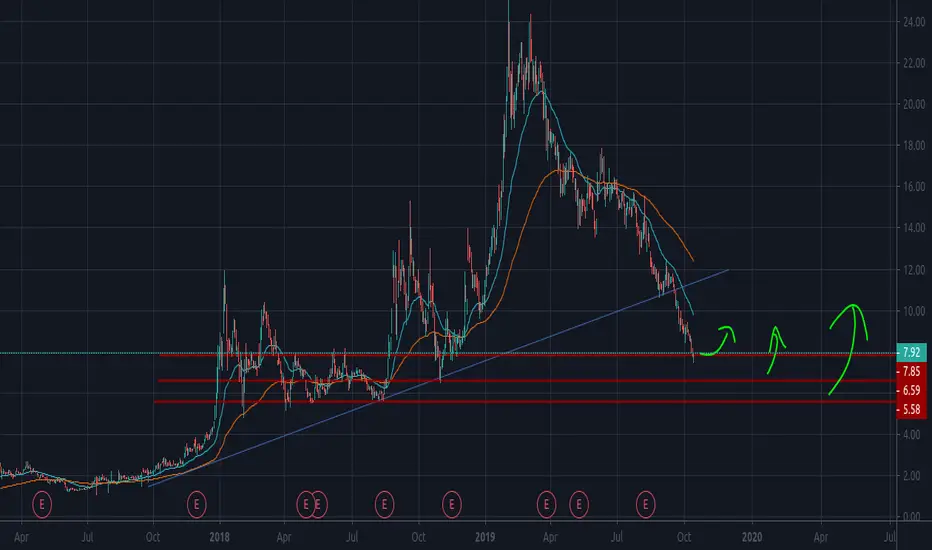
Cronos Group continues descending channelCronos group is currently trading within a steep downwards parallel channel. My expectation is that this channel will break within a few months, steep channels like this rarely last this long on non logarithmic charts. I would love to buy an accumulation towards the bottom.

CRON Make or Break! Crypto Crusader here with an extremely speculative pick, a weed stock, to be exact Cronos Group.
I don't have the time to discuss a more detailed analysis, but I'll post this chart to explain my thinking regarding technicals.
In regards to fundamentals, Altria (the maker of Marlboro) owns just under 50% of Cronos Group. You have to wonder, the maker of the worlds most popular cigarettes (regardless of tobacco being an addictive substance) must have a top notch marketing team behind them. They have billions of dollars, and it's in their best interest to see their investments profit. I'm sure they have a plan for Cronos. This is going to be almost purely speculative as a short / medium term investment, I would expect 50%+- swings in either direction. My entry was around $7.5, lets see how high this stonnkk can go!
May the trading God's be in your favor!
Crypto Crusader

Aurora Cannabis (ACB) Entering the kill box for shorts After what seems like a never ending cascade ACB and many other MJ sector names are entering major support zones for accumulation. This is where I am looking to enter positions for maximum Risk/Reward. Calculated entries are laddered at daily gap zones inside of this box with half of a position and another half is waiting to be deployed on a move up & out of this zone. Patience is key as there will need to be a new base formed or an explosive volume based bounce.

CRON RESISTANCE AT 3/1 GANNNASDAQ:CRON HOLDING 3/1 GAN AFTER THE BREAK OF 2/1. LOOKING BULLISH IF IT HOLDS 3/1?

CRON LONG {CRONOS GROUP}ENTRY 1 6.80
ENTRY 2 6.25
SL 5.00
TP.1 7.50
TP.2 9.50
TP.3 12.00
TP.4 14.00
TP.5 17.00

LONG ACB AURORA CANNABISBuy low sell high. Showing signs of a bottom. 2018 4.00 support level looks to be tested which computes a 50% upside from current levels. Could experience an echo bubble type move like other equities have in the past. Pot stocks starting to get a little more attention recently.

CRON LONG PRICE REVERSAL CRON READY TO REALLY ON EARNINGs
entry $8.00
entry $7.40
tp.1 $9.00
tp.2 $10.50
Tp.3 $12.50
TP.4 $14.00

CRON - Cup & Handle or W PatternCould do with some more volume, but broader market sentiment appears to be changing. With the HEXO's, CTST's, TGOD's and the likes, in turmoil, I suppose it is scary to stay true to your thesis. CRON is one of the potential long term winners, and even though it is trading at a ridiculous multiple, it is currently above resistance.
If we look at the hourly chart, we see a short term Cup & Handle emerging, and we're currently looking at a beautiful Bull Flag. If we look a bit broader, we see that the current Cup & Handle are part of a larger W pattern, which in this case seems to have started to form at the temporary bottom.
I was hoping that CRON would close the week above $9.30, but with peers just leisurely laying off hundreds of workers, I suppose it is impressive that she stayed above resistance on a typical low volume Friday. Indicators do show a good underlying strength. I'm looking for a test of the lower $10 levels next week, so that we soon may seen CRON attempt a double top, or even a higher high.
What are your thoughts?

LONG CRONExpecting bounce from extremely oversold weekly and daily levels. If stop breached, be prepared to catch new daily reversal on lower levels with a tight stop.

TITÁN CRYPTO VIEWS Posibles movimientos para el Bitcoin.
EL PRECIO TIENE QUE ENTRAR EN LA ZONA DE ARRIBA...


CRON - ShortingDon't get me wrong, overall I am bullish on this stock. Coming up, however, we are due for a correction from a market driven largely by news / media. Check the financials.
Keep in mind everything from 1/28 -> on could be artificial movement due to Kramer calling it out on TV. I would expect quite a big profit taking coming up, wouldn't be surprised by a drop of 38% from current rise ($14 price), or even more, before the strong resistance kicks in. I love this stock (bought in at $7.62 / pre Altria) but all rides up have their downs.
2 things to look at on longer charts. 1D, and 1W. Developing rising wedge - unavoidable from recent news attention. Bearish Divergence seen in the RSI. Overbought, and decreasingly so. My sell limit is at a conservative $20. However, it may be reasonable to expect a $22-24 price before the correction.
I have charted a Fib Retrace from current low, expecting a 38% profit taking. Keep in mind, if the price goes > $19.50, the Fib Retrace needs to be adjusted for newer buy targets. Currently, I am looking at nice round numbers of $14 (best estimate), $12, or $10 (least likely). At least we have our Resistance levels marked, if there is a correction.

Cronos Group Inc. (CRON) long.All description on the chart.
Please, don't forget to like and follow.
Thank you.


ACB 50/50 Probability - Breakout ModeACB NYSE is currently in the dead center of the bull flag trading range, and a converging triangle. This is where the directional probability is very close to 50/50. However the bulls have a slight advantage because it is a bull flag trading range, and there are bull gaps below. Prices are currently stalling at the failed bear reversal, where trapped bears may soon buy and contribute to a rally. However there is no valid but setup yet this week. The Bears want a test of the 5 low, and to fill the bull breakout gap. If this gap is filled, it will decrease the bull strength and prices will likely remain range bound for the next 20-40 bars. If instead the bulls keep the breakout gap open and form a higher low in the coming weeks, it will increase the probability of a test of the all time high and possibly bull trend continuation. But since prices are in a trading range, there will probably be some profit taking and short selling at a new all time high, unless the bull rally and breakout is exceptional.
If you found this helpful, please like and share. Feel free to comment or ask questions.

Short-term / Technical study of TLRYAs shown in chart. TLRY could benefit of a big rally if we can cross the $56.50 SMA(50) line with strong volume.
Technicals
RSI @62 with a stronger comeback from being oversold. (Check chart drawings)
* Always set your stop-limits to protect your position, as well as exit-profit targets to get your gains.
Happy trading!
dorfmanmaster

$Cron Feels Good!Resistance ~ $20 - $21
Support:
Trend Line
EMA 20&50 Lines
Enter ~ Whenever the price touches the trend line
TP 1 ~ $21
Stop Loss ~ $14.5
GL!
