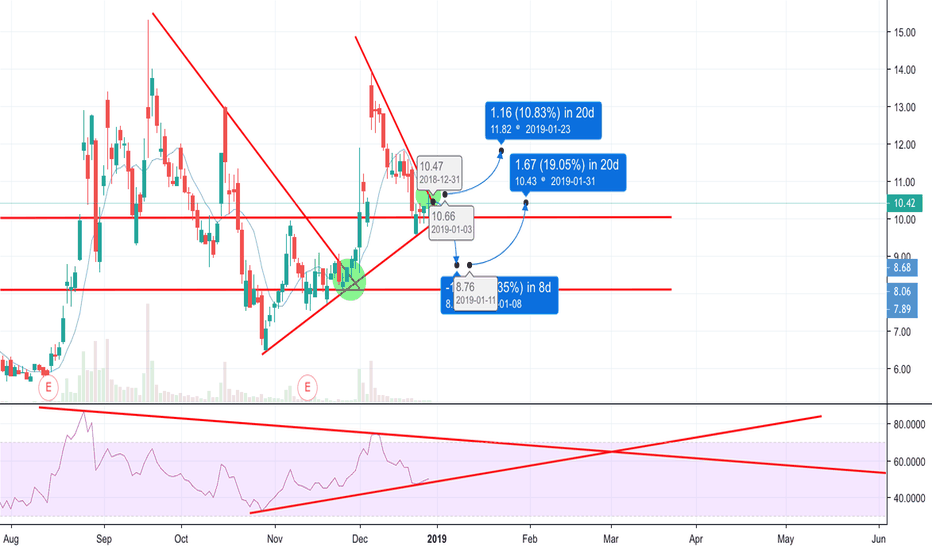
Cronos
Looking GREAT!!I have multiple wave counts going here right now, but all of them look like we have plenty of room to go up!
Might get a small pullback to $16, but honestly I'm going in now around 18 just in case. If it goes down to 16, I'll just buy more to get my average share cost down. That hemp bill and the new congress means good things for cannabis.
CRONOS GROUP, CRON, Bull Run Once Support Has Been Tested!Self explanatory chart....Bull Run coming with three possible upward movements at key support levels which can be supported by the 50, 100, and 200 day EMA's ranging from the next week to next month. Win, win, and win situation!
Get into the Canadian Weed market now while the U.S. market tanks in 2019.
CRON, Medium, 8 - 16 January Support and 5th Wave Confirmation!I looked once last time after utilizing the 50, 100, and 200 moving averages and adding a massive Elliot wave that encompasses months worth of price movement. The good news is that no matter how you look at it, this stock is bouncing predictably off of the upper and lower price channel and showing a general positive movement. Those 50,100, and 200 EMA's along with the historical support levels all line up to show that we are nearing the bottom of our consolidation and that the green or blue wave (4) patterns and subsequent (5) are the likely scenario during the month of January. We'll know by mid-month!
G'luck!
CRONOS, Medium, Key Support Levels Support A Bull Run!Pretty self explanatory chart....we are approaching our first key support level...if we break below it then the 2nd scenario would play out, etc.
Yes, in every scenario it is a Win, Win. Stay in the Canadian Weed Market. If you aren't in it yet, GET IN!
The majority of U.S. stocks will be impacted over the entire 2019 during the massive upcoming DJIA correction.
CRON the clear lead bear in the sectorCRON is the clear lead bear of the major names in the sector, not even trying for a bear flag of consolidation, preferring instead to continue a slow bleed down. We will eventually see a bounce, anything under 11.99 will be a lower high and I would not be surprised if the bulls were not even able to penetrate the middle bollinger band.
Since losing the RSI support line October 3rd we've seen a backtest of previous support, now resistance, and continuation down to lower lows.
Key daily range: 9.94 - 11.99
Zooming into the 4hr shows just how weak CRON is. While other weak names such as APH and TGOD are seeing some sideways consolidation before another leg down, Cronos Group isn't even trying for the equilibrium, instead breaking down to lower highs and lower lows.
Be aware there is market correlation between the mj sector with the S&P500, and keep in mind that SPY lost the daily uptrend today. It's often said that high tides raise all boats; likewise, low tides can beach all ships. A great example of that today was a losing trade I made shorting CRON. Let's look at the 5 minute chart below:
CRON is represented in the candles and SPY is represented underneath with the bars. You can see the correlation all morning, with a move down, a sideways consolidation bear flag, and a continued move down. The correlation breaks around 1pm and I notice CRON consolidating sideways in a bearish ascending wedge pattern, with multiple tops at 10.15 SPY on the other hand continued down. I placed a pretty large short and was filled at 10.14, with a stop loss at 10.16. I liked this setup because we had cooled off RSI levels, we had a clear resistance level with numerous rejections, and it was the weakest name in the sector on a day when the S&P500 lost the daily uptrend and was dumping - it was the perfect storm to profit significantly on another leg down. At 2:20pm SPY hit the low of the day and started an hourly oversold bounce that ultimately led to a bull break that stopped me out of my short for a decent sized loss, due to slippage. This is one instance where the setup and the plan were absolutely perfect, - except I forgot to check the correlation. SPY hourly RSI had briefly touched 16 and bounced, stopping me out for a loss.
By the way, I do analysis on the entire sector across all the mj charts I publish. If you're not looking at all the names I talk about, you're not getting the full sector-wide analysis. Follow me to get updates when I publish ideas and pay attention to the mj names you typically don't look at too, so you can stay in the know and get the full picture.
CRON gap-up & profit taking ruin a great chart setupCRON was the one setup I was most looking forward to this morning with it's multiple daily inside bars and triple bottom in the $10.80s range. That setup was ruined with a higher open, and profit taking all day. While the daily candle is very bearish, CRON did hold key support and broke the hourly lower high pattern. To fully shift momentum back to their favour, the bulls must hold low of day 11.05 and break high of day 11.99 (call it 12.00 even). That would confirm an hourly uptrend, but I would still anticipate a daily lower high somewhere around $12.75 at best. The hourly MACD bull move is very week and keeping me skeptical of any ability for significant followthrough, and the daily MACD extended even further down today despite the higher trading range compared Friday.
Keep an eye on CGC here - the sector leader if very close to a significant daily bear break and the correlation to the sector leader will favour the CRON bears.
Key range to watch is 10.82 - 14.00.
CRON tight range likely to break on MondayCRON formed its second daily inside bar on Friday as the range tightens up and the volume drops off. I'm looking for a break of range and a volume spike on Monday. I like inside bars because they signal equilibrium (pennant) patterns on a lower timeframe. Sure enough if you zoom into the hourly chart you can see a beautiful equilibrium playing out within our daily multiple inside bars.
Having pulled back 30% from all time high over the past seven trading days I'm anticipating a bull break as more likely that not, but correlation to sector leader Canopy Growth and the overall market will be worth keeping an eye on.
The range I'm watching is the low of Friday and the high of Friday, 10.86 - 11.40. Key daily support is 10.82, so any attempts to make an early entry by bottomfishing this range should have a stop loss just below that level.
On a bull break I would expect CRON to top out around $12.50-13.00 and then look for a tightening range on the daily chart. On a bear break we're looking down another 14% before our next support at 9.26.
For anybody playing CRON on the Canadian ticker, the setup is a little different. The range to break is 14.11 - 14.77. Key daily support is 14.05 so your stop should be just under that. On a bull break I would expect to top out around 16.00 and on a bear break we're looking down to test $12.05 support.
LONG on CRON - Parallel Channel and Falling WedgeI just took my gains on the short idea that I published on CRON -2.79% a couple days ago. Right now I believe the stock can bounce on the channel and price shows a falling wedge pattern. MACD is crossing as well and shows sign of a bullish opportunity.
I believe that the general sentiment on pot stocks is still fairly positive. However, there is a lot of speculation around it and I believe most pot stocks are way overvalued
Short on CRON - Divergence Technicals - CRON 9.78% broke out of a strong resistance today but failed to hold. Price is back within the parallel channel . In addition, RSI is diverging from price action. These are really simple, but strong bearish signals.
Fundamentals - Following the success of Tilray 38.12% , CRON 9.78% soared two days in a row, breaking new highs. However, no significant fundamental news within the company justifies such a jump in prices. I believe that the 560% change in price in 52 weeks is clearly an overreaction and could lead to a massive dump. Institutional investors are massively short on Cannabis stocks in general; CRON 9.78% is overpriced and will drop back down to the $9.13-10 level.
Cron high on WeedOur stock pick for today will be Cronos. Looks like a decent buy considering the hype around pot stocks.
As the dates gets closer to the Canadian Marijuana legalization(expected Oct 17), positive sentiments may drive this stock up. With alot potential growth and a rumours on Coke + Marijuana(Wild Dreams) this stock is one to watch.
Another counter from the same sector that interest us is Aurora Cannabis. Looks bright long term but high risk due to high speculation.
On a TA point. rebounded above $8 and looks like a potential break out. We will not put all our eggs on this but to diverse a small portion for big growth.
CRON bounce was by far the weakest of the major sector namesCRON low of Friday was just below the .5 retracement from low of consolidation to all time high 13.39. It had the weakest bounce Friday out of the big four, rejecting hard from the .382 dump retracement whereas other names hit the .5 or in the case of APH hit the .618. Watching the hourly chart for a break of it's tightening range to indicate short term momentum for this week, and helping to define levels for the daily tightening pattern on a macro level
CRON - Wait and See...CRON is in a Bull Pennant formation and could go either way. News is big factor with weed stocks right now. Legalization has been delayed, prices are going sideways. If this breaks up, looking at $15 for resistance at ATH's. If Pennant breaks down then green box is the buy zone.
Long CRON Swing TradeNASDAQ:CRON has been consolidating in this range for months now, creating a very noticeable Bullish Triangle.
Will be looking to enter at around $5.75 (triangle support).
Possible Outcomes:
- Triangle Breaks and follows thru to +- $8 area with a huge profit of +40%.
- Triangle fails to break , we fall back to the $6 (would sell before going bellow $6.30) where we sell for a small profit or breakeven. Do not hold on and make this a losing trade.
Share your opinion, comments and questions. Good Luck!
Risk Level: High.
I will keep updating this post.
CRON getting ready to bounce off lower points of resistnace and Cron might be about to 'get high' it looks like it is losing downward momentum on the MacD indicator, the RSI line is nearing the bottom and it is also getting closer to the bottom bollinger ban. It might still have a few days to go in order to hit bottom but price looks like it is already starting to level off from the down swing. Might be a good entry point. They recently reported Q1 earnings which didn't seem to blow investors minds very much, they were probably hoping to see a profit (turns our investors like profit) but there was massive growth in sales, just large growth in capex as well that ate away profit. So I'm not really seeing long term concerns that others may have, in fact the company is expanding operations. Unfortunately it just costs money to do that. The high PE ratio is a little icky, but they have pretty good liquidity. Over a hundred mill in assets. Debt to equity looks pretty good.