How to Use TradingView Alerts to Catch Momentum Shifts Here’s a quick video on setting alerts in TradingView.
I use alerts for stocks I’m interested in but want to give more time to set up. Instead of using a basic price alert, I prefer setting alerts on MACD crossovers to signal when momentum is shifting back in my favor. As a rule of thumb, the deeper the crossover, the better the value and potential momentum. Crossovers below the MACD zero line are particularly useful, especially for stocks that had strong momentum and were making new highs before pulling back.
This approach helps confirm that the stock has had time to build a solid base before I enter. TradingView will then send me an email alert or play a chime if I have it open, letting me track multiple stocks and setups without constantly checking charts. It’s also great for monitoring take-profit and stop-loss levels.
You can apply the same strategy with nearly any indicator on TradingView to time your entries and exits with more confidence.
Crossover

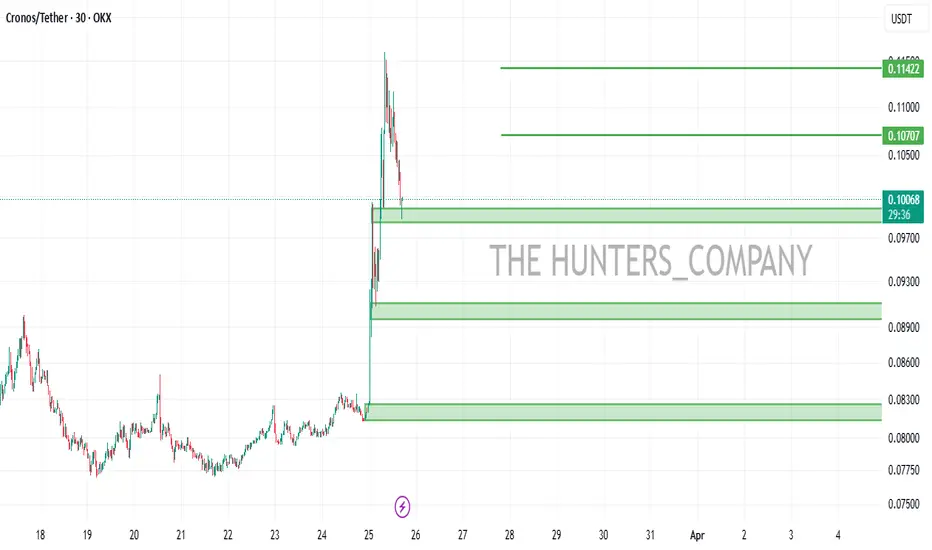
CRO/USDT : BUY LIMITHello friends
Given the good price growth, now in its correction, we can buy in steps with risk and capital management and move with it to the specified targets.
*Trade safely with us*
Best Intraday stocks technical analysis | 20 Dec 2024Technical Analysis of Moving average stocks (20/Dec/2024)
follow us for more updates and information
message us for any stocks related information.

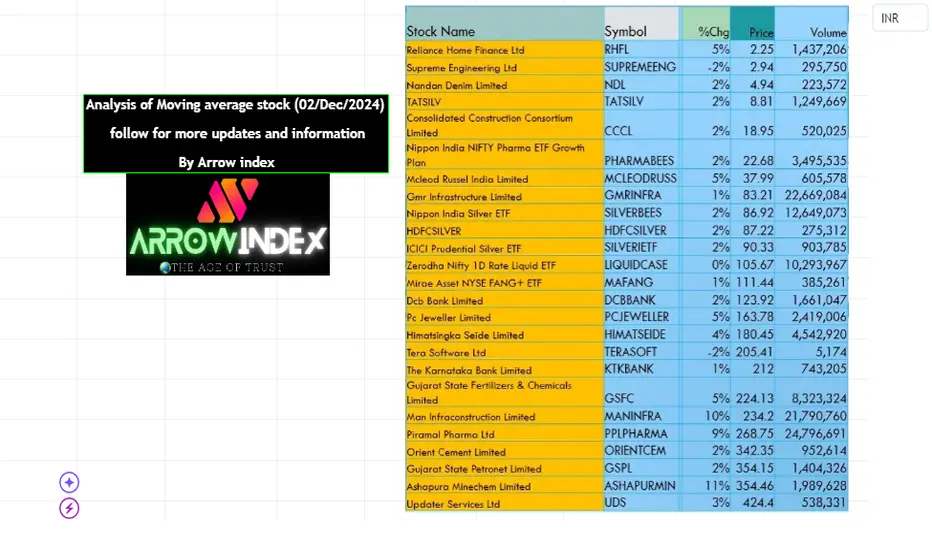
Analysis of Moving average stocks (02/Dec/2024)Analysis of Moving average stocks (02/Dec/2024)
follow for more updates and information
Analysis of Moving average stock (25/Nov/2024)Analysis of Moving average stock (25/Nov/2024)
follow for more updates and information

EURUSD: Dollar going stronger than EuroThe orange circle, shows the exact moment where, at the same time, ICEUS:DX1! crossed over CME:6E1! and the 200-sma was in the middle of this crossover.
The Dollar futures are gaining stregth while on the other hand, Euro futures are falling in price.
After the crossover, a strong bearish candle cross the support, the price remain in congestion with yesterday price closing at 1.10533.
Today the price is already below a support during early september and a resistance in the week after.
Indicators: Besides the 200sma. The RSI is projecting to go overbought or at least close, while DMI- is increasing the direction and ADX is confirming the trend strength.

MMM crossover SwingNYSE:MMM
Buying Oct 130c for 5.64
SL: 128.9
TP: 141
Max Date: Market Open 9/25/24

Fundamental & Technical Analysis on XAGUSD (Silver)Fundamental : Historically for Silver when Open Interest (OI) is going down it is a bearish signal and vice versa unlike other symbols. In this case Open Interest is decreasing which is Bearish, Commercial (Hedgers) Long positions are slowly going up while their Short positions seem to be slowly decreasing which is another Bearish confluence. For Non-Commercial the Longs have been lowering the past 5 weeks but unfortunately so have the Short positions which isnt exactly what i would like to see but I do believe they'll start increasing. Net Positions for Commercial has reached an extreme on the line chart at about -400K which is a Bearish signal and Non-Commercial has reached an extreme at around 300K, both of these extremes are aligned with the extremes seen on February 2020.
COT Report : cot-reports.com
Line Graph : cot-reports.com
Technical : The 5 EMA has crossed down the 20 EMA while Momentum is negative and the K% line on the Stochastic is underneath the 50% line.
Targets & Stop Loss : My stop loss is at Fib LVL 0.236 which is $29.470 on the chart. Take Profit #1 is at Fib LVL 1.272, Take Profit #2 is Fib LVL 1.414, and Take Profit #3 is at Fib LVL at 1.618. The rest of the Take Profits are at Fib LVLs 2, 2.272, and 2.618. At every Take Profit i will take half of my position off and leave the rest running, after Take Profit #1 is hit I move my Stop Loss down to break even.

NET Crossover Swing IdeaNYSE:NET
Planning to enter at open tomorrow so long as we are above 81.50
SL: 78.81 (just below today's LOD)
TP: 90.57 (just at/below resistance level and very near my ATR multiplier target)
Headwind/Trim: 86.91 (strong high test)
Max Date: 10/2/24 at market open
Planning to buy:
Oct18 82.5c for ~3.80

AAPL Crossover Swing IdeaNASDAQ:AAPL
Planned entry:
Anywhere near between 228.25 and 230.54
SL: 222.14
TP1: 233.09 (first touch of big supply)
TP2 237.23 (ATH's)
TP3: 245.87 (Ultimate target based on ATR multiplier for a 2.2 ratio trade)
Max Date: 10/2/24 at market open
Planning to buy:
Oct4 +230c / -235c vertical spread for roughly 2.14 with max gain of 2.91 at exp

CVNA Crossover SwingNYSE:CVNA
Daily crossover triggered
Planning to buy at market open on 9/17 so long as we are above 148.85 (HOD on 9/3). Ideally, we stay above 152.33 (HOD on 8/30, last trading day of August)
What I'm buying:
With the way that CVNA tends to move, I'm opting for a vertical debit spread here.
Sep27 +155c/-165c for a debit of roughly 3.30, and a max gain of roughly 6.70 at expiration, which is also the max date of this trade.
Using an ATR of 7.77, targets are as follows:
SL: 141.62
TP: 177.35
Max Date: Market Open of Friday, 9/27
^^As always, whichever of these hits first
Additional levels:
159.85 - Recent Strong high
179.24 - This level is above our TP, but note this level when looking back on the weekly chart

HOOD Swing Idea - short-termNASDAQ:HOOD is triggering the 5/10 ema cross on the daily and looks good in this spot here.
I'd like to see it get over the 50d SMA (20.63 currently) for added confirmation. If it opens above, I'll be buying at market open.
Using the daily ATR of .98, my exits are as follows:
SL: 19.26
TP1: Trim at 21.36 (some intraday supply here)
TP2: 22.83 start of supply zone
TP3: 23.69 only if showing signs of strength through supply, and only runner(s).
Max Date: Market Open of 9/24.
^^^If SL or TP levels have not been hit by max date, I'll exit at that time.
What I'm buying:
I like the Sept27, 20.5c's, currently 1.06, or a safer version is the Oct 20c at 1.86.
1hr chart showing small supply zone

XLK Crossover IdeaAMEX:XLK
Standard crossover idea:
Buying at open so long as we open or push above yesterdays close.
Looking at an Oct contract
Oct18 215c for roughly 9.7 (I'll try to buy at the mid)
Using the ATR of 5.7 -
SL: 215.89 (just below YLOD and 100d SMA)
TP1: 227.37 resistance
TP2: 232.17 supply zone test
TP3: 238.12 ATH's test
Max Date: Market open of 9/25/24
**As always, if targets are not met by max date, I will exit full no matter the p/l.
Also keep in mind that there are certainly more catalysts ahead next week with the rate decision.

ALGN Crossover Swing IdeaNASDAQ:ALGN
Crossover has triggered on the daily, which is a sign for entry on the next trading day (Monday). However, with this stock, I first want to see it clear 245. If you look left on the daily, this level was a gap and go spot, and has since been tested several times as both support and resistance.
Given that, if it opens above 245, I'll look for a pull back to that level, if it opens below, I'll look for a smaller time frame confirmation above it.
SL: 229.37 (just below Friday's LOD)
TP: 271 (Previous strong high and top of daily supply)
A safer TP would be the 265 area, which can also be a good trim level (start of supply).
Possible further headwind at 255
Max Date: Market open on Thursday the 26th
^^As always, if targets have not been reached by max date, I will exit at market open.
What I'm buying:
Not a high-liquidity options trader, but the Oct18 cons have some OI. I'm looking at a vertical debit spread, buying the 250c, selling the 260c for a debit of ~3.60 and max gain of ~6.40 (at expiration, if the underlying is over 260).
Roughly, the spread is expected to loose 1.81 and gain 3.67 on the Max Date

NVDA Weekly Crossover SwingNASDAQ:NVDA
I posted my NVDA daily crossover idea (see below), this one is the weekly (they have both triggered)
Additional Trigger:
No additional trigger needed here, although the daily swing triggers could be used for a better r/r.
SL: 100.29 (1.4 weekly ATR multiplier)
TP: 160.00 (3.2 weekly ATR multiplier)
Max Date: Week end on Friday, November 8th (yes, 8 full weeks!)
^^As always, which ever hits first
Additional levels to consider trims/rolls:
131.26 - Previous strong high, possible liquidity grab
136.15 - Previous high
137.90 - Supply zone touch just before ATHs
140.76 - ATH
150.00 - Possible psychological level
What I'm targeting to purchase:
Personally, I will be employing a deep ITM option strategy, where I look to roll UP at key levels, which is just another way of taking money off the table while remaining in the trade.
There are a variety of ways to play this trade, as it could take up to 8 full weeks before targets get hit (if they do).
I will be targeting the Nov contract with roughly an .80 delta (currently the 100c), and will look to roll up 5 dollars worth in strike prices (from 100c to 105c then to 110c, etc) each time the rollup would be a credit of 4.00 or more.
Like I said, many other ways of taking this trade, including just buying a further dated contract, ITM, ATM, or OTM and staying parked in it.
NVDA Daily Crossover Idea for further reference:

NVDA Daily Crossover SwingNASDAQ:NVDA
NVDA has triggered both the daily and the weekly crossover. Both can be approached as separate trades, this is just the daily outline.
Additional Trigger:
Only to try and get a better R/R based on the S&D zones, I would aim for an entry around Thursday's LOD (115.38).
A more safer approach would be the 114.11 test, which would be a .5 fib retracement from the previous Strong Low
SL: 106.60 (1.4 ATR multiplier, and just inside heavy demand zone)
TP: 135.57 (3.2 ATR multiplier and just below a possible liquidity grab)
Max Date: Market Open Thursday, 9/26
^^As always, which ever hits first
Additional levels to consider trims/rolls:
125.61 - Supply zone touch
131.26 - Previous strong high, possible liquidity grab
134.14 - Supply zone touch
What I'm targeting to purchase:
If we get the pullback to 115.38, I'd like the Oct18 115c for around 6.65 per con.
At max date, the con is expected to lose 3.89 or gain 15.10, based on original SL and TP levels.

RCL Crossover Swing IdeaNYSE:RCL
Buying at market open
Looking at the Sept 27 bull put spread of
-170p / + 165p for ~2.47 credit with a max loss of ~2.53
SL: 158.98
TP: 173.35
Max Date: Market open 9/25/24

$ELF Bouncing Past the 9 & 21 Day Moving AverageNYSE:ELF On average, technical analysts often observe that when a stock crosses above both the 9-day and 21-day moving averages, there is approximately a 60-70% chance that the upward trend will continue. Conversely, when a stock crosses below both averages, there is about a 60-70% chance that the downward trend will persist.
Here are some general figures:
Bullish Continuation: 65% probability that the stock will continue an upward trend after crossing above both the 9-day and 21-day moving averages.
Bearish Continuation: 65% probability that the stock will continue a downward trend after crossing below both the 9-day and 21-day moving averages.
These figures are generalized estimates based on typical market behavior and may vary depending on specific stock characteristics and broader market conditions. Always consider conducting specific #backtesting and analysis for the particular stock or market you're interested in for more accurate predictions.

BITCOIN: MACD bullish crossover is imminent.BINANCE:BTCUSDT (1D CHART) Technical Analysis Update
- BTC is currently trading at $61,400 and is showing an overall bullish sentiment.
- From a MACD perspective, a bullish crossover appears to be imminent, signaling continued bullish momentum for Bitcoin.
- The MACD crossover is observed on the daily chart following the recent correction due to recession fears. A confirmed crossover could renew optimism for Bitcoin, potentially pushing the price above the $70,000 barrier.
Follow our TradingView account for more technical analysis updates. | Like, share, and comment your thoughts.
Cheers
GreenCrypto

SUPREME INDUSTRIES TRADING IDEACup & Handle Breakout with good volume.
Stock can go as marked on the chart
Technicals
—Bullish Crossover
—Above 20 EMA
—Higher High breakout
—RSI 71
Fundamental
Stock P/E 44.2
ROCE 26.8%
ROE 21.0 %
Market Cap ₹38,226Cr.
educational purpose only!✨
Do your research before making any investment🥂

How to Read the MACD Indicator and Use It in Your TradingTechnical analysis is a vast field with thousands of indicators, which may be confusing to those among us who are just starting out. In this Idea, we look at one of the most popular indicators and also one of the easiest ones to fire up and start using from Day 1.
MACD (Moving Average Convergence Divergence)
MACD is arguably the most widely used indicator that can get slapped on virtually every chart out there. The indicator’s full name is Moving Average Convergence Divergence, but you don’t need to remember that.
If you need to take away one thing, it’s this: MACD is easy to read. Here’s how to do it.
Technical Side of Things
Add the MACD in your chart of choice — any chart, any time frame.
You’ll see three default numbers used to set it up — 12, 26, 9.
The 12 is the moving average of the previous 12 bars (also called faster moving average).
The 26 is the moving average of the previous 26 bars (also called slower moving average).
The 9 is the moving average of the difference between the two averages in play.
Next, you see that there are two lines that move up and down and cross each other occasionally. The two lines are:
The MACD line: the difference between the two moving averages and the “faster line”.
The Signal line: the moving average of the MACD line and the “slower line”.
Because the two lines measure price changes at different speeds, the faster one (MACD) will always run ahead and react before the slower one (Signal) catches up.
How to Trade with MACD
If all that sounds a bit complex, here’s the gist of it:
Faster line leads, slower line follows.
Faster line crosses slower line to the downside — a downward trend may be forming.
Faster line crosses slower line to the upside — an upward trend may be forming.
Technically, whenever a new trend is shaping up, the slower line should confirm it by following the faster line. And that happens when the two cross over. The way to potentially spot new trading opportunities is to look for the crossover.
This, in a nutshell, is how to read the MACD indicator and use it to help you become a more profitable trader. There's a whole plethora of MACD examples in action — dive right in !
Let us know your thoughts and experience with the MACD in the comments below!

XPTUSD has cross-over and shows short opportunity XPTUSD has broken its bottom trendline with a 3 EMA crossing over the 10 EMA to the downside. At the same time we're getting the EMAs crossing over the Stochastic is heading down and crossing over the 50% mark giving three confluences to look for shorts
Ill be targeting a 1% move down underneath a support i have drawn out on the 4H chart

Finding MACD Crossovers On TradingViews Screener 2.0The MACD is one of the most often used indicators by traders of all levels due to its ability to communicate a wide variety of signals such as momentum, value, change of direction etc.
Here is how to use TradingViews new 2.0 Screener to easily spot and get alerts for stocks that meet these conditions.
If I was to make this video again, what I would do is instead of showing stocks that have JUST crossed today. I would show stocks that have crossed but are still below the zero line - so they may have had a couple of days of momentum to show the strength of the change in direction.
You can of course take this same approach with pretty much any common indicator and settings you wish to apply.
Hope its useful.
