CRO (Crypto.com) $3 Target! Don't Miss This Move🪙 Ticker: OKX:CROUSDT
🕰 Chart: 1D (Heikin Ashi)
🔧 Tools Used: Fibonacci Extension, Fundamental News (ETF Filing)
🔍 Chart Analysis: Fibonacci Extension Targeting $3+
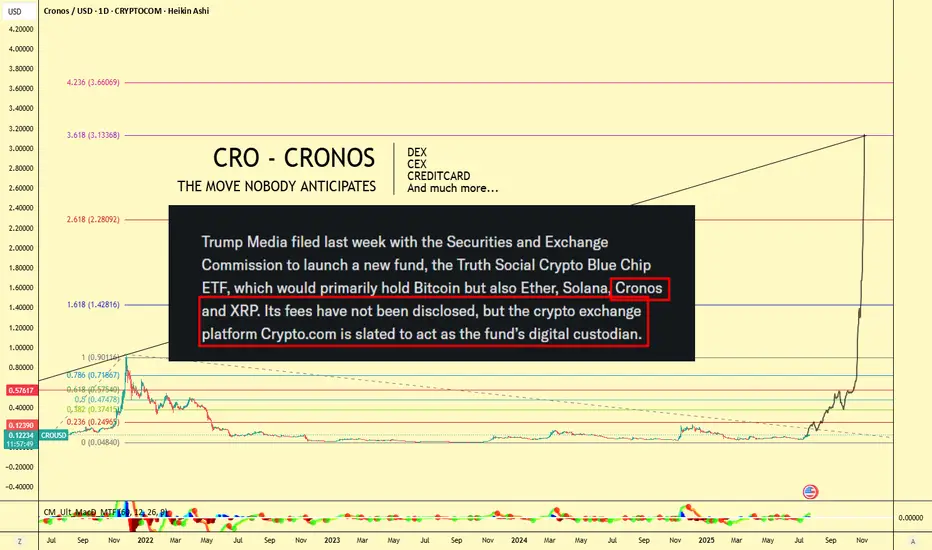
The Fibonacci Extension tool has been applied to the major CRO impulse wave from its peak near $0.90 (late 2021) to the 2022–2023 bottom at $0.0484, confirming a multi-year retracement and consolidation period.
Let’s break down the major Fib levels:
Extension Level Price Target
0.236 $0.2495
0.382 $0.3741
0.618 $0.5745
1.0 $0.9011
1.618 $1.4281
2.618 $2.2809
3.618 $3.1336
📌 Current Price: ~$0.12
🔥 Upside Potential to $3.13+ — a 25x move from current levels if full extension plays out!
📣 Fundamental Catalyst: CRO in Trump Media ETF
According to the chart note (sourced from SEC-related headlines):
"Trump Media filed with the SEC to launch a new ETF, the Truth Social Crypto Blue Chip ETF, which would primarily hold Bitcoin, but also Ether, Solana, Cronos (CRO), and XRP."
Even more important:
"Crypto.com is slated to act as the fund’s digital custodian."
This is massive fundamental validation for CRO — not just as a token, but as an ecosystem and financial infrastructure provider.
🌐 Why Crypto.com Matters: Utility, Ecosystem, Adoption
Crypto.com isn't just an exchange — it's a comprehensive Web3 ecosystem, which includes:
🔁 CEX (Centralized Exchange):
Buy, sell, stake, and trade hundreds of cryptocurrencies with high liquidity and low fees.
🔄 DEX (Decentralized Exchange):
Cronos Chain supports decentralized trading and DeFi apps — with low gas fees and EVM compatibility.
💳 Visa Credit Card Integration:
Crypto.com offers one of the most popular crypto Visa debit cards — earn cashback in CRO and enjoy perks like Spotify/Netflix rebates.
📱 Mobile Super App:
Buy/sell/stake/farm on-the-go with a seamless user interface.
📈 Earn & Lending Services:
Stake CRO or other assets for up to double-digit yields.
🤝 Strategic Partnerships
Crypto.com has been aggressively investing in brand and adoption:
🏟 Official partner of UFC, FIFA World Cup, and Formula 1
🏀 NBA’s Los Angeles Lakers Arena naming rights (Crypto.com Arena)
💼 Member of Singapore's regulated exchanges
🔐 ISO/IEC 27701:2019, PCI:DSS 3.2.1, and SOC 2 compliance — one of the most secure platforms in the industry
🧠 Conclusion: The Perfect Blend of TA + FA
With CRO being included in a potential U.S.-regulated ETF, the Crypto.com ecosystem booming, and technical patterns pointing to a Fib-based target above $3, CRO might be the sleeper play of the next bull run.
"The move nobody anticipates" might just be the most explosive one.
🎯 Short-Term Targets:
$0.25
$0.37
$0.57
🎯 Mid-Term Bull Targets:
$0.90 (prior ATH)
$1.42
$2.28
🎯 Full Cycle Extension:
$3.13
📢 Let me know in the comments:
Are you holding GETTEX:CRO ? What do you think about its inclusion in the ETF?
#CRO #CryptoCom #ETF #TrumpMedia #Altcoins #Bullrun #CryptoTrading #DeFi #FibTargets #CronosChain
CROUSDT
CRO 2x in 7 Days? Chart Hints at Explosive Move!📆 July 29, 2025
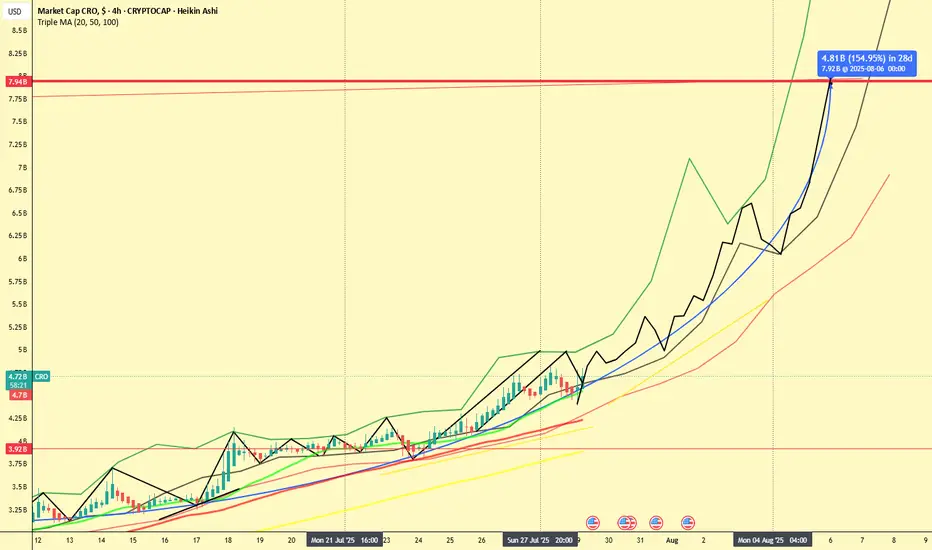
📍 CRO Market Cap (4H Heikin Ashi - Historical Projection Analysis)
If this chart doesn’t scream "Breakout Incoming", I don’t know what does.
CRO (Crypto.com) is showing signs of a massive 154% move incoming — and it might all happen within 7 days, according to the current market cap projection.
🔍 Chart Breakdown
The chart combines:
Heikin Ashi candles on 4H timeframe
Six SMAs (21 to 1000) showing steady incline
A historical path projection (green/black lines) based on earlier fractals
A measured move (blue arrow): from ~$3.9B to ~$7.92B by August 6th
This projection implies a 2x from current levels ($4.72B) — within just a week!
⚠️ 2 Healthy Corrections Already In
Let’s not forget: CRO already had two corrections within this structure — visible in the black zig-zag overlay:
End of July: Quick dip into the SMA cluster
Start of August: Second pullback before resuming trend
These retracements build confidence, as they typically reset indicators before major continuation.
📈 Momentum is Building
Price is respecting all major SMAs (21, 50, 100, 200, 300, 1000)
We’ve re-entered the aggressive uptrend channel
No significant resistance seen until the $7.9B area
🧠 Final Thoughts
Could CRO really double in a week?
If it follows the trajectory mapped by the historical fractal pattern, the odds aren’t as crazy as they seem.
Stay sharp. These setups don't come around often.
💬 Agree or disagree? Drop your thoughts and let's chart it together.
📊 #CRO #CryptoCom #Altseason #FractalAnalysis #HeikinAshi #TradingView
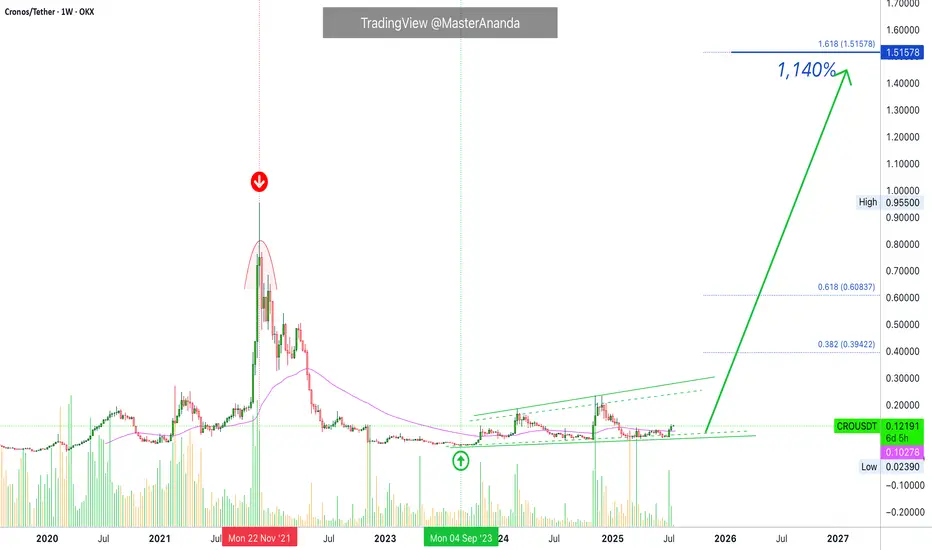
Cronos 2025/26 New All-Time High Revealed · PP: 1,140%Cronos has all the classic signals ready, confirmed and combined. RCC. And this opens the doors for a major advance which will not be shown fully on this chart. That is because I am using the linear chart for perspective but the log chart is needed to see all the major targets. Just trust, it is going to move very high in this bullish cycle run.
Good afternoon my fellow Cryptocurrency trader, I hope you are having a wonderful day.
Didn't I told you that you would see so much growth, that you will become complacent at some point? We are not there yet, but we will get there and you will have new challenges to face. Believe it or not, taking profits, using your earnings, will be one of the hardest things to do but the only right choice. A win is only a win when you close when prices are up.
Just as you cannot incur a loss unless you sell when prices are down; you cannot secure a win unless you sell when prices are up. When a pair grows 1,000%, you should take profits, period. When a pair growths 500%, it is wise to secure, 10%, 20%, etc. A plan is needed to achieve maximum success.
How you approach the market will depend on your goals, your capital, your trading style, which projects are available to you in your home-country, and so on.
A long-term investor does not need to sell, can continue to buy, accumulate and hold for a decade or more. Can you see? Each strategy is dependent on the person behind it.
CROUSDT · Trading weekly above EMA55 while still near the bottom. The bottom is revealed when we compare current candles size and location to the 2021 high price.
Last but not least, notice how each time there is a strong increase in trading volume the weekly session ends up closing green. Bullish volume is dominating this chart. A long-term accumulation phase.
Without further ado, the next and easy all-time high target is $1.51 but it can go much higher. Total profits reaching 1,140%.
Thank you for reading.
Namaste.
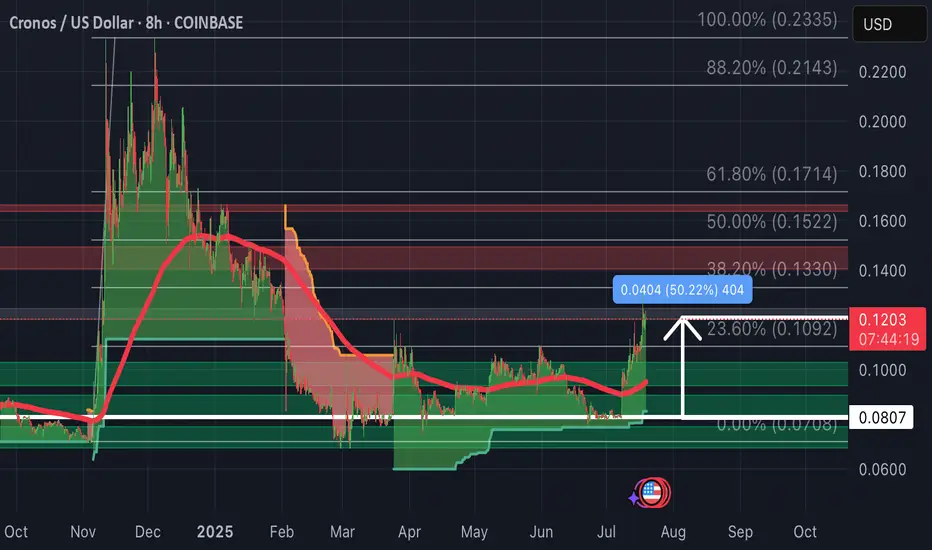
CRO-Update: Up 50% so far from February postThe took 5 months but we are up 50% so far.
Patience has paid off as price action breaks through resistance as it retest Fibonacci levels back towards 100% Fib Correction.
CRO surged after Trump Media & Technology Group filed for a “Crypto Blue Chip ETF” on July 8, allocating 5% to CRO. The ETF would track BTC (70%), ETH (15%), SOL (8%), XRP (2%), and CRO, with Crypto.com’s custodial arm securing assets. Approval would funnel passive institutional flows into CRO, driving demand.
Institutional tailwinds: SEC closed its Crypto.com review, boosting confidence.
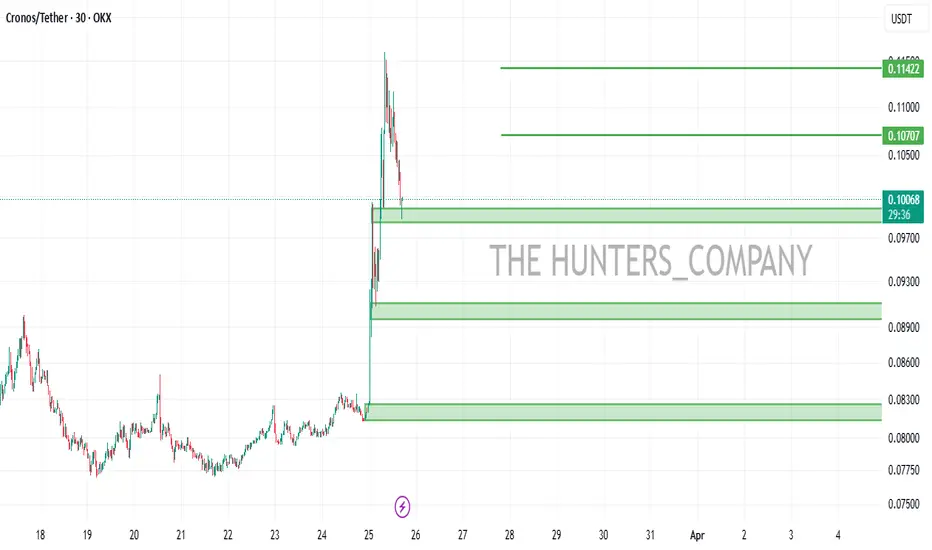
$CROUSDT Just Broke Out, Is a 130% Pump Coming?GETTEX:CRO has broken out above a long-term descending trendline and reclaimed the 100-day moving average, a bullish signal.
If it holds above this zone, the next targets are $0.1079, $0.1498, and potentially $0.2155, offering up to 132% upside.
Watch for a successful retest to confirm momentum.
DYOR, NFA

$BONK Breakout ConfirmedSEED_DONKEYDAN_MARKET_CAP:BONK Breakout Confirmed
The $1000BONKUSDT 1D chart shows a breakout from a long-term downtrend followed by a successful retest of the key support zone around $0.016390.
This area, previously resistant, is now acting as strong support.
If it holds, BONK could rally up to $0.040830, a potential 150% upside.
Invalidation occurs on a clean break below the support zone. Structure remains bullish for now.
DYRO, NFA

$USDT.D Rejeccted Again Altseason SignalCRYPTOCAP:USDT.D Rejected Again Altseason Signal
USDT Dominance is showing a clear rejection from the descending trendline and 200 MA, similar to the previous 16% drop.
The RSI is turning down from the overbought zone, signalling potential downside.
If this move plays out, we could see USDT.D fall toward the 4.0% zone, which is bullish for Altcoins.
DYRO, NFA

$CRO Breakout ConfirmedGETTEX:CRO Breakout Confirmed
OKX:CROUSDT has broken out of a symmetrical triangle after weeks of consolidation. A bullish MACD crossover and a reclaim of the 50-day EMA support the breakout. A potential 125% move is in play, targeting the $0.235 zone.
The chart shows that strong momentum is building.
DYRO, NFA

CROUSDT 1D AnalysisCRO ~ 1D Analysis
#CRO Buy gradually after successfully breaking through this resistance line with a short-term target of at least 10%++.

Cronos is on the move, Could we see it hit $1 soon?The chart is a weekly candlestick chart of CRONOS (CRO) against USD on TradingView, showing price action from late 2023 to a projected point in 2025. Let’s break down the key elements:
Price Movement and Trend:
CRONOS experienced a notable peak around mid-2024, reaching approximately $0.24000, followed by a sharp decline.
After the peak, the price entered a downtrend, forming a descending triangle pattern, which is typically bearish but can lead to a breakout in either direction.
The price has since stabilized in an "Accumulation Zone" between $0.07197 and $0.08925, with the current price at $0.08925 as of April 1, 2025.
Descending Triangle Pattern:
The descending triangle is defined by a downward-sloping resistance line (yellow) and a horizontal support line around $0.08925.
This pattern often signals a potential breakout. A break above the resistance could indicate a bullish reversal, while a break below support might lead to further downside.
The resistance line is currently around $0.13000 to $0.15000, based on the slope.
Accumulation Zone:
The price is in an "Accumulation Zone" between $0.07197 and $0.08925, suggesting that buyers are holding this level and potentially accumulating positions.
Multiple tests of this support level indicate strong buying interest, which could set the stage for a breakout if bullish momentum builds.
Target Projection (TG 1S):
The chart projects a target labeled "TG 1S" at $0.42000, a significant increase from the current price.
This target is likely based on the height of the descending triangle pattern added to the breakout point, a common technical analysis method.
However, reaching $1 (as requested) would require a much larger move, approximately an 11x increase from the current price of $0.08925.
Support and Resistance Levels:
Key support is at $0.07197, with the current price at $0.08925.
Resistance from the descending triangle is around $0.13000 to $0.15000, with a previous high at $0.17018.
A break above $0.17018 could open the door to higher levels, but reaching $1 would require sustained momentum and likely strong fundamental catalysts.
Historical Context and Feasibility of $1:
CRONOS reached an all-time high of around $0.96 in November 2021 during a crypto bull market, so $1 is within historical precedent.
However, the current market environment (as of April 2025) would need to see significant bullish momentum, possibly driven by broader crypto market trends, adoption of the Cronos ecosystem, or major developments in the Crypto.com platform (which CRONOS is tied to).
The $0.42000 target is a more immediate goal, but $1 would require an extraordinary rally, likely over a longer timeframe.
Timeframe:
The chart extends into mid-2025, and the $0.42000 target appears to be a medium-term projection.
Reaching $1 might take longer, potentially into late 2025 or beyond, depending on market conditions.

CRO/USDT : BUY LIMITHello friends
Given the good price growth, now in its correction, we can buy in steps with risk and capital management and move with it to the specified targets.
*Trade safely with us*
Cronos will reach 0.50$1. Price Action and Trend Analysis
Historical Movement (Late 2023 to Early 2025):
The chart shows a significant upward movement starting around late 2023, where the price of CRO/USD spikes sharply from around $0.0600 to a peak near $0.1800 by early 2024. This indicates a strong bullish trend during this period, likely driven by market sentiment, adoption, or other fundamental factors related to Cronos.
After reaching this peak, the price experiences a sharp decline, dropping back to around $0.0728 by mid-2024. This suggests a correction or profit-taking phase following the rally.
From mid-2024 to late 2024, the price consolidates, fluctuating between $0.0600 and $0.0800, indicating a period of indecision or accumulation.
Recent Movement (Late 2024 to March 2025):
Starting around November 2024, the price breaks out again, surging to a new high of approximately $0.1600 by early 2025. This second rally mirrors the earlier one but doesn’t quite reach the previous peak of $0.1800.
Following this peak, the price begins to decline, forming a descending triangle pattern (more on this below). By March 11, 2025, the price is at $0.08138, as indicated on the right side of the chart.
2. Key Technical Patterns and Indicators
Descending Triangle:
The chart highlights a descending triangle pattern, which is typically a bearish continuation pattern. This pattern is characterized by a flat support line (around $0.0728) and a downward-sloping resistance line (the upper trendline of the triangle).
The price has recently broken below the support level of $0.0728, which is a bearish signal. This breakout suggests that sellers have taken control, and the price may continue to decline.
Support and Resistance Levels:
Support: The $0.0728 level acted as strong support during the consolidation phase and the base of the descending triangle. However, the recent break below this level indicates that this support has failed, and the next potential support might be around $0.0600 (a previous low from mid-2024).
Resistance: The upper trendline of the descending triangle (around $0.1000 at the time of the breakout) acted as resistance. Additionally, the $0.1600 level from the recent peak could serve as a future resistance if the price attempts to recover.
Projected Target (Yellow Arrow):
The chart includes a yellow arrow pointing downward, suggesting a projected price target following the breakout from the descending triangle. In technical analysis, the price target for a descending triangle breakout is often calculated by measuring the height of the triangle (from the highest point to the support) and projecting that distance downward from the breakout point.
The height of the triangle is roughly $0.0872 ($0.1600 - $0.0728). Subtracting this from the breakout point ($0.0728) gives a target of approximately $0.0728 - $0.0872 = -$0.0144. Since prices cannot go negative, this suggests the price could approach $0.0000, but in practical terms, it might find support at a previous low like $0.0600 or lower, depending on market conditions.
3. Volume and Momentum
While the chart doesn’t explicitly show volume bars, breakouts from patterns like the descending triangle are typically more reliable when accompanied by high volume. If the breakout below $0.0728 occurred with increased selling volume, it would reinforce the bearish outlook.
The momentum appears to have shifted from bullish (during the rally to $0.1600) to bearish, as evidenced by the descending triangle and the subsequent breakdown.

CROUSDT 1WCRO ~ 1W Analysis
#CRO Buy back from here, if you still have a Conviction on this Coin with a target short term minimum 15%+.

Cronos To Grow 1,500%, 2,500% Or More In 2025The same August 2024 support that led to a 250% rise is being activated again in February 2025. This will lead to a new and very strong rise. This time the bullish wave will be many times bigger compared to previous ones. Instead of 250% we might end up seeing 1,500%, 2,500% or more.
Good afternoon my fellow Cryptocurrency trader, this is indeed a very wonderful day.
Notice the high volume present on the chart as support is activated with a higher low, technical double-bottom, and notice all the green sessions. Four consecutive 2D sessions closing green. That's big.
The new b-wave is already developing, already in the making. We have higher highs with a flat bottom, a perfect wide, long-term, bullish consolidation signal.
The first resistance is the upper trendline. This will be broken easily but once it is challenged it is sure to produce a retrace, either big or small. After the retrace, we will see additional growth and this growth is the one that is likely to reach 2,000%+ in the coming months, from bottom to top.
Patience is key. Buy and hold.
Thanks a lot for your continued support.
Namaste.

Crypto.com (CRO)Cro usdt Daily analysis
Time frame daily
Risk rewards ratio >5.3 👈👌
Nothing to say
Chart is clear
Red line is historical support line

Cronos (CRO) - Bullish Swing - ResurectionCOINBASE:CROUSD been mostly #Bearish, but things are about to change.
Eventually it found its bottoms.
That's when I loaded #Longs around the 6 and 7 Cents Levels.
Eventually I took profit on the #HODL #Trades at 19 Cents a pop.
* all well documented in the related idea.
What's Next for OKX:CROUSDT ?
As the #BreakOut is now confirmed, a #Bullish Swing is about to start.
That would be the #ElliottWave #Impulse (#MotiveWave).
#AltSeason has started, and MARKETSCOM:BITCOIN is adding fuel.
#AltCoins will most likely get pushed by the #BitcoinDominance ( CRYPTOCAP:BTC.D ) #Retracement.
#TotalMarketCap ( CRYPTOCAP:TOTAL3 & CRYPTOCAP:OTHERS ) are also showing signs of new #ATH coming.
COINBASE:CROUSDC #TechnicalAnalysis
- #ElliottWave A-B-C Sequence
- Primary ⓒ (white) #Impulse
- #Fibonacci Time Zones
- #Fibonacci Retracements Confluence
- #Cypher #Harmonic
My #Long Levels On COINBASE:CROUSD
HODL:
- Entry @ 14 Cents
- TP1 @ 40 Cents
- TP2 @ 60 Cents
#Futures ( CRYPTOCOM:CROUSD.P )
- Moderate Entry @ 14 Cents
- Conservative Entry @ 10 Cents
- TP1 @ 40 Cents
- TP2 @ 60 Cents

CRO - 4h - Accumulation RangeREMEMBER that a lot of investors sell stocks or crypto for fiscal conditions in 2024 to close the year.
For that, we have low buy liquidity , and even with that pressure on the price , CRO is trying to remaning in the same range as 1 week ago, so a breakout can restart a new HH , so patience.
Im bullish on it if the 0,17usd resistance its broken and became a support.

CROUSDT 1WCRO ~ 1W
#CRO This coin is still in a bullish trend. if you still have Conviction on this coin,. This support block would be a very good buying place for now.

WHAT IS TRUE...Hello friends
This coin is placed in a channel.
Now, according to the rising market, we have two scenarios:
1_ To break the channel from here and go to register new ceilings.
2- You cannot succeed in a channel failure and buy in the lower range that we specified.
There is another mode, according to the rising market, if the channel succeeds in a valid failure, we should buy a pullback.
Be successful and profitable.

Crypto.com coin (cro)Cro usdt Daily analysis
Time frame 4hours
Risk rewards ratio >1.5
Target 0.226 $

$CRO Breaks Out: Bullish Trend in Motion!CRYPTOCAP:CRO Breakout from an ascending triangle pattern and currently holding above support!
📈 Entry: Accumulate above $0.21
🎯 Targets:
Midterm: $0.32 (50% upside)
Long-term: $0.42 (100% upside)
🛡️ Stop-loss: $0.19
Available for both spot and futures trading. The pattern breakout confirms a bullish trend continuation. Manage risk carefully!
About CRO:
Cronos (CRO) powers the Crypto.com ecosystem, offering seamless payment solutions and access to decentralized finance (DeFi) tools.
Disclaimer:
This information is for educational purposes only and should not be considered financial advice. Cryptocurrency investments carry significant risk; conduct your own research (DYOR) and consult with a financial advisor before making investment decisions.
#Crypto #Altcoins #CRO

Trading opportunity for CROUSDTBased on technical factors there is a Buy position in :
📊 CROUSDT
🔵 Buy Now
🪫Stop loss 0.17200
🔋Target 1 0.22000
🔋Target 2 0.24500
🔋Target 3 0.29900
💸RISK : 1%
We hope it is profitable for you ❤️
Please support our activity with your likes👍 and comments📝

Cronos CRO In Trouble - BUY & HODLCronos can go bust, but even so, it's on Sale.
CROUSD / CROUSDT will go straight bull at one point.
So, I am still buying these poopy coins on each major fall they have.
Yeah, that's what I do.. putting my money into a black hole.
My next good BUY LEVEL: $0.03 .
Who knows, maybe I'll actually get rich.
My Technicals on CRO:
* Elliott Wave A-B-C Pattern
* Fibonacci Retracements
* Fibonacci Time Zones
* Double Bottom
* Cycle Analysis
* Bullish Divergence
Fibonacci Time Zones tell me that the beginning of '23 will be amazing!
