CROUSDT

CRO Rounded Head and ShouldersMust be looked at in a parallel fashion to observe the head as a Head
An observational post


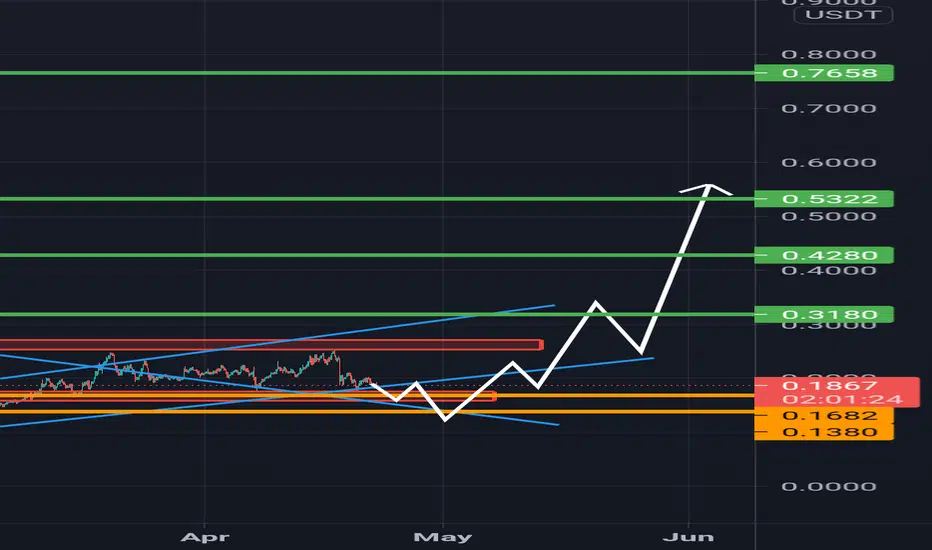
$CROUSDTMy views on CROUSDT -- I believe H&S pattern will form and completion of this pattern gives at least 25% return.

CROUSDCRO / USD rejected from the Fibonacci 618 level from where I bought and even now it closed above the Fibonacci 0.5 level and now I will look for BUY to the 0.22 area in the next period!
NOTE: Please, give a LIKE if you find this idea useful!
GREAT ATTENTION:
Our analyzes have an accuracy of over 91% but due to market manipulations during this period we will avoid putting exact values on SL!
We also recommend avoiding short-term trades during this period because news can appear at any time that can destabilize the market.
*This information is not a Financial Advice.

CROBTC MARCO TREND CROBTC MARCRO VIEW
Expecting increasing in volume
Bull support at 250-100
No Trend zone below 100
The 3D 100ema will be the primary resistance at 400-500
**First Macro target at 1500sats or the August 2020 Resistance
Second Macro target at 2000sats or the April 2019 Resistance
Third Marco target is at 3000sats or the March 2019 Resistance**
**Auto pilot mode above 3000sats**

inverse HnS4 hr looks like a potential inverse HnS close to breaking. target would be .22 cents
Wait for confirmation on HTF candle close. DYOR and GL!

$CRO Price movements Acending triangle will break to the upside, especially seeing the golden pocket entry becoming support here. Will fly up within the next week or two!


CRO:USD Uptrend Held BeautifullyAs you might have read from the title, the uptrend is clearly visible and it was held beautifully even during the recent selloff.
There is resistance at 0.24 that needs to be broken for further upside and then we have the upper trendline of this uptrend.
If we perhaps break to the downside then we have the following targets: 0.173, 0.165, and 0.15(ish).
We must see how the market turns in the near future and prepare our plans accordingly.
(not trading advice, I'm not your financial advisor, do your own due diligence)

CRO - Where Is The Money?Analysis:
- Liquidity Points
Liquidations: $0.25 & $0.17
Money Level Bulls: $0.27
Money Level Bears: $0.16
Money Level Bears: $0.14
Money Level Bears: $0.12
Opinion:
Markets seek liquidity in the form of stop losses aka liquidation levels
I have laid out the daily levels of liquidity for both the bulls & bears
If you are bullish then you should be buying at the lower money levels if we reach them :)
If you are bearish then you should be selling at the higher money levels if we reach them :)

Broadening Bottom patternA-B-C-D-E correction showing. Would expect a bit more of a dip based on this pattern, then a bounce out of the top trendline. Had shown an inverse H & S pattern between B and C steps, as mentioned in my previous analysis, but a sharp rejection occurred at ATH resistances @ D down into the current megaphone. Not financial advice.


Crypto.com Coin will bonus soonBuy after break ..
Target in chart
.
.
Stop loss Daily close under 0.2000
Good luck

CRO Massive Gains Ahead! - Fibonacci AnalysisCrypto.com token is looking strong!
It looks like there is a quick 25% return on the horizon and solid long term investment opportunity. HODL HODL HODL :-)
Buy Zone: Preferably under $0.20 ;-)
Take Profit #1 $0.2435
Take Profit #2 $0.2515
Take Profit #3 $0.2714
Disclaimer: This is not a financial advice. This information does not provide individually tailored investment advice and does not take anyone’s circumstances into consideration when discussing investments, nor am I registered as an investment adviser or broker-dealer in any jurisdiction. Information contained herein is not an offer or solicitation to buy, hold, or sell any cryptocurrency.

CRO/USDT 🦢Hey hey my friends 👋
CRO has great technicals and fundamentals to drive it, buy the ascending triangle breakout and hold on, if we get a pullback to lower trend-line that is a great spot to enter also 🚀
P.S. This can be found on Huobi or Crypto.com

CRO about to take off!Here's a quick look at CRO 4 hr chart. As we can see, the price broke out from the bigger symmetrical triangle and retested it. if it manages to break the breakout level shown in the chart, it is then very likely that we see new ATH! Keep an eye on this one!
The idea is: Buy the breakout from the level shown in the chart and Take profits at the levels shown in the chart.
Targets:
1. 0.268$
2. 0.3$
Follow me for daily profitable trading setups
BTC dictates the market. If BTC falls, then Alts will fall as well. Trade safe!

CROUSDT analysis on 4-H CROUSDT broke the resistance and now it is going to finished pullback on key level.
it has technically high potential to grow, search for fundamental news.
don't forget money management.
drop like to give us energy.


