cro long idea hello Traders, here is the full analysis for this pair, let me know in the comment section below if you have any questions, the entry will be taken only if all rules of the strategies will be satisfied. I suggest you keep this pair on your watchlist and see if the rules of your strategy are satisfied. Please also refer to the Important Risk Notice linked below.
CROUSDT

CROUSDT # 002 ( collect enough Energy to break every Resistance)Hello dear traders.
Good days .
On monthly Gann Square , First Gann Square cycle is about to finish .
Daily Bearish Gann Square exactly at reversal time zone is about to finish .
CROUSDT strongly hold Gann Square Fan line and get ready for break Gann Arc resistance and Gann Fan line @ same time .
As shows on the chart , in Daily bearish cycle CROUSDT Collect enough spring Tension to jump to beyond .
Chart updated and route plotted with help of Gann Square and Gann Box.
Good luck and safe trades.
Thanks for your support and comments

CRO/USDT what next possible move? 👀🚀CRO Today Analysis💎Paradisers, keep an eye on #CROUSDT as it shows potential in the current demand zone, gearing up for its next move.
💎 Observing #CRO, it's been adhering to a descending trendline. If it continues to respect this pattern and gains momentum from the demand level at $0.091613, we could see a bullish trend.
💎 However, if FWB:CRO fails to maintain this momentum and dips below the demand level, a bullish rebound from the lower support at $0.083025 is likely.
💎 Additionally, should it not hold the support, as astute traders, we must remain alert and ready to short trade as the situation demands. 🌴💰

Cronos (CRO/USDT)Testing Weekly Horizontal Support / Resistance Level.
About Cronos
What Is Cronos ?
Cronos (CRO) is the native cryptocurrency token of Cronos Chain — a decentralized, open-source blockchain developed by the Crypto.com payment, trading and financial services company.
Cronos Chain is one of the products in Crypto.com’s lineup of solutions designed to accelerate the global adoption of cryptocurrencies as a means of increasing personal control over money, safeguarding user data and protecting users’ identities. The CRO blockchain serves primarily as a vehicle that powers the Crypto.com Pay mobile payments app.
In the future, Crypto.com plans to expand the reach of the CRO platform to power its other products as well.
CRO went live in November-December 2018.
.....................................................................................................................
We are not registered or licensed in any jurisdiction whatsoever to provide investing advice or anything of an advisory or consultancy nature.
and are therefore are unqualified to give investment recommendations.
Always do your own research and consult with a licensed investment professional before investing.
This communication is never to be used as the basis of making investment decisions, and it is for entertainment purposes only.

CRO/USDT Uptrend from Demand? 👀 🚀 CRO Today analysis💎Paradisers, prepare for a promising shift with CROUSDT as it approaches a pivotal moment, rebounding from a resistance challenge with a bullish trend on the horizon.
💎CRO has consistently demonstrated a pattern of overcoming descending trendlines, suggesting a propensity for upward movement. Currently, after facing resistance, it's poised to embark on a bullish trajectory from the demand level of .7505.
💎Should CRO falter at the .7505 mark and descend, be strategic and patient. While some may rush to enter long positions, wisdom dictates waiting for the market to align with your anticipated entry point.
💎A further dip could lead to a bullish resurgence from the .6668 level, but a break below that could signal a significant downturn.

$CRO/USDT 2D (#Bybit) Broadening wedge breakout and retestCronos looks ready for a bounce back towards 100EMA resistance, probably after a last retest of demand zone.
⚡️⚡️ #CRO/USDT ⚡️⚡️
Exchanges: ByBit USDT
Signal Type: Regular (Long)
Leverage: Isolated (1.6X)
Amount: 5.1%
Current Price:
0.06290
Entry Zone:
0.06150 - 0.05340
Take-Profit Targets:
1) 0.07440
2) 0.08710
3) 0.09985
Stop Targets:
1) 0.04330
Published By: @Zblaba
FWB:CRO #CROUSDT #Cronos #CryptoCom #CDC #CEx
Risk/Reward= 1:1.2 | 1:2.1 | 1:3.0
Expected Profit= +47.2% | +82.6% | +118.1%
Possible Loss= -39.4%
Estimated Gaintime= 3-4 months
crypto.com

CRONOS - KEYLEVELS - DailyThese are my keylevels for CRO.
Now its testing the resistance line after the breakout of the descendent trend.

CRO/USDT potential shift ? ? 👀 🚀 CRO today analysis💎 Paradisers,get ready for promising opportunity with CROUSDT. Currently, it's showcasing intriguing movements within a demand zone, hinting at a potential upward shift.
💎 Not long ago, we noticed CROUSDT breaking free from a descending channel, embarking on a bullish path. Presently, it's revisiting the resistance of that descending channel, which has now transformed into a supportive base. Importantly, it's positioned above the EMA 200. We're hopeful that after a brief touchpoint with the EMA, it might commence its bullish ascent.
💎 Additionally, the VRVP is highlighting substantial volume, further bolstering the prospects of an upward trajectory. However, a word of caution: should the price not sustain its momentum and dip below both the EMA and the demand zone, we might see it gravitate towards a significant support level.
💎 Remember to employ prudent trading strategies and use proper stop-loss measures! Stay alert to market movements and look forward to more insight

CRO/USD 1DAY UPDATE BY CRYPTO SANDERS !!Hello, welcome to this CRO/USD update by CRYPTO SANDERS.
CHART ANALYSIS:- Cronos (CRO) continued to move away from a recent three-month low on Friday, after rising for a second straight session.
After trading at a bottom of 0.05072 on Thursday, CRO/USD surged to a peak of 0.05291 earlier in the day.
This move comes as Cronos bulls managed to avoid a full breakout below a support point at 0.0495.
One reason for this was the stability of the support point of 34.00 on the relative strength index (RSI).
the index is now tracking at 49.60, with the next point of resistance around 52.00.
In the event that price strength climbs beyond this point, CRO will most likely be trading around 0.05500.
I have tried to bring the best possible outcome to this chart.
Hit the like button if you like it and share your charts in the comments section.
Thank you

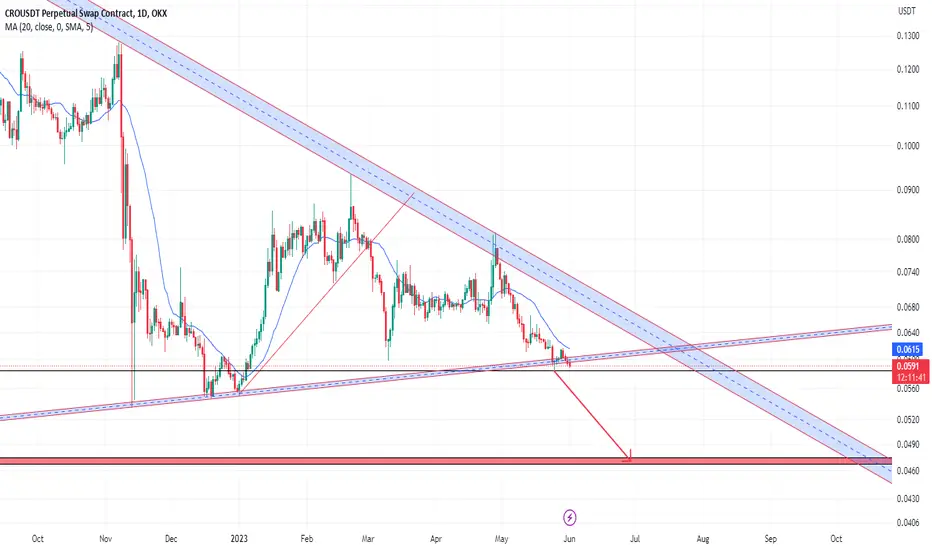
CROUSDTAfter pullback to broken trendline it goes down to redline drawn.
You can consider it as a triangle pattern.
CROUSDT Long Trade Idea (1H + 5m)1H:
- Price rallys downwards with momentum
- Price creates equal lows which is sell side liquidity
- This gets cleared as price moves lower
- Price also clears a major low, identifying a break of structure lower
5m:
- Price moves upwards with momentum, forming displacement
- Price clears multiple highs in this bullish move up
- Price forms a fair value gap (FVG) which is at a discount and this is where we go long
TP set to resting Buy Side Liquidity on 1H - 0.06040
SL set to the lowest low of the move upwards - 0.05604

cro crousd crousdt rising wedge Looking at cro as in the Day time we have a rising wedge. also a possible adam and eve that will take us to a measured move.
CRO: Resistance BreakoutCrypto.com (CRO) technical analysis:
Trade setup : Bullish breakout above 200-day moving average and Down Trendline (see chart) could signal trend reversal, with upside potential to $0.10.
Trend : Uptrend on Short-Term basis, Neutral on Medium-Term basis and Downtrend on Long-Term basis.
Momentum is Bullish (MACD Line is above MACD Signal Line and RSI is above 55).
Support and Resistance : Nearest Support Zone is $0.055. The nearest Resistance Zone is $0.075, which it broke, then $0.100, and $0.125.

CROUSD breaking out right - very bullishCROUSD is breaking out as we're creating this publication.
The key resistance of the downtrend has been broken and now the price can pump higher.
MACD looks good. We can observe increasing bullish momentum.
160 % upside potential
Take profit levels are shown on the chart
Good luck!

✴️ Cronos Starts To Recovery (333%- 700%+ Potential) | #OKXIdeasPlease, allow me to share with you another chart that is showing huge potential for growth; Cronos (CROUSDT).
This one hit bottom November 2022, right on this date we can see a massive increase in trading volume.
Volume hadn't move strongly since a year before in November 2021.
We can see the same pattern as repeated across the Altcoins market.
✔️ The initial breakout in January followed by a peak in February, then a correction that ends mid-March and now the resumption of the bullish trend...
We can say that the probabilities are high for the bullish trend to resume going back to the volume signal. Today we have the highest volume in months... This is supported by a strong RSI.
There are many resistance levels along the way, many targets on the way up.
Here I am mapping a potential mid to long-term ranging from 333% to 700%+.
This is not financial advice.
Remember to do your own research, your own planning.
Thanks a lot for reading.
Thank you for your continued support.
Namaste.

CROUSDT - Short Scalp- Price creates buy-side liquidity (BSL) on the 1H TF
- Price rejects sharply downward after clearing buy-side liquidity, breaking multiple lows on the 5m
- Price re-enters the bearish imbalance on the 5m fair value gap and this is where we go short :)
- TP set to 1H sell-side liquidity with a tight stop loss just above the 5min FVG

Pay Attention to CronosGood day, fellow traders,
Above the weekly chart for Cronos, position wise it looks like a bullish reversal is possible.
Looking at the daily chart we see further signals for a bullish continuation. We had decent sideways consolidation, with MACD and RSI showing plenty of room for upwards pressure.
The current entry is riskier because of the position within the structure, where rejection is always possible. Either wait for a pullback or trade the breakout. Obviously, market maker BTC can influence the momentum.
The fib 1 level of the a,b,c extensions should be the minimal target possibility.
having said that, you never see the order book so always confirm with your own research
Goodluck and have a nice day,
The Donkey:)

New idea for $CRO1. The strong bitcoin is trying to take the difficult resistance line, at the same time it can be considered as a flat movement.
2. Look at the bitcoin dominance, if it goes down, and the bitcoin will stand still, there will be growth.
3.Altcoin is now very far behind bitcoin.
4. Out of the bullish triangle formed, testing the trend line.
5. Follow your risk management!

✴️ Cronos 700% Potential MappedGood Sunday my fellow cryptocurrency trader, as usual, we have an over abundance of options to choose from, an over abundance of opportunities and also so many signals to look at, so much to learn, so much available for enjoyment and growth.
Cronos is one that I've been trading just because of its huge potential.
This one went through a full cycle and we can see a 100% correction that ended late last year.
From December 2020 to December 2022.
Massive growth in between and then everything erased.
Now that the "strong support" has been activated and conditions are favorable we are likely to experience another bullish wave.
✔️ 700% Potential mapped on this chart.
Remember to do your own research.
Your own planning.
This is not financial advice.
Namaste.

💁♂️ CRO/USDT 3D UPDATE ✅41% 🔥🔥
💁♂️ HI Everyone
As you can see, the price from the specified range has been associated with growth of about 41%🔥✅. It was mentioned in the previous analysis that the price may be associated with a positive reaction from the specified support range.
❎ (DYOR)...⚠⚜
WHAT DO YOU THINK ABOUT THIS ANALYSIS? I will be glad to know your idea 🙂✌
IF you like my analysis please LIKE and comment 🙏✌

✴️ Crypto Coin Easy 370%, See Why...CryptoCom is an exchange and centralized exchanges are the new banks, the current majority owners of the cryptocurrency space.
As much as we like or dislike them, they are a real force and here to stay.
Some are bad others are worst, some are not so bad but centralization is the norm.
They play massive games, pump and dumps, market manipulation to extract the deposits their clients make... That's just their way of doing business... Not all of them are the same.
Anyway, my point is not to disparage these entities but to show you what an amazing potential Cryptocom Coin has, in the form of the CROUSDT pair.
I don't want to exaggerate but I've seen this thing growing by thousands of percentage point... When this pair starts moving it goes stronger than Bitcoin Cash and Dogecoin... Well, Dogecoin did quite a number when it had its bull-run.
Knowing the huge potential, I can tell you that 370% is easy in the mid- to long-term.
Mid-term within 1-3 months.
Long-term within 3-6 months or more, can be 6 to 12, etc.
Short-term within 1 month (30 days).
I see this one growing and growing and growing specially after the strong bear market that just took place.
Right now we are still bottomed out.
Coming out of the stop-loss/liquidity hunt... Things are yet to start.
The doors are open for massive growth.
Namaste.

Cronos CRO Price Targets for this weekThis week I predict another selloff in the stock and crypto market after the CPI report on January 12.
My price targets for Bitcoin BTC are:
CRO/USDT short
Entry Range: $0.06 - 0.07
Price Target 1: $0.055
Price Target 2: $0.045
Price Target 3: $0.038
Stop Loss: $0.085

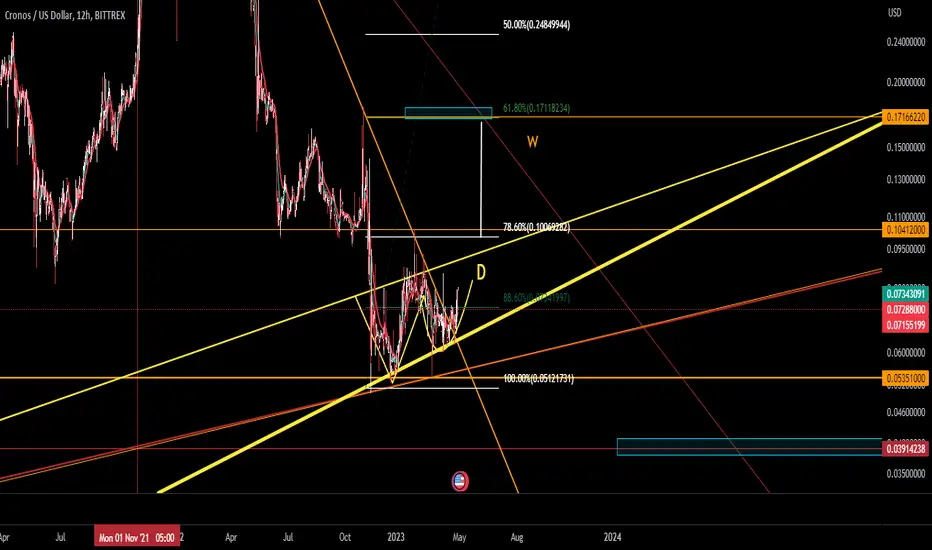
CRO / USDT 1W Interval ReviewHello everyone, let's take a look at the 1W CRO to USDT chart as the price is currently at the 2020 low and also looking from the 2021 high at around 95% down.
Let's start by setting goals for the near future that we can take into account:
First, the price has to break through the strong resistance zone from $0.0629 to $0.0876, only then will it be able to move towards the targets:
T1 = $0.1071
T2 = $0.1397
and
T3 = $0.1723
Now let's move on to the stop loss in case the market goes down further:
SL1 = $0.0571
SL2 = $0.0463
SL3 = $0.0376
and
SL4 = $0.0288
Looking at the CHOP indicator, we see that on the 1W interval, the energy is used for price decreases, the MACD is close to the intersection, however, it indicates an uptrend, while the RSI has been moving at the lower end of the range for a long time, which may indicate upcoming price increases.
