🎓#SpotTrade 🎓 $GNT / BTC 🎓 🔸Signal Info: Golem
Rank: #91
Direction: LONG
🔸Analysis: Golems year to date record looks stunning indeed. It has secured itself in the top 100 coins for now. The sell off following the 10k BTC rejection and the end of the altseason are fairly rough, but also gradual and steady.
The asset is up 58% ytd, Made a peak of well over 100% in February, and it has pulled back approximately 20% from the close of that high candle. We have seen three scattered daily green candles over the last two weeks, and todays candle appears to have broken through some kind of resistance at least.
Curved resistance lines were used here to bring emphasis to the gentle sell off. The price is moving off the 0.5 Fib line, almost to good to be true. Lines are pegged to the extreme wicks on the previous wave. Overall, this looks like a solid trade. We will keep the 3rd part open for some more extreme profits.
🔸Current Price: 621sats
❇️Entry: 621sats
🎯Take Profit: 744sats, 875sats, Open
🔸Stop Limit: 2590sats (-4%)
CRPTOCURRENCY


ETHUSD Has Very Strong Support Areas FormedThe key main support levels that are coming up are:
- $245 to $247 (minor support based on recent price action and also where the nearest ascending parallel channel is at)
- $241 (major support based on 50$ Fib Retracement Level)
- $237 (minor support based on past price action)
At the most what can happen is a scam wick where they dump heavily imediately, which is actually now allowed at exchanges but has been done to liquidate longers so less longers on the way up. In this instance the price will bounce back quickly. In this case, the lowest price point i think the scam wick can get to would be around $224-$227
Keep your margins healthy and only low leverage. Good luck.
Only trade what you can afford to lose. Nothing is 100% ever!

Bitcoin Holds Trend Line, Key Level as Golden Cross AppearsBitcoin just had its biggest drop since November, down 4.5 percent on February 15. It was a healthy pullback after a big rally, and it did little to break the cryptocurrency's recent uptrend. If anything, it confirmed most of the bullish bias.
Point 1: BTCUSD held a key price level around $9,500. That was a peak last October-November and again in late January. Old resistance becomes support. Classic uptrend behavior.
Point 2: BTCUSD briefly tested below a rising trendline that began in early 2020, only to bounce back above it. The bears tried to knock it lower, but failed. Another common bullish event.
Point 3: As BTCUSD consolidated in those areas, its 50-day simple moving average (SMA) rose above its 200-day SMA. That "Golden Cross" chart pattern is often viewed as an indication of longer-term trend turning higher.


XRP DTCC Dates line up with potential low of $0.21555I decided to add the DTCC Migration & implementation dates to the current trend chart that show a heavy point of convergence that may reveal the bottom of the current bear move.
We don't really know much about the new DTCC System, or if XRP is what will be used - but it is interesting that we are potentially going to have a potential low & buy opportunity in the approx time frame where this new system will be implemented... which also lines up with the starting point of a massive bull run for XRP. Too many points of convergence to be ignored.
1) Feb 21, 5pm -5EST DTCC System begins migration
2) Feb 24, 12:01am -5EST New DTCC System Goes Live
3) Feb 24, 5am -5EST Heavy Point of Convergence at $0.21555


Correction and future of Bitcoin Everything lines up for a 11300-11500 range correction back down to the trendline before the halving event , now we all know we are trading in the wild west, so i expect a scam wick up to 11750 before pulling back to the range mentioned above then breaking down to the trendline at about 8500 over next 40-50days.
Expected start of pullback would be at the end of this month down to the 8500-9000 trendline but it would only be in that range 48-72 hours before bouncing back up to 0.168 fib at 9500, this could be the best long entry on high leverage of all time.
Looking at the Fib Zone Times the week of July 6th seems to be a week where something big will happen this date also comes to the end of the 3 year triangle created by the bubble of december 2017 this week will put the spotlight on bitcoin around the world.
As the digital world comes ever closer i see the value of gold be used for things more like rocket ships(NASA) and true replacement to gold will be bitcoin because the new generation of humans will value pixels more over than metal, take one quick look at Epic Games and Fortnite that has brought in over $3 billion dollars of revenue in one year alone and the game is free, the new generation growing into the world will value digital assets much more than the current generation.
There is a massive paradigm shift of the economic world happening and bitcoin is that catalyst for that change.
Summary
11300-11500 correction starting March
8500 Trendline over 40 days
Bounce to 0.168 fib (9500) 48-72 hours after touching trendline
Week of July the big event ?


Time Warp Mushroom Trip Trading ideas :
Dates are weekly fib time zones
Short 9800 Feb 17th
Long 7800 March 2nd
Short 11500 May 25th
Long 9500 July 20th
Short 13500 August 24th
Long 11900 February 15th

XBTUSD: Long Support- Open CME Gap 8500 - 8600
- Good daily close
Longed from ~8550, targeting top of the purple range.
Information is just for educational purposes, never financial advice. Always do your own research.

LIKELY TO TEST & FIND SUPPORT AT $7788, AND BREAK THE TRENDLINE?I do not trade BTC but I follow it aggressively because it dictates other coins. However, the weekly time frame gives us a more filtered and clearer picture of where this coin may be heading. As you can see from the charts, this week's candle seems to be closing above a major resistance of $7788 which has served as strong support on several occasions in the past. Furtherly, next week will give us a vital hint on the direction of BTC as to whether we will break out above or below the trendline identified in the chart as well.
Please like, support and share your thoughts if you find this analysis helpful.

ALTS ARE GOING TO EXPLODEThis is not a drill, repeat not a drill altcoin season is about to start, when this monthly resistance is broken be prepared for insane gains. This aligns perfectly with the BTC.D chart 2020 your wildest dreams will come true.

At the EdgeTrend line still intact , if the trend line by the 15th of December is still holding expect a 15% move to the up side.

When Might Bitcoin Be Ready To Resume Its Bull Trend?Summary
•Potential Bull Flag continues to form, with Bitcoin falling as much as 52.9% from its 2019 peak.
•Nevertheless, a drop below the most recent low has Bitcoin next targeting the $5,900 to $5,427 price support zone.
•Recent weekly bearish moving average crossover adds to likelihood of further downside.
Bitcoin (BTC/USD) topped out at $13,868.44 in June of this year, thereby completing a 343.2% advance off the December 2018 corrective low of $3,128.89. That low ended a 1-year 84.3% decline off the bull market bubble top of around $19,892, reached in December 2017. Two weeks ago, Bitcoin completed a 61.8% Fibonacci retracement ($7,231.40) off the June high as it fell to a low of $6,526. That low put it 52.9% below the 2019 peak.
Bull Flag pattern
The price correction since the June high has been normal and well-constructed, forming a potential bull flag trend continuation pattern. This can be seen as the falling parallel trend channel in the enclosed charts.
Given the significant advance in the first half of the year, and the related signs of a trend change from bearish to bullish, Bitcoin has a good chance of eventually triggering a continuation of the new bull trend. The 2019 rally exceeded several prior swing highs and the 10-week exponential moving average (ema) crossed back above the 34-week ema.
Have we seen the bottom?
The question now is, has the bottom of the retracement been reached or might Bitcoin pullback further than it has so far? There’s no way to know this ahead of time but we can identify some important price levels to watch going forward.
As long as price stays above the $6,526 swing low, there is a chance for an upside breakout of the bull flag. If the falling trend channel is to further evolve and retain its general shape, a move up to at least the top trend line seems possible in the near-term.
A decisive daily close above the downtrend line is the first sign that a bullish breakout of the flag could be in the works. At that point, additional signs of strength will be needed. Watch for a daily close above the most recent swing high of $10,540.49 for confirmation of a bullish breakout. There is also a monthly high at $9,600 from November. Bitcoin has not had a move above a prior month high since the June peak. A move above a prior month high would be an additional sign of a change in the downtrend pattern, to an uptrend.
If we see further weakness
Alternatively, notice that the 10-week ema has just crossed below the 34-week ema, after being above it since early-May. By itself this is bearish, and supports a bearish scenario if Bitcoin falls below the most recent swing low, thereby triggering a continuation of the downtrend off the 2019 high. If that occurs, next watch for signs of support around the $5,900 to $5,427 (78.6% Fibonacci retracement) price zone, and then for indications of a bottom and subsequent bullish reversal.

BCHUSD SHORTI got 1.3% GAIN BCHUSD - SHORT
Why I enter a trade for short:
1) you should look 5 min chart - RSI was too high
2) BCH go for more than 3% up in wave 3
3) BTC going up but if you look at RSI It was more than 80
At the moment 4 wave forming and I'm waiting for another short at wave 5 if it will made ... I will see :)

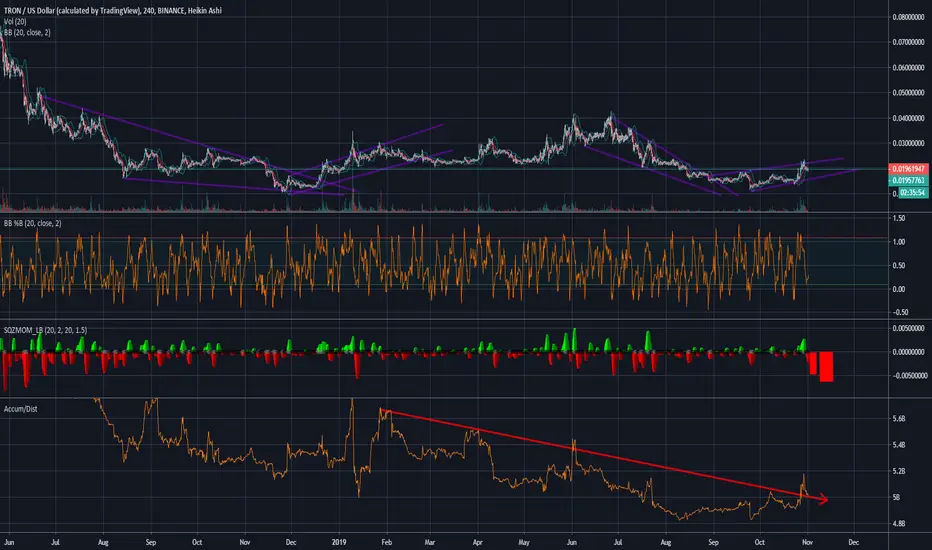
TRXUSD - The Bearish Facts, for now.The patterns I have highlighted concern me and I would also think that it might concern any trader considering a Long position. For now hold out as I expect TRXUSD to fall to $.01 support, once this bearish trend finishes. I do however expect TRX to consolidate and will begin to look Bullish again, pushing back up towards $0.03 resistance. So a Long position should be considered at a later date.
Regards
EWH

Following up previous call 7.7% in profit !So around 3 days ago I posted a call on WTC, I am looking for a higher exit price however so far I am up by 7.7%.

INVERSE HEAD & SHOULDER AFTER THE DIP? Bitcoin is gaining bullish momentum. Looking at this chart, price has jumped back on the bullish trendline. Not only that, but an inverse head and shoulders is formulating. Now would be a nice time to get in. Who knows if it will break the sky tomorrow? After all, bitcoin is expected to reach 6 figures. Now at 8K.

ETHUSD breakout soonEth going to break out of consolidation pretty soon. Trade the breakout. Bias is bearish. Tp and Sl given in chart.

10040 last chance to buy BTC Down to 10000-10100 then up breaking to the up side , its setting up for a huge move to the upside when global shorts are at its highest

Laters Bitcoin! Looking down! About to take a dive~!Bitecoin about bit off more than it could chew.... Couldnt break out. So many sellers. ALL CRYPTOS ARE DYING. No confidence.
Media regarding crypto is just BS no one is buying atm. The were gonna be rich Shaun - Your wife Samantha who bought bitecoin from cnbc coverage is about to get her wishing hat on... Denial to follow. Made a little rally big sellers are in, the fad had another little run. CRYTPO CONFIDENCE IS POOR ATM WILL HAVE TO SAY GOOD BYE FOR A LIL WHALE.
GOOD TIME TO SELL. RIP.
