BCH/USD, 1h, two spots to buy pullbacks2 days ago, BCH settled into to a small corrective structure (large red rectangle). As things played out, a well-defined resistance level became apparent and buyers kept buying in at relatively higher prices (red trend line).
Towards the end, an even smaller corrective structure formed and I was able to buy in with a limit order after price broke above and pulled back to it. This entry (at $1350) allowed me to set a tight stop and catch the breakout of the larger corrective structure. So far, I am up 5Rs (probably less by the time I finish writing this) but I think this trade could run so at this point I plan to hang on as a retest of the highs would be about a 14R trade.
This could play out a few ways:
Best case, BCH breaks resistance @ 1430, perhaps pulls back to retest, and continues on. A retest would be a good spot to have an order waiting. I will move my stop up after a solid break of this level.
Another possibility is that resistance at 1430 stops price and sends it back to retest 1370--this is strong support and would be a solid place to buy a pullback. Since my stop is already at break even, I will likely place another limit order here just in case.
If 1370 breaks on this timeframe that will a pretty good sign that the bears are back in control.
CRPTOCURRENCY

Attention! $Ebst PIVOTHello guys,
Thanks for reading my post. As you can see the at the little green flag there was a breakout in the past. Now we are hitting this Zone again in a very bullish uptrend! There are a lot of news incoming.
News in near future:
Okex Listing (Unknown, but planned)
fortnite tournament (Planned, no fixed date yet)
24th april texas government presention by Marshall Long (Gaming Director)
15th May AIRDROP $ALA Ratio 1000:500
Bitrex still not announced the support of the airdrop but likely will
Targets should be arround 4855, 8001, 10211, 12420, 15154, 19574
I will update new targets once we break 20k sat
All reasons to #hodl out

Bitcoin Falls to Trendline as ExpectedBTC hit the upward slopping trendline @ 7190 as expected. Now, if that trendline line doesn't hold, then look for a continuation downward to the 2 support zones, labelled 1 and 2.
The bulls are looking for price to move up sharpley as it did on Feb 6 of this year but it may move sideways for a bit as it did after the 9/15/17 low.
If price does move up, monitor the reaction at support zones A and B and see if they become resistance.
If you like this post, please click the Like button, tell your friends, and re-Tweet!
Disclaimer: This post is for educational purposes only. Trading is at your own risk.

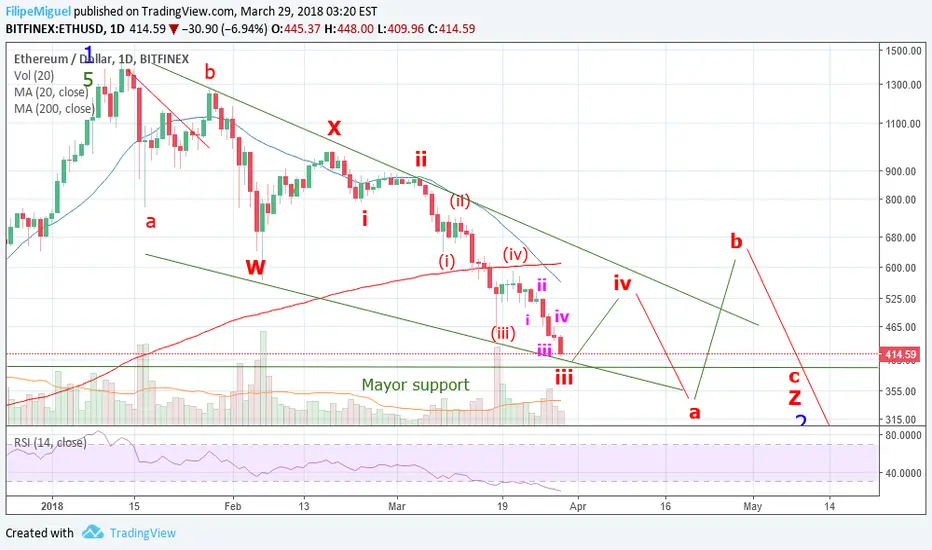
ETH short term - Downtrend will continueWith this new impulsive wave to the downside I must change a litle my primary count and turn it more berish in price an time. Expect some support in the 380's-400's. Let's see how will play my changes.

Bitcoin $8100 - $7500Price of Bitcoin has dropped as SEC (Securities and exchange commission) rules that crypto 'exchanges' will have to officially register.
Governments are closing their grips on crypto's.
Price revered at a strong resistance level of 11700$ accompanied by some bad news for crypto's this week.
Price still moving down a channel pattern with 2 strong support levels crossing between $8100 to $7500.


I'll take a bit of $QSP here #cryptocurrency #altcoins #bitcoinI would continue getting if it dips more in the near future

Quantamize Machine Learning 3-Day Forecast Ethereum ClassicQuantamize proprietary machine learning algorithms have generated a 3-day "Do Not Own" signal for Ethereum Classic.
Quantamize's machine learning algorithms produce signals on over 25+ cryptocurrencies with accuracy rates well above 60%.
Any updates to this 3-Day forecast will be shared, as signals are re-run daily.
We will be rolling out this product for 25+ cryptocurrencies as well as 4+ crypto portfolios, which can be seen our website in the signature below.

BTC - Price Re-Tests Descending Channel - Short Bias Still ValidPrice is once again re-testing the top of the descending channel where it has been rejected three times already and the stochastic indicator is also giving a sell signal. As long as price continues to respect the top of this descending channel the btc short bias remains valid. Target is still 5-6k.

BTCUSD | FUTURES TRADING - Intraday Levels S4 (+$2000)Hey Traders,
we've an Intraday setup which is bullish on BTCUSD so Forex/FUTUREs Traders can take an advantage with quick wave,
so, First let us understand how we plotted our Intraday Levels In accordance with our Stoploss and Target
1. L1 Purple Extension is plotted from all time High ($19900) to Recent.Lower low ($6000) - (0.382)
2. L2 Yellow Extension is plotted from H4 High - LOW - (0.786)
3. L3 White Extension from Recent Swing, (0.618)
All three extensions forms a derived area by emerging (0.382,0.786,0.618) as our Target and resistance area
Bullish sentiments - 200D. MA Crossover (Candle Type - H4)
Entry - CMP
TP - $11370
SL - $7720
have any doubts? than, let us know in the comment section below
and make sure to give this analysis a Thumbs UP +_+
Join our Telegram (link in BIO)
Source - General public Information!

EDO/BTC TREND ANALYSIS AND PRICE FORECAST| FEB 9 |EDO/BTC broke out of a long down channel and made a high of 32k sats. After doing some correction, the price is moving up back again and we can see a short term break out which can continue the upside trend. RSI has turned bullish while MACD is also showing a bullish divergence.
TRADE SETUP
BUYING RANGE : 31K SATS AND BELOW
STOP LOSS : 27K SATS
TARGET : 36K, 42K SATS
_____________________________________________________________________________________________________________________
DISCLAIMER : THIS IS NOT A FINANCIAL ADVICE BUT THE BEST POSSIBLE PRICE FORECAST ACCORDING TO US. PLEASE DO YOUR OWN RESEARCH BEFORE TAKING ACTIONS.
__________________________________________________________________________________________________________________________________________
FOLLOW US HERE :
YouTube : www.youtube.com (FOR HINDI/URDU)
Telegram : t.me
Twitter : Check out Coin Authority (@CoinAuthorityOG): twitter.com
STEEMIT : steemit.com
Good luck! :)

PPT Downtrend overPPT downtrend looks like it is pending a breakout and has also formed a falling wedge, a very BULLISH pattern in crypto.
buying the breakout or local swing high, selling on the way up.
risk: low
stop loss set at hard support (lowest white horizontal line)
falling wedge (wikipedia)
The falling wedge pattern is characterized by a chart pattern which forms when the market makes lower lows and lower highs with a contracting range. When this pattern is found in a downward trend, it is considered a reversal pattern, as the contraction of the range indicates the downtrend is losing steam. When this pattern is found in an uptrend, it is considered a bullish pattern, as the market range becomes narrower into the correction, indicating that the downward trend is losing strength and the resumption of the uptrend is in the making.


Bitcoin, Bear market? I don´t think so!!Hi Guys.
Here is an updated video of the previous B chart we posted. The price played out as expected and we do not see this as bearish is anyway.
Have a fantastic new years and may 2018 be our best year yet!

Vertcoin Drops, Breaking Ascending Triangle - 12-19-2017Ascending Triangle was broken last night with a big sell-off. Price declined sharply and found support at $8.61, a previous support level.
The Bollinger Band also provided support and price is not trading above the BB Midline, with another tag of the resistance level at $9.71 possible.
If you like this post, please click the Like button, tell your friends, and re-Tweet!
Disclaimer: This post is for educational purposes only. Trading is at your own risk.

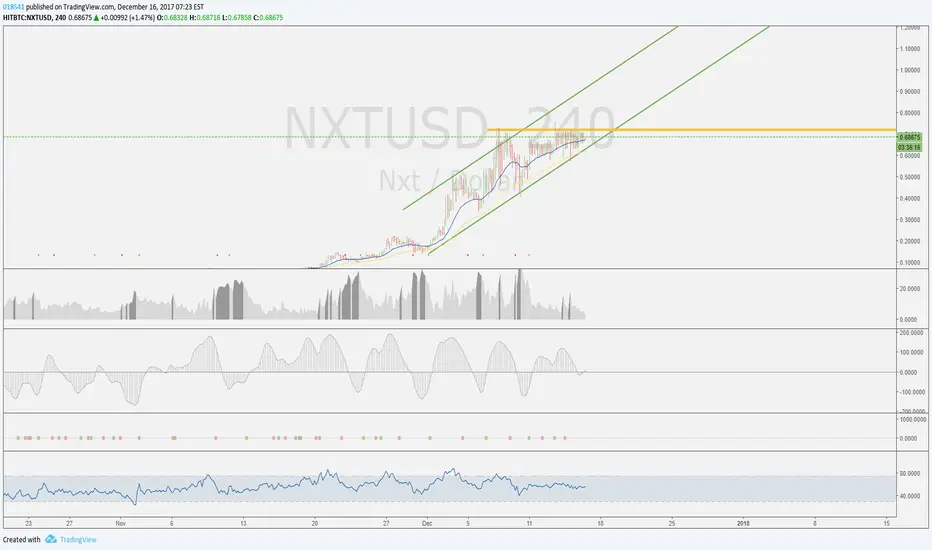
NXT is in an uptrend!NXT is in an uptrend. BITTREX:NXTUSD
Cryptocurrency is in an uptrend.
Breakout is likely to the upside.
OmiseGO. Target based on potential MarketcapToday, 13 December 2017 OmiseGO marketcap is 1.1 M
Expecting OMG between 8th and 6th on marketcap
this would mean ---> marketcap: 5 - 10 M
price --> 5x to 10x from today

Possible Head and Shoulder Pattern in Dash to USDBecause of the significant Low on the Volume on the Head and the upcoming retracement Bitcoin will make in my opinion because of the holydays and the CME Futures lunch it is possible.
The following days will show :D


Stellar/Bitcoin - Upside OpportunityHi traders, I hope you're all having a good start to your weekend.
Here I am analyzing Stellar/Bitcoin on the 1D chart.
Price recently had an impulse leg, and a small correction, and has now continued to the upside (See chart for details). I am expecting if that price breaks the resistance zone, that price will go to the highs.
There is a few scenarios for this trade and how it could play out. These are below:
Price corrects within the resistance zone (the zone it is in now) retests the downside side-wards support level at 0.0000056, and then rallies again creating the up move.
Price breaks the resistance without a correction. After breaking the resistance zone completely, then it corrects and retests the resistance zone as a new support zone before price moves to our target of 0.00001239.
Price stalls at resistance zone and price corrects and remains under the resistance level. We would be looking to other trades if this scenario occurs.
Bare in mind that price needs to either correct or break resistance zone before there is an active trade. With this in mind, do be sure to enter this trade only when one of the 2 scenarios has happened.
I will be updating this analysis below, so be sure to give a like & follow to keep up to date with my analysis.
