BTC TA for this weeksBtc did its previous bounce on the previous chart and pop back up Most likely have higher bulls coming in. Btc hitting 21500 and Break that to the top side. Simple Indicaters :RSI MCD 200ma
CRPTOCURRENCY

DXY - 240 MINS CHART TIMEFRAMEThe Structure looks good to us, waiting for this instrument to correct and then give us these opportunities as shown on this instrument (Price Chart).
Note: its my view only and its for educational purpose only. only who has got knowledge about this strategy, will understand what to be done on this setup. its purely based on my technical analysis only (strategies). we don't focus on the short term moves, we look for only for Bullish or Bearish Impulsive moves on the setups after a good price action is formed as per the strategy. we never get into corrective moves. because it will test our patience and also it will be a bullish or a bearish trap. and try trade the big moves.
we do not get into bullish or bearish traps. we anticipate and get into only big bullish or bearish moves (Impulsive moves).
Just ride the bullish or bearish impulsive move. Learn & Know the Complete Market Cycle.
buy low and sell high concept. buy at cheaper price and sell at expensive price.
Keep it simple, keep it Unique.
please keep your comments useful & respectful.
Thanks for your support....

BITCOIN Expectations for NFPBINANCE:BTCUSD
First of all I appreciate you checking out my content and will appreciate it more if you like (agree) and follow to get more notification when I post more update about this or other content in the Future.
Now let us get to it...
Since Fri Aug 26 Fed Chair Powell Speaks We have been having heavy drop in price in BTC and it played according to script (as I discussed in previous post you can check them out).. the heavy drop created a FVG where price retraced into and we have been consolidating so far in it. $17514 Still remain the objective on the daily. I want be surprised if they use NFP to push price down to this level and this can also happen over the weekend.
Trading, professionally done comes with having RULES, Strict rules that keeps you in the market place long-term.
Same logic nothing changed EVERYDAY

SHIBA INU is gaining momentum, patience is the key Since SHIB is one of the famous MEME coins, many retail investors tend to invest in it. So the whales behind it keep clearing those paper hands before driving up the price. When SHIB is pumping, its large green candle may ignore any resistance and keep pumping for a few days due to the hype. Therefore, SHIB's strategy would be to buy at every resistance line (price shown in the chart) and hold for the next bull run. Holding SHIB requires a lot of patience. After buying, just ignore the price and you might see a huge gain in your account during the next bull run.

BTC TABTC looks like it's going down to find. Support around $18,000 next. And we will see the next bullish run after finding support, using simple indicators to chart BTC. The simple use of RSI shows a more bullish analysis than bearish. Macd is showing bearish movement. We will see some sign of BTC move over the weeks.

SOLUSD - Short to $20 and then Long G'day Traders and Investors,
Note: Before reading this, I would like to declare that this is not a financial advice, I am not financial advisor. Any mentioned information is for education and entertainment purposes only and based on my trading and investing strategy. . I may or may not act according to this analysis.
If you like the idea, please like and comment. Many thanks for your support.
Cheers!
Jimmy

Sand More bullish then BearSand doing the same with ADA, and Matic movement. 3 of this coin will prob do a short run to some point Small TA for this one. Not a financial advisor. Post what your thoughts are would love to hear from you.

Ada Ta smaller time framesLooking at the smaller time frame ada getting lower over time. But seeing some volume at the resistants of .45 may see a short bounce back to the .55-.60 cent range. This is not financial advice just love doing TA for future references and coming back and learning changes through the cryptocurrency market. If Ada breaks below .44 can continue bearish to .39 for the next resistants. Please follow for more charts and thanks for supporting.

DYP double bottom easy bullDYP strong buy at the bottom reaching resistant. MarketCap of these coin is only 5million this one will move pretty fast because it only have 23million coins which 5.8million already burn which leaving a remaining of 17.2 million supply. This one have possible of doing 30x -100x down the line.

Bitcoin seems to make upwards direction After remaining in area of 18000 to 21000 for quite a time BTC seems to move in up wards direction as it has given a clear signal of breakout .
With proper stop loss target we can enjoy the new bullish ride

The most important chart in cryptoUSDT dominance continues to be the most important chart in crypto to look at. Its is so good and calling tops and bottoms and general moves in the market.
April 5th 2022 i posted this TA
The most important triangle of the year! guess what date the USDT dominance started its parabolic move April 5th 2022!
Bitcoin was 48k at the time, this is the most important chart to be looking at because it will call the exact time the relief rally will start or atleast a breakout into a higher range for Bitcoin maybe 22-30k range.
As it stands USDT seems to be hitting a wall of resistance , since July it has failed to break this level time and time again which is a very good sign that we are in fact bottoming out.
If USDT fails to break this resistance by 28th of July 2022 it will officially break the ascending channel which could trigger some sort of rally.
It is important to note that this ascending channel is within a much larger marco channel that I cover on other TAs.

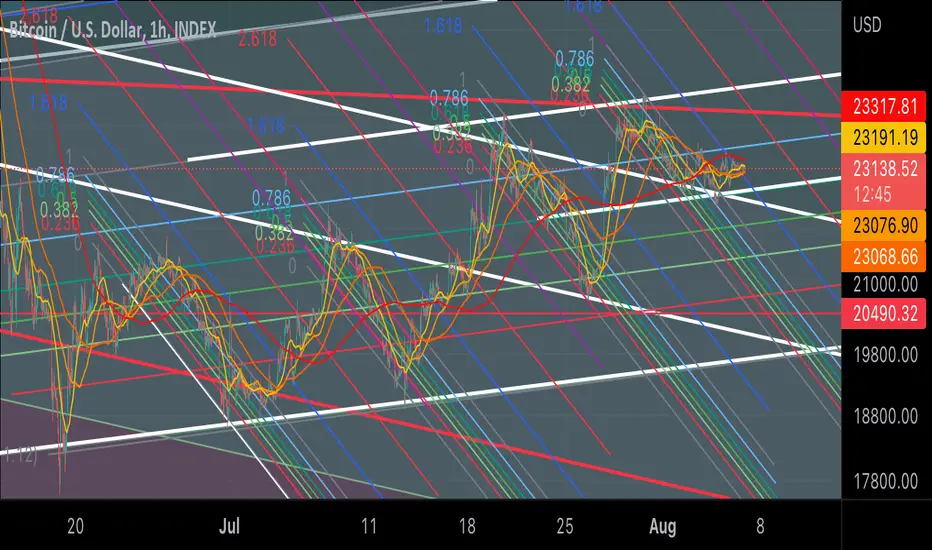
Nostradamus 101: BTC/EUR 4 months aheadYes, nobody knows what will happen tomorrow, but based on patterns we can safely assume that BTC has overheated.
Enjoy the next few months fellas, it will be a ride, FOMO campaigns non-stop, don't get fooled, just play your day-trade,
in and out, unless you are acquiring spot assets in which case HODL.
If I were you, I would wait for BTC to re-test the 47,000 area and then go short until 41,500, the rest is up to you.
This is not financial advice, just a prediction based on the audacity of bankers during the 2008 mortgage crisis and 2012
sovereign debt crisis.
Nothing is ever what it seems, but if you can use this prediction to your advantage, good for you. Enjoy. You're welcome.

Bear flag breakdown to 11.2k (BTC)Another bear flag with possible W formation on USDT dom chart ,hopefully its the last bear flag lol
Breakout USDT dom target would be previous all time high.

like market cap at 500,000,000like market cap is low and seems to following the same trend has mswap meaning like well have pump in the next coming dats not before passing point A then rising to point B then flying off to point c hitting new highs

The mathematical model of Hugh Math IndexThe mathematical model of Hugh Math Index
✅ What is Hugh Math Index?
It is a rule-based indicator designed to measure the overall growth of the crypto market by the market capitalization of passive investors
✅ Fund Manager
🔹 Mo'men Mohammad Jaradat
▪️ Institutional investor and developer of trading algorithms and investment research
▪️Has more than 7 years of experience in many financial markets
▪️ Worked on many scientific researches on financial mathematics and quantitative methods in investment decision making
▪️ He holds many professional certificates, the most important of which are EPAT, CFA, FRM
▪️ Previously worked with several research teams to develop machine learning algorithms for kaggle trading strategies
♻️ The main criteria for selecting the components of the index
🔰 Safety Standards
▪️The original must have more than 85 points by accredited security audit agencies
🔰 Liquidity Standards
▪️The asset must be listed on three central exchanges with a security rating of more than 7 points
▪️The weighted average monthly trading volume of the asset must be more than $100 million
🔰 Subtraction Criteria
▪️The asset must be publicly traded for a period of no less than 3 months
🔰 Exclusion Criteria
▪️ Stable Token
▪️Tokens (don't have their own blockchain)
▪️Coins under attack 51
▪️ Coins that have litigations with the US Securities and Exchange Commission (SEC)
✅ The investment methodology has been designed based on numerous academic researches by an independent working team, Mo'men Jaradat.
✅ More details will be shared to copy the investment at the time of the launch of the fund.

Cult Dao Breakout 30th June 2022cultdao.io
There is no control, no human interference whatsoever, we cannot change Cult, we cannot access the liquidity, we cannot upgrade or edit the smart contracts or the token. Cult is different because it cannot be stopped, not by the Guardians, the developers, the government,regulation or anybody.
cultdao.io
They can destroy the servers but the code lives on, the investments into Decentralised technologies remain.

Long trade to 35k2D setting up a springboard to possibly 35k medium term , bullish divergence building up for weeks now .
SL swing low at 26850
TP 25% at 0.382 and rest at 0.5 fib.
Longing mass fear is the play.


Algo Obvious patterns!Here is a update analysis on Algo. We about to see algo move up trend in the next few weeks. All blue arrows shows how long you should be holding algo for to profit. Algo have potential of hitting over $3 Rsi looks similar from all its previous lows. Make sure you do your own research before buying.

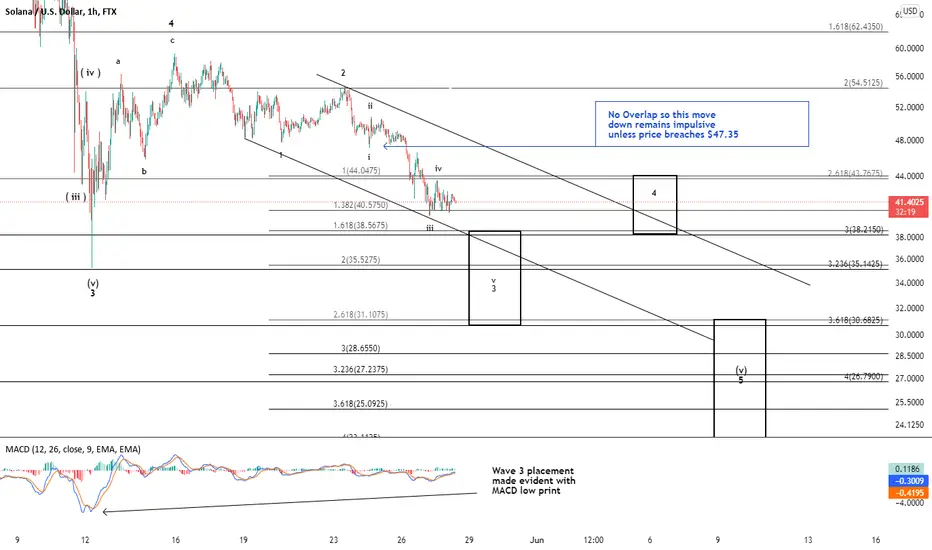
Weekend Update: Solana's Final Descent OutlinedIF YOU OWN, OR WANT TO OWN SOLANA, YOU WILL WANT TO READ THIS ENTIRE ARTICLE.
The above chart illustrates my analysis of Solana's final descent. First, let's start with what is not my interpretation.
Fact #1: We know we are in a wave 4
As a practitioner of Elliott Wave Theory there are signs that one looks for to immediately get your bearing as to where price is within a wave count. Whether the wave is impulsive or corrective, the MACD indicator provides all the clues needed to start labeling the various ups and downs of a price chart. MACD will print it's lowest (if move is down) or highest reading (if move is up) within the the heart of a 3rd wave (iii of 3) but only on the micro charts. On an hourly chart, (as above) that high or low print reading is consistent with the conclusion of wave 3. There's usually not enough bars, in contrast to a 3 minute chart, to register the minor wave iii. Therefore we know wave 3 has concluded. Since we all can count and 4 comes after 3, we know that is where we are within the wave theory analysis of this price chart.
NOT FACT...My Interpretation: Wave 4 is Done
Now technically I have no way to determine for a fact that wave 4 is done unless we have a breach of the wave 3 low and even then, how price is breaching the wave 3 low. Let me try to explain with an illustration the shear lunacy that a wave 4 can become. I consistently encourage my followers NOT TO TRADE A WAVE 4 due to complexity and opaque nature of trader's indecision in this area. The below chart is the SPX right before the COVID-19 Pandemic.
The red labels represent how price was progressing on the daily chart and the black labels represent how price actually reconciled.
After black wave (iii) we had a standard (red a,b,c) countertrend move which by all accounts was the conclusion of wave (iv). We knew this because price breached the black wave (iii) high in a 5 wave move (Labeled as Red Wave 1 on chart), followed by a 3 wave countertrend retracement (red wave 2). Things are progressing in text book fashion until price suddenly crashes and breaches red wave 2 bottom. This ceased to be impulsive and became a 3 wave move (which is countertrend) and thus reconciled lower than red wave (iv) in a devastating C wave for the final conclusion of wave (iv) in black. As an Elliotition the position stop would have been the red wave 2 bottom.
So, in reality with Solana I feel like it's 2020 all over again with the SPX about to be hit with the COVID-19 pandemic. We have to search for clues as to HOW price is progressing or retracing.
Case in Point: This is how I was counting Solana's daily progress as of mid April 2022.
Once we had overlap with my wave 1 up I posted to my followers that only bullish count left would be a leading diagonal which is a highly unreliable pattern. Subsequently it was not a leading diagonal and price has fallen precipitously since then.
As of right now, I have an ABC in place to complete wave 4 and no current evidence that price is about to rally in a C wave higher to complete an expanded wave 4. I originally thought that was how this wave 4 would play out. However, after taking the .786 Fibonacci retracement support area on May 26th, I choose to abandon that thesis and quickly informed my followers. As I have written about many times, I prefer to keep my chart labels simple until the simple is no longer rationally explained.
Therefore we should be experiencing the final machinations of a devastating decline that started in November 2021. As of now, I am expecting price to decline and ideally in an aggressive fashion as we should still be in a wave 3. If this is to end soon, an aggressive price decline is what I'm looking for. However, we decline is a very overlapping manner, this could portend a more complex pattern is emerging and things could get even worst as time goes on. As always I will update you twice a day Monday through Thursday, once on Friday and then with a Weekend Update.
IF YOU FOUND MY ANALYSIS HELPFUL PLEASE GIVE ME A THUMBS UP OR IF YOU DON'T FOLLOW ME BUT HAVE INTEREST IN SOLANA, MAKE SURE TO FOLLOW ME FOR THE LATEST PRICE ANALYSIS.
Best to All,
Chris
Morning Update: I'm in the Trade at $44.19First let me begin by saying thanks to the followers who took time out of their evening to reply and give me a thumbs up. I don't ask for feedback out of some narcissistic need to feed an ego. I want to see if what I'm contributing to Trading View is helping or is important to some people. In the absence of that knowledge I'm sure no one would find it unreasonable to look at reallocating my time. Thanks Guys:)
Back to Solana:
Last night I outlined a potential trade set-up. Go long in and around the .618 retracement area of the rally off of $35.30 bottom earlier in the month with a stop in place. The trade (albeit risky) has some technical merit because the .618 should provide something of a bounce. It doesn't mean a guarantee. I have written extensively about trying to keep my EWP perspectives simple. An ABC for wave 4 is simple. Could this wave 4 have concluded at $59...sure. My only problem with that being the conclusion is the amount of time it took. I would prefer a more pronounced wave 4. That's why we're risking $2 - $2.50 for the potential of $20-$30 points later on this summer. It's important to know clearly that I DO NOT BELIEVE SOLANA HAS BOTTOMED. Nothing has changed in my perspective. But if this wave 4 is a standard ABC then at this price level it's worth a shot.
If stops are triggered...DO NOT CHASE SOLANA. Risk management is in place to protect us. Discipline is the key to not losing a lot money in any market.
Best to all,
Chris
