$CRSP Consolidation Channel Long Right Now$CRSP has formed a perfect consolidation channel between $86 & $97. The daily squeeze momentum is turning positive after this 6 week consolidation and looks ready to make a move to new highs, potentially above $100 to $120. Long $CRSP and other gene editing stocks like $EDIT $TWST $NVTA $NTLA $CLLS which have very similar setups/positive momentum. Buy the 9/18 $100 calls for around $5 and stand to make out nicely on a breakout move above $100.
CRSP
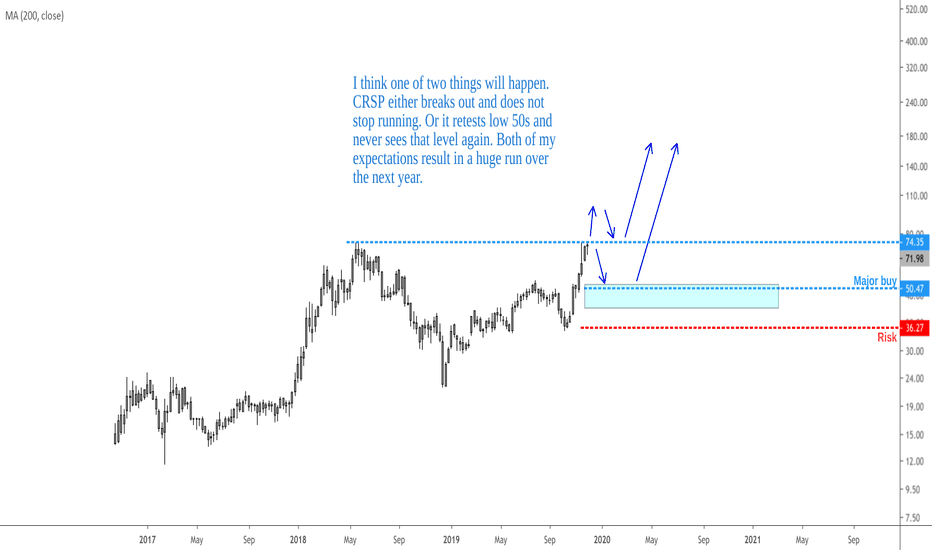
LINK and CRSP similar structureLINK and CRSP have very similar looking charts of a long term ascending triangle breakout that quickly occurred relative to the total length of the triangle. Both have strong fundamentals, each having their place in the 4th industrial revolution. CRSP is on a 2.2x slower timescale than LINK, so LINK may be able to foreshadow price targets on CRSP. Fib extension of denoting the triangle breakout level to be 38.2% of the projected peak, says that LINK may hit ~$10 (agreeing with the previous LINK and ETH comparison) in 2020 which would infer that CRSP could reach ~$140 by late 2020-2021.
PANDEMIA FACINGThis Company engages in the development and commercialization of therapies derived from genome-editing technology. Its proprietary platform CRISPR/Cas9-based therapeutics allows for precise and directed changes to genomic DNA . CRSP and Vertex creates new possibilities in medicine to cure diseases and improve people's lives. We work with leading researchers, doctors, public health experts and other collaborators who share our vision for transforming the lives of people with serious diseases, their families and society. The company itself still seems to manage and operates even we're facing crisis e.g. The COVID-19 pandemic.
Is CRSP trading in a descending triangle or bull flag?Key Takeaways
A descending triangle is a signal for traders to take a short position to accelerate a breakdown.
A descending triangle is detectable by drawing trend lines for the highs and lows on a chart.
A descending triangle is the counterpart of an ascending triangle, which is another trend line based chart pattern used by technical analysts.
Bullish flag formations are found in stocks with strong uptrends. They are called bull flags because the pattern resembles a flag on a pole. The pole is the result of a vertical rise in a stock and the flag results from a period of consolidation. The flag can be a horizontal rectangle, but is also often angled down away from the prevailing trend. Another variant is called a bullish pennant, in which the consolidation takes the form of a symmetrical triangle. The shape of the flag is not as important as the underlying psychology behind the pattern. Basically, despite a strong vertical rally, the stock refuses to drop appreciably, as bulls snap up any shares they can get. The breakout from a flag often results in a powerful move higher, measuring the length of the prior flag pole. It is important to note that these patterns work the same in reverse and are known as bear flags and pennants.
EOM.
CRSP - ascending fib channelWatching this one. Many stocks have entered this parallel channel pattern since the beginning of 2019.
Fib channel shows good heartline support.
It all depends on what happens with the financial system and stock market in general, but nice swings have been playing out here.
100% Buy Signal on CRSPThe Megalodon indicators are giving us a buy signal on CRSP Therapeutics! The backtesting results are 100% on this stock so don't miss out on these profits!
The Megalodon indicator uses a machine learning algorithm, combined with data from over 500 buy setups, and over 2000 indicators to produce extremely accurate buy signals on any and all asset classes! You will also receive real time buy and sell signals for the stock market, cryptocurrency, as well as forex markets! We also busy completed our cryptocurrency automated trade bot. It trades for you, using our backtested indicator with phenomenal results! So try it today!!!
Is CRSP going to "technically" break the bear trend this weekIn my previous post on #CRISPR I talked about the Green upward sloping trendline & how every time CRSPR has traded on or below it since May 2017 we've seen parabolic action.
I don't want to say I told you so, but we've seen some parabolic action.
To my surprise, the parabolic movement came the news of Vertex upfront payment of $175 million upfront payment. Specifically, Vertex gets worldwide rights for CRISPR/Cas9 technology along with other items such as AAV vectors for DMD and DM1. This deal totals just about $1 billion when you factor in all milestone payments for these programs, plus royalties.
Moving on to the chart now..
It appears as though CRSP is about to "technically" breakout of the bear trend which started in May 2018 after reaching ATH's.
The blue downward sloping trendlines are the attached to the swing highs, and one has already been broken to the upside, which could be considered the first real confirmation of a trend reversal. Once the second blue downward sloping trendline is broken to the upside CRSP is "technically" out of the bear trend, IMO.
Time will tell per usual.
CRSP continues to gain LONG With some investor conferences and earnings coming there is a good chance that CRSP can significantly pop up out of the channel again, or at least continue its upward trend.
I expect it to move into the new zone between $40.06 and $47.08 within a month and if it crosses over to remain above.
If it touches the ichimoku cloud I will back off as I can see it dropping or flattening out for a while if that is the case, but only waiting for it to clear above the cloud and continuing its climb to $50 usd.
Please like, share, or follow for more tips as I get better it is only going to get hotter!


