Crude Oil at Various Support Levels As you can see Crude is currently positioned on a 4/5 year support level which was first tested in May 2018.
As well as that it has reached the breakout point of the descending triangle and has perfectly placed itself on the 0.786 fib retracement level.
All of these indicate a bullish reversal in my opinion, however I wouldn't be surprised to see a bounce before those levels are broken to get rid of weak hands.
Let me know what you think!
Crude-oil

Crude Watching For Bids At The $75.00 TestIn this update we review the recent price action in the Crude Oil futures contract and identify the next high probability trading location and price objectives to target

WTI Crude Trading The ABC PatternIn this update we review the recent price action in the Crude Oil futures contract and identify the next high probability trading opportunities and price objectives to target

CrudeOil Futures ( CRUDEOIL1! ), H4 Potential for Bullish RiseTitle: CrudeOil Futures ( CRUDEOIL1! ), H4 Potential for Bullish Rise
Type: Bullish Rise
Resistance: 7676
Pivot: 6764
Support: 5832
Preferred case: On the H4 chart, we have a bullish bias. To add confluence to this, price is above the Ichimoku cloud which indicates a bullish market. If this bullish momentum continues, expect price head back up to retest the pivot at 6764, where the 50% Fibonacci line is.
Alternative scenario: Price may possibly head back down towards the support at 5832, where the previous swing low is.
Fundamentals: There are no major news.

Crude oil a leading inflation indicatorTwo observation made the last two years between crude oil and CPI:
1) There were 5 waves up and
2) 3 significant peaks
However, between the last 2 peaks of crude, it was a lower low follow-by its downtrend, and CPI followed this downtrend subsequently.
Among many commodities, crude oil moves the most in tandem with CPI, but crude seems to lead in this study.
Refer to the daily chart on your own, try drawing a downtrend line, you will see crude oil prices has broken above its downtrend line recently. If crude oil is going to transit to an uptrend from here, we will have to track CPI very closely. The inflation fear is still there.
Did a video on this observation last week, refer to the link below.
Crude Oil Futures
Minimum fluctuation
0.01 = $10
0.10 = $100
1.00 = $1,000
10.00 = $10,000
Disclaimer:
• What presented here is not a recommendation, please consult your licensed broker.
• Our mission is to create lateral thinking skills for every investor and trader, knowing when to take a calculated risk with market uncertainty and a bolder risk when opportunity arises.
CME Real-time Market Data help identify trading set-ups in real-time and express my market views. If you have futures in your trading portfolio, you can check out on CME Group data plans available that suit your trading needs www.tradingview.com

Brent Could Cruise to $100 Soon- Demand from China is soaring.
- The US dollar index has recoiled.
- Supply is not rising as fast as demand is.
- I think recession fears are overblown. Where I live, people are traveling like crazy.
- European Union will announce new Russia sanctions on February 5.

WTI Outlook 20/01/2023WTI remains firmer for the second consecutive week even if the intraday buyers retreat during early Friday morning in Europe. That said, the black gold slides to $80.95 while paring the daily gains by the press time.
In doing so, the energy benchmark takes clues from the recent stabilization of the US Dollar, as well as hawkish comments from the Federal Reserve (Fed) officials. On the same line could be the headlines suggesting the US recession and higher crude oil inventory build in the US.

WTI OIL: Rising on the 4H MA50Crude Oil is rising strongly today on the 4H MA50, recovering from yesterday's rejection on the 1D MA100. Both the 4H and 1D time frames turned bullish technically (RSI = 60.309 & 60.309, MACD = 0.770 & 0.890, ADX = 36.187 & 25.146 respectively) as the price is approaching R1. This is a strong Resistance Zone that has been intact for 2 months. On it is the HH 1 trend-line, which has three Higher Highs already.
The bullish trigger is above 83.40 with TP the R2 at 87.50. The bearish trigger is the 4H MA50 and HL 2 with TP HL 1 and S2.
## If you like our free content follow our profile to get more daily ideas. ##
## Comments and likes are greatly appreciated. ##
## Also DONATIONS through TradingView coins help our cause of increasing the daily ideas put here for free and reach out more traders like you. ##

WTI DAILYThis may come as a shock to all of you but we are at the lower end of the market historically, and we have begun to see the rapid decline of market trends.
Long positions are being made which is why we are seeing such a short market to buy up all the great pricing for a swing to the 100s in the mid-year rise.
this cycle will place us in new market highs pretty soon.

Crude Oil Trade Levels & TargetsIn this update we review the recent price in Crude Oil and identify the next high probability trading opportunities and price objectives to target

CrudeOil Futures ( CRUDEOIL1! ), H4 Potential for Bearish DropTitle: CrudeOil Futures ( CRUDEOIL1! ), H4 Potential for Bearish Drop
Type: Bearish Drop
Resistance: 7676
Pivot: 6764
Support: 5832
Preferred case: On the H4 chart, we have a bearish bias. To add confluence to this, price is crossing below the Ichimoku cloud which indicates a bearish market. If this bearish momentum continues, expect price to possibly continue heading towards the support at 5832, where the previous swing low is.
Alternative scenario: Price may possibly head back up to retest the pivot at 6764, where the 50% Fibonacci line is.
Fundamentals: There are no major news.

CRUDE OIL Short From Resistance! Sell!
Hello,Traders!
CRUDE OIL went up from
The lows to retest the
Key horizontal resistance
But Oil is already locally
Overbought so I think
That after the retest of
The level we will see
A bearish move down
Sell!
Like, comment and subscribe to boost your trading!
See other ideas below too!

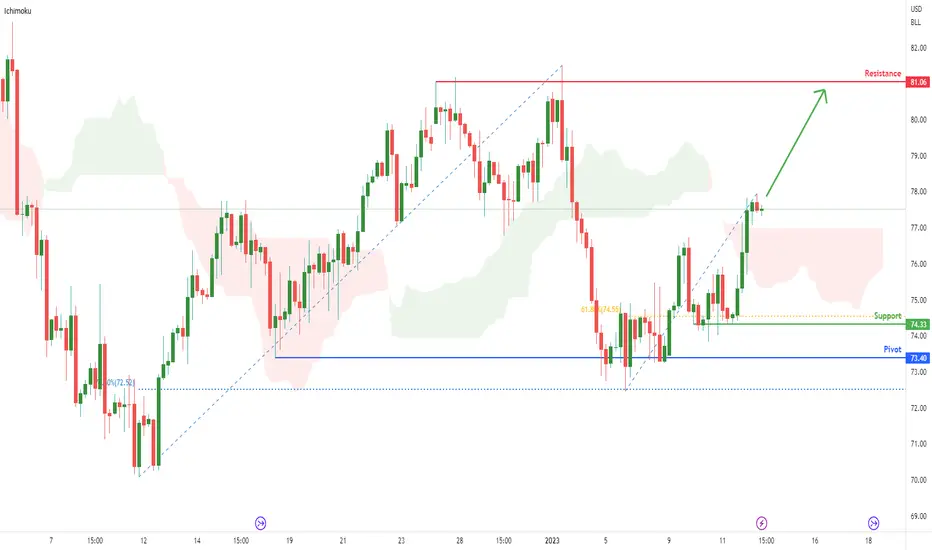
Crude Oil Futures ( CL1! ), H4 Potential for Bullish RiseTitle: Crude Oil Futures ( CL1! ), H4 Potential for Bullish Rise
Type: Bullish Rise
Resistance: 81.06
Pivot: 73.40
Support: 74.33
Preferred case: Looking at the H4 chart, my overall bias for CL1! is bullish due to the current price being above the Ichimoku cloud, indicating a bullish market. If this bullish momentum continues, expect price to continue heading towards the resistance at 81.06, where the previous highs are.
Alternative scenario: Price may head back down to retest the support at 74.33, where the 61.8% Fibonacci line is.
Fundamentals: There are no major news.
Trade Of The Week Brent Crude ShortJupiter Pendulum was tagged red so we found a short setup at red shade as per Jupiter Pendulum Theory
When the divergence formed and we got our signal candle, we had an entry

✅USOIL BEARISH BIAS|SHORT🔥
✅USOIL is set to retest a
Strong resistance level above
After trading in a local uptrend for some time
Which makes a bearish pullback a likely scenario
With the target being a local support below
SHORT🔥
✅Like and subscribe to never miss a new idea!✅

CRUDE OIL Bounces... how high?As previously mentioned, Crude was to break 76, and head down to a target of 67. It did break down below 76 decisively, but found a support at 70. And it appears to be bouncing off the 70 support level.
There are two main ranges and in combination, the yellow box denotes the current consolidation area over the next couple of months.
Noted the Bullish Divergence on the MACD, although the VolDiv (lower panel) is still showing some bearish momentum.
Expecting a (consolidating) bounce to 85-90, the latter being resistance.

BRENT CRUDE OIL BULISH PATTERNDemand for crude oil is expected to rise after a cold wave hit USA, which will likely increase the demand for oil distillates, easing of the COVID measures in China and US crude oil inventories coming up less than the analysts have had expected.
British crude oil benchmark, BRENT, had broken the resistance of the triangle pattern, a strong bullish predictor, and the price might reach levels of 87.5 in the next couple of days. In an event of reversal of the trend, the price might reach levels of its previous low of 75.35
RSI and MACD both are confirming the bullish outlook, with MACD histogram above 0 and rising and RSI rising as well and approaching the 50 neutral line.
Risk Disclosure: Trading Foreign Exchange (Forex) and Contracts of Difference (CFD's) carries a high level of risk. By registering and signing up, any client affirms their understanding of their own personal accountability for all transactions performed within their account and recognizes the risks associated with trading on such markets and on such sites. Furthermore, one understands that the company carries zero influence over transactions, markets, and trading signals, therefore, cannot be held liable nor guarantee any profits or losses.

USOIl Crude Oil important Support LevelWTI Crude Oil is at a key support level now and i don`t think we have seen the last of it.
OPEC+ unexpectedly decided to cut output in October by 100,000 barrels a day.
It`s not much for now, but they will continue cutting the supply until they will get the oil to $90.
I`m looking for a bounce to the $85 - $92 area before heading to $62 by the end of next year, when i expect the beginning of an electric revolution worldwide.
Looking forward to read your opinion about it.

✅USOIL POTENTIAL SHORT🔥
✅USOIL has retested a key resistance level
And as the price is already making a bearish pullback
A move down to retest the demand level below is likely
SHORT🔥
✅Like and subscribe to never miss a new idea!✅

Crude Oil 70.37 Target Hit, What Next?In this update we review the recent price action in the Crude Oil futures contract and identify the next high probability trading opportunity and price objectives to target

USDWTI D1 - Short Signal PendingUSDWTI D1 - Finally starting to see a bit of support here on crude oil… 76.50 is still out preferable sell zone, healthy correction from latest swing high to swing low, which ties is nicely with out preciously broken support zone.
Simply looking for the retest of that broken zone to position ourselves short, in aim of fresh lows.

Crude trader - closer to a mean reversion rally Having reached the double top target, we see that Crude is now 15% below from its 50 day MA - in the past 2 years we've been as stretched as 17% below this average before we saw solid mean reversion kick in - we are in oversold territory and that offers an elevated risk of short covering
By way of flow, we now see 67% of open positions in crude are now held long by clients, so they see upside - the selling pressure seems to be supported and the buyers are having more of a say.
Is price putting in a ST low? It seems to be the case - while we're yet to see momentum truly shift, it feels like the prospect of a squeeze higher has risen

WTI Further downside risk? Commentary:
WTI crude: The sharpe sell-off on November 28th may have strengthened the case for further weakness in the short term (5-25 days), the November 28th opening at $76.60 and intra day low at $73.93 followed by a closing price which was below the previous day’s high (November 27th) could be confirmation for a resumption of the November 7th - November 28th downtrend. Current price is below the 20 and 50 day moving averages (bearish); MACD is below its signal line (bearish); multi-week lower tops and lower bottoms on price indicate a downtrend (dow pattern), therefore, short positions can be technically supported for a potential downside target near the $70 round number, provided price can remain below the $83.4 resistance.
Not investment advice. Past performance is not indicative of future results.
