CRUDE OIL SHORT HH TO HL AND MARKET FORMATION crude oil sell position expected as for market formation double top along with HH TO HL HTF retracement
Crude-oil

crude downside ..double top break .. make retracement. now going downside first target 5290...as per fib extension..

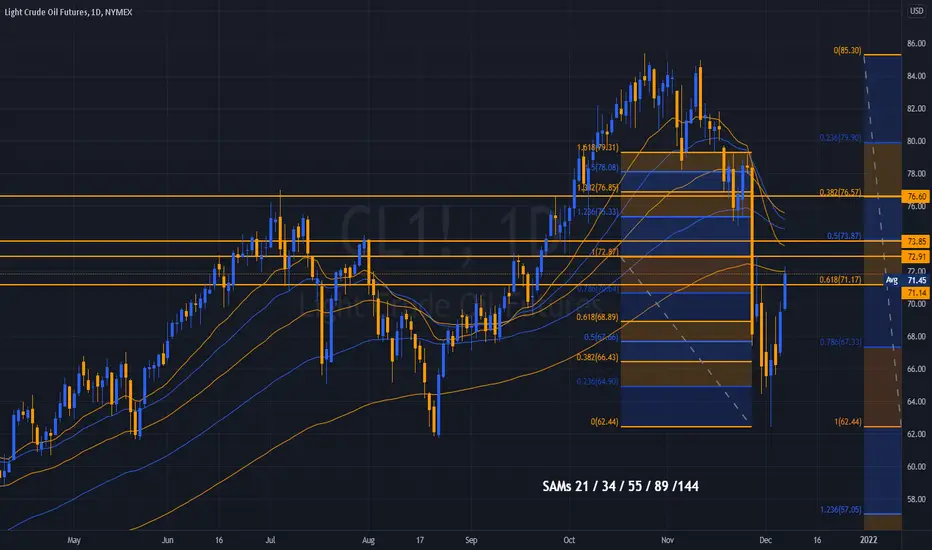
CL - SMA ChecklistCL is trading both FIbs ad SMAs.
They have a higher price in Trade, but
have gaps both Above and Below.
70.16 / 70.11 would be the Pullback,
but the BOts won't allow this until after
Lunch and the EU Session ends.
We took a small sell only to be stopped
take a $900 loss.
NQ a different story as we took a small
long there and enjoyed the run.
16400 is the New NQ Price Objective, we'll
see how CL responds as it is tracking with
NQ against the OVX.
____________________________________
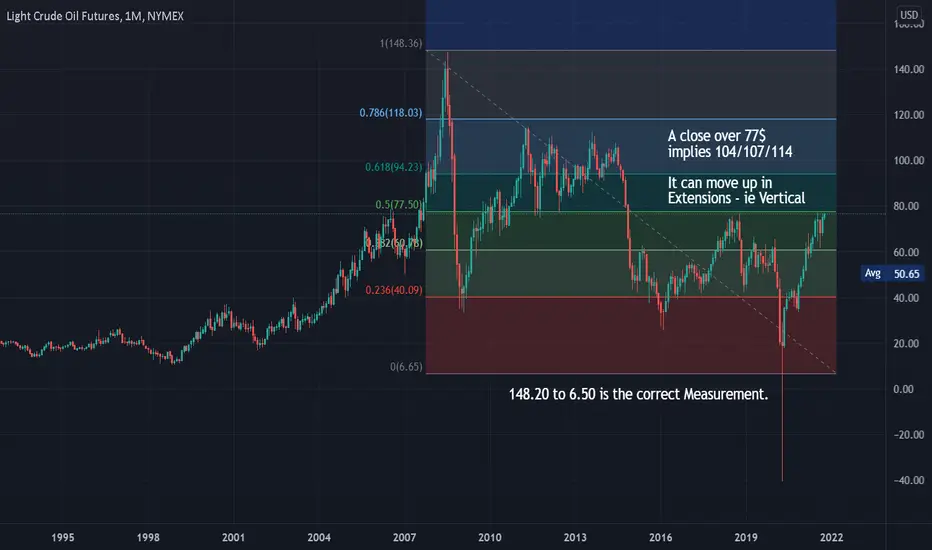
Crude Oil continues to trade vertically in Extensions.
One after another...
OVX - Crude Oil VolatilityThe current volatility is above historical volatility, traders anticipate higher volatility for
Price in the Short to Intermediate-Term.
Crude Oil WTI Jan '22 (CLF22)
66.26s -0.24 (-0.36%)
Crude Oil WTI Feb '22 (CLG22)
66.10s -0.17 (-0.26%)
Crude Oil WTI Mar '22 (CLH22)
65.93s -0.10 (-0.15%)
Crude Oil WTI Jun '22 (CLM22)
65.26s +0.02 (+0.03%)
Crude Oil WTI Dec '22 (CLZ22)
63.69s +0.26 (+0.41%)
_______________________________________________________________________________
Currently, the Term Structure for Crude Oil is in very slight Backwardation.
The Teem Structure is flattening somewhat - this will change in time, for now
it is in the Confidence Cycle interest to keep things tightly aligned, both Up and Down.
CL remains a hostage to further News Cycle surrounding OPEC's attempt to
support Price to the best of their abilities within reason.
They do not want to spook the Market but instead will attempt stability in the very short term.

Brent Crude - Further to Fall?Brent crude has been tumbling in recent weeks, forced lower by slowing growth, a coordinated SPR release and this past week, the new Omicron variant.
OPEC+ had an opportunity to arrest the slump today and at first, it appeared they'd passed up the opportunity. But the decision to maintain not change their planned increases each month came with an important caveat, that they would do so at any point if they think it's warranted.
In other words, they didn't have enough data to hand today but if that arrives at any point between now and the next meeting and warrants an adjustment, they'll do so immediately.
With crude off its lows and higher on the day, has it bottomed out? Possibly. But that will depend on the information that appears over the coming weeks and how bad it is for the global economy.
In the meantime, the price had been falling prior to the announcement but as you can see on the 4-hour chart, it was losing momentum all the time. So the caveat provided the excuse the market was already hoping for.
If it has bottomed for now, how big a correction can we expect? Or can we expect it to rally from here?
While we may see some tests around the 38.2 and 50 fib levels on the way up, the big test above here lies around $76.50 where the 61.8 fib on the 4-hour chart coincides with the bottom of the channel, 55/89-period SMA band and a major prior level of support and resistance. A move above here could put us back into more bullish territory.

CRUDE OIL Long From Support! Buy!
Hello,Traders!
CRUDE OIL fell sharply and lost almost 28%
But then the price hit a strong daily strucutre
And a bullish reaction followed
I think that the level will hold
And if you take a look at what is happening
On the lower timeframes, you will see
A kind of a bullish wedge pattern
So after a potential retest of the level
And a breakout of the wedge
I belive oil will go up again
Buy!
Like, comment and subscribe to boost your trading!
See other ideas below too!

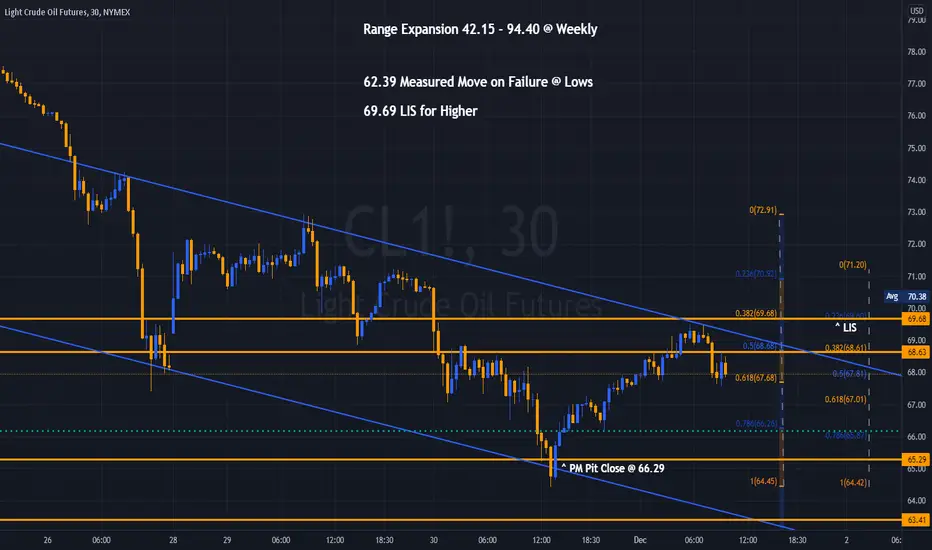
CL - 1 HourEIA @ 10:30 AM EST
Solid Range for Trading.
69.69 remains the Over / Under for Intra-Day.
A squeeze into Resistance should be considered.
Technical analysis update: WTI oil (25th November 2021)USOIL seems to stabilize in range between 75 USD and 79 USD. Currently, it trades around 78 USD; and we are closely watching technical indicators as they continue to point to the bearish condition. Current state of oil coincides with the recent set of bearish news regarding realese of the strategic oil reserves by the U.S. and its allies. We do expect the OPEC to take counter measure in response to this action. We think this will most likely take form of lessening production quotas for OPEC's members. We still think that in long-term price of oil is headed higher. However, in short-term and medium-term ongoing politics between the OPEC and the U.S. create headwinds for further rise in price of oil. Despite that, we expect OPEC's counter measures to bolster bullish case for WTI oil.
WTI oil continuous futures chart and volume:
Volume continues to decrease which suggests that selling pressure cools off.
Other developments in a world thatt are related to oil market:
1. First snow in Europe drags power prices higher.
2. EIA reports that crude oil inventories rose slightly last week with inventories of gasoline falling.
3. UN Nuclear Agency failed to reach agreement with Iran last week.
4. Oil markets take relatively well release of strategic oil reserves.
Technical analysis - daily time frame
RSI is very bearish. MACD is also bearish but it started to show first signs of flattening. Though, it needs to be closely observed for next action in the following days. If it manages to reverse to the upside and cross above 0 points then we will view it as very bullish development. Stochastic remains in bearish area, however, it managed to reverse and it currently points to bullish direction. It also needs to be observed closely in the following days. If it manages to oscillate higher then we will view it as bullish development. DM+ and DM- remain bearish. ADX suggests that prevailing trend is very weak.
Technical analysis - weekly time frame
RSI exhibits divergence in its medium-term structure. We will observe it in the following weeks and we will look for its ability to reverse back into bullish direction. MACD remains in bullish territory, however, it keeps moving sideways (bearish histogram is forming today). DM+ and DM- remain bullish. ADX continues to decline which suggests that trend is weakening.
Divergence in RSI:
Double divergence in RSI is not particularly bullish development. We will observe action of RSI very closely in the following weeks as it flashes warning signs at the moment.
Support and resistance
Major resistance level sits at 85.39 USD while major support level sits at 61.58 USD. Support 1 is at 76.95 USD, Support 2 is at 75.47 USD, Support 3 is at 74.21. These supports act as short-term levels of importance. Additionally, yesterday's high at 79.20 USD acts as immediate resistance. Another important level from psychological standpoint is 80 USD.
DISCLAIMER: This analysis is not intended to encourage any buying or selling of any particular securities. Furthermore, it should not serve as basis for taking any trade action by individual investor. Your own due dilligence is highly advised before entering trade.

Crude oil - sell zone Sell limit 78.12
Stop loss 80.87
Take profit 73.90
Disclaimer
The contents on this site are for informational purposes only and do not constitute Financial accounting or legal advice I can’t promise that the information shaded on my posts is appropriate for you or anyone else, by using the site, you agreed to hold me harmless from Any ramifications Financial or otherwise that occur to you as a result of acting on information found on the site.

U.S. May Drop Crude Prices for OPEC+The largest oil cartel in the world, the Organisation of the Petroleum Exporting Countries (OPEC) and its allies known as OPEC+ will hold a meeting on Thursday, November 4, to discuss oil production quotas. Markets expect OPEC+ to stay true to the existing deal to up oil production by another 400,000 barrels per day starting from December 1.
On the other hand, some of the largest oil consumers are frowning on high crude prices and are calling on OPEC+ to increase production in order to lower gasoline prices in some regions. China reported in a rare official statement that it had released gasoline and diesel reserves to increase market supply and support price stability in some regions. Now there is a serious threat that an anti-Saudi Arabia and Russia coalition led by the United States could be formed, possibly jointed by the world’s largest oil consumers Japan, India, and China.
U.S. President Joe Biden has already called OPEC+ to increase production beyond the planned 400,000 barrels in order to lower gasoline prices in the United States that have hit $3.7 per gallon, which is a maximum in the last 7 years.
This conflict could be escalated and may lead to new sanctions from the United States, if OPEC+ does not take any additional actions during its meeting on Thursday. Consumers are quite unhappy with current crude prices. The higher crude prices climb, the more hardball rhetoric we may see from the U.S. Administration.
Brent crude prices are performing a correction ahead of the OPEC+ meeting and is trading close to $83.50 per barrel. The major resistance is located at $86.74, a maximum reached in January 2018. This is exactly the level where Brent crude prices reversed, showing a peak of $86.70 per barrel on October 25. It is worth noting that Brent crude prices are below the upward trend that started on August 23. We may see an even stronger correction if prices drop below $83 per barrel. If this level is passed, Brent crude prices may drop to $79.80-80 per barrel, the late September and early October levels as well as the EMA 55 level on the daily timeframe chart.
So, this time we may face the decline of crude prices after the OPEC+ meeting instead of the rise we saw before the previous OPEC+ meeting.

USOIL LONGNews:
The Biden administration has asked some of the world`s largest oil consuming nations - including China, India and Japan - to consider releasing crude stockpiles in a coordinated effort to lower global energy prices, according to several people familiar with the matter.
The unusual request comes as US President Joe Biden fends off political pressure over rising pump prices and other consumer costs driven by a rebound in economic activity from lows plumbed early in the coronavirus pandemic.
We are thoroughly reviewing the U.S. request, however, we do not release oil reserve because of rising oil prices. We could release oil reserve in case of supply imbalance, but not to respond to rising oil prices," the official said.

CL - Glasgow Summit's Coal Boiler Room200 Nations struggles to find consensus, which is required.
Kill Coal was on the Agenda.
Meanwhile, the Co-Pilot in charge mused:
"If you buy an Electric Vehicle you can Drive Across America
on a Single Tank of Gas."
___________________________________________________
Crude OIl Inventories after five weeks of builds - show a draw...
and are sold again.
It either gets up off the dirt or begins to plunge to the 60s.
___________________________________________________
This week is pivotal.

CL - Algos and the Range to 88.21 Price ObjectiveThis Friday is going to be one for the Books in Crude Oil.
We have API/EIA/RIGs Data ahead this week.
Participants are clearly positioned for the Measured Move.
Our Fills remain open at @ 82.15 to 82.69, backtesting the
Support Levels after Last week's Price Levels.

CRUDE | Ascending Channel Double Top Reversal Play ;)On the HTF we have an ascending expanding structure from which we broke out of in a separated ascending channel at the HTF Double Top Highs. Price has pushed down and broke out of said channel and now it looks like we're forming a correction after the breakout. The SL size is a little too large for my liking to place an order now. We'll wait to see if we can get a tighter entry like smaller correction after the breakout.

Brent: A lot to do! 🛢️🛢️🛢️The course is very busy surging to old highs. We expect Brent crude to push gains towards areas around $90.88, before relaxing a bit. However, this should not last long as we see the price reach heights of above $96 in the mid-run.
A good outlook!

Crude Oil (WTI): Key Levels to Watch 🛢️
Hey traders,
Contemplating this bullish rally on WTI,
here are the major key level to watch for pullbacks.
77.0 - is the structure resistance that went broken this week.
Now it turned into a support
91.0 is a minor monthly/weekly resistance.
The price may retrace from that.
107.0 - 115.0 is a major monthly resistance cluster.
A strong bearish reaction will be expected from that.
Be prepared for a bullish continuation.
Try to catch it on an occasional pullback.
❤️Please, support this idea with like and comment!❤️

Crude Trend analysisThe energy benchmark had previously benefited from the Organization of Petroleum Exporting Countries, Russia, and its allies, known as OPEC+, decision on Monday. According to Reuters, the oil cartel reaffirmed a previously agreed accord in which 400,000 barrels per day (BPD) will be added in November. “An OPEC+ source told Reuters soon before Monday's ministerial talks that the group had been pressured to ramp up output faster, but added: ‘We are terrified of the fourth wave of corona; no one wants to make any huge moves,'” according to Reuters.

CL - New HighWatch Crude Oil closely, it may be on the
verge of an explosive move.
It ALSO has a very Bad Habit of making
New Highs priors to selling off...
A quick Dip-In prior to reversal. One thing
does appear higher probability than usual,
Crude Oil will retest its Highs and Double
them...
Watch the reaction for a close over $77
as OPEC meeting.
A weekly close over $77... and this can get
Vertical Day after Day to 104.
UKOIL is on bullish momentum! | 1 Oct 2021Price is consolidating in an ascending channel . We foresee a potential bounce from our target entry at 77.41 in line with 38.2% Fibonacci retracement and graphical swing high. Price have the potential to climb towards our area of take profit at 80.00 in line with parallel channel , and close to our 127.2% Fibonacci retracement . Technical indicators are showing room for bullish momentum. Alternatively, our stop loss is placed at 76.06 in line with 23.6% and 50% Fibonacci retracement .
Any opinions, news, research, analyses, prices, other information, or links to third-party sites contained on this website are provided on an "as-is" basis, as general market commentary, and do not constitute investment advice. The market commentary has not been prepared in accordance with legal requirements designed to promote the independence of investment research, and it is therefore not subject to any prohibition on dealing ahead of dissemination. Although this commentary is not produced by an independent source, FXCM takes all sufficient steps to eliminate or prevent any conflicts of interest arising out of the production and dissemination of this communication. The employees of FXCM commit to acting in the clients' best interests and represent their views without misleading, deceiving, or otherwise impairing the clients' ability to make informed investment decisions. For more information about the FXCM's internal organizational and administrative arrangements for the prevention of conflicts, please refer to the Firms' Managing Conflicts Policy. Please ensure that you read and understand our Full Disclaimer and Liability provision concerning the foregoing Information, which can be accessed on the website.

UKOIL is on a bullish momentum | 30 Sept 2021Price is on facing bullish pressure. We foresee a potential bounce from our pivot entry at 77.55 in line with 23.6% Fibonacci retracement and parallel channel towards our take profit at 79.94 in line with 50.0% Fibonacci retracement and graphical swing high. Alternatively, our stop loss is placed at 76.66 in line with graphical swing low. Technical indicators are depicting bullish momentum.
Any opinions, news, research, analyses, prices, other information, or links to third-party sites contained on this website are provided on an "as-is" basis, as general market commentary, and do not constitute investment advice. The market commentary has not been prepared in accordance with legal requirements designed to promote the independence of investment research, and it is therefore not subject to any prohibition on dealing ahead of dissemination. Although this commentary is not produced by an independent source, FXCM takes all sufficient steps to eliminate or prevent any conflicts of interest arising out of the production and dissemination of this communication. The employees of FXCM commit to acting in the clients' best interests and represent their views without misleading, deceiving, or otherwise impairing the clients' ability to make informed investment decisions. For more information about the FXCM's internal organizational and administrative arrangements for the prevention of conflicts, please refer to the Firms' Managing Conflicts Policy. Please ensure that you read and understand our Full Disclaimer and Liability provision concerning the foregoing Information, which can be accessed on the website.

Crude Oil WTI - long term breakout suggests a $100+ targetCrude Oil is attempting to break out of a long term resistance. Target is between 100 and 140$ per barrel

WTI OIL Breakout! Will Go Up! Buy!
Hello,Traders!
WTI OIL broke a resistance cluster
Of the falling resistance and a horizontal level
Which changes my bias to bullish
And I think that after a pullback
We will see a move up
Buy!
Like, comment and subscribe to boost your trading!
See other ideas below too!

