Crude-oil

✅CRUDE OIL LOCAL SHORT🔥
✅ CRUDE OIL is retesting a daily falling resistance
While on the lower timeframes we can see
That the resistance confluences with the local
Rising resistance level as well
And the price actually pulled back on the retest
So I think that a further bearish reaction is possible
But the limited in scope, thus the target is nearby
SHORT🔥
✅Like and subscribe to never miss a new idea!✅

✅CRUDE OIL WILL FALL|SHORT🔥
✅ CRUDE OIL is retesting a falling resistance line
Which makes me locally bearish
And I think that we might see a pullback
And a move down
Towards the local support below
SHORT🔥
✅Like and subscribe to never miss a new idea!✅

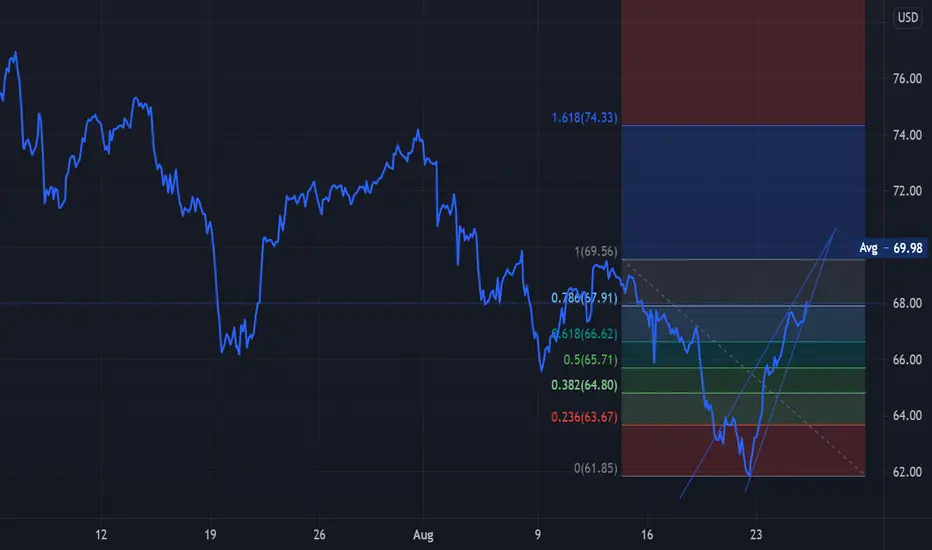
Technical analysis update: USOIL (24th August 2021)USOIL rebounded from its recent low 2 days ago to over 67 USD today. This retracement from 61.76 USD is pretty significant as price soared above 65 USD price level which acted as siginificant support before the selloff. We mentioned in our previous post that if WTI oil manages to hold above 65 USD this would be particularly bullish developement for it. In recent trading sessions Stochastic gained bullish direction. In addition to that RSI reversed to the upside from oversold area below 30 points. At the same time MACD strives to turn bullish and follow RSI. However, we need to note that MACD still remains in the bearish territory and needs to be closely observed over the next few days. We are currently bullish on USOIL. Our medium price target remains 77.50 USD and long term price target remains 80 USD. Now as price retraced back above 65 USD we would like to set short term price target to 70 USD.
MACD daily timeframe:
Stochastic daily timeframe:
Prior developements from 18th August 2021:
Here we warned our readers that if price plunged below 65 USD then more selling was probable. As that happened we abandoned our short term price target of 70 USD. We also pointed out support level at 61.58 USD and discussed the possibility of fake breakout below 65 USD.
Disclaimer: This analysis is not intended to encourage buying or selling of any particular securities. Furthermore, it should not serve as basis for taking any trade action by individual investor. Your own due dilligence is highly advised before entering trade.

CL - IF we are to see a ReversalCrude Oil will provide indications a sign of the next decline.
Our Price Objective was met, typically CL will exceed these
PO's prior to a reversal.
We sill see it there is a 2nd test of the highs tomorrow.
The lower Price Objective in Trend is 57.
Monthly Draw is 6.50 to ATH @ 148.20.
Large, volatility should continue to build.

Crude Oil setup to rally to new highs - $USOIL $CL $CL_1 $XOMAside from Crypto, I've had the most success in the last decade trading crude based on a combination of technical analysis (classical charting) and trading the news (economic indicators, such as OPEC releases).
Between March - June 2021, Crude oil prices formed a cup and handle that concluded with price reachings its target just above $75. Price then corrected, forming a triangle that turned into a bear trap as sellers sold the breakdown before price rallied back into the consolidation.
From failed moves come fast moves.
Over the last 6 weeks, price has formed an inverted H&S. Having occured after a downside break and failure, this is an immediate buy signal with fast upside price implications. Oil is a fun and scary market to trade because of the volatility and liquidity combined with leverage opportunities.
Be safe,
j

WTI Crude - Breakout Imminent?Oil prices have rebounded strongly over the last couple of weeks, with WTI coming within a whisker of $70 before profit-taking kicked in.
The pullback today was short-lived and after falling close to $67 it recovered the bulk of the losses to trade in between two key technical levels.
Above, $70 is an important psychological barrier that coincides with the 200/233-period SMA band on the 4-hour chart. This is also around the 55/89-day SMA band.
Below, the 55/89-period SMA on the 4-hour chart coincides with recent support that has been tested on a number of occasions this past week.
A breakout in either direction may indicate the direction of travel in the coming weeks.

CL - Selling into LevelsWe took our first STO @ 68.10 just now and will Build an
outsized SELL Position to the APEX.
The DX, we believe will place pressure upon Crude Oil
in the coming weeks.
Off the height of the APEX, we Indicate a return to 65.70
and then lower to 57s as the Equity Complex comes under
extreme duress, led by Technology, the Dollar and Yield
Curve.
CL - Weekly ALGO Counter - Trend - Hedge to ExitWe Hold 7.5 K @ ~ 6593 STO
We Hold 12.5K @ - 66.34 BTO
Presently we are Legging OUT of STOs
1K per 12 Ticks above 66.35.
Net Long as .500 comes into trade
the 66.61 pivot exceeded and dipped in,
we bought the lows ahead of AM Pit Session
and are slowly putting the Net into Balance.
On Trading CTs we are now + 2492 Ticks.
Rebalance will leave us NET Long 6K at ~ 66.54

✅CRUDE OIL FIST UP THEN DOWN|SHORT🔥
✅CRUDE OIL broke a strong key level
And now I think we will see a rebound
To retest the resistance confluence
Created by the falling resistance
And the horizontal level
From where I am expecting a move down
As I am bearish on oil
SHORT🔥
✅Like and subscribe to never miss a new idea!✅

CRUDE OIL Breakout! Will Go Down! Sell!
Hello,Traders!
CRUDE OIL broke the horizontal support level
While trading in a downtrend
Confirming our bearish bias on oil
And I think that after a retest of the broken level
We will see a move down towards the target on the chart
Sell!
Like, comment and subscribe to boost your trading!
See other ideas below too!

#WTI #Crudeoil reversal?Oil has stayed within this long term trend channel since June of 2020. Today's -3% move placed WTI at the bottom of this trend channel $64.20
If we don't get a reversal here...I don't see another good support until $62.

USOILUSOIL breaks out of this downwards channel and is retesting this daily demand zone, and price is forming a strong support around these levels, so we can look to buy US oil and aim $71.50/$73 for a good risk reward set up. Stop loss to be set under the support to protect it.

CRUDE OIL (WTI) Technical Outlook & Price Action 🛢️
Hey traders,
I received a lot of questions about WTI Oil.
Analyzing a daily time frame,
since 77.0 level - current year's high was reached,
the market started a nice correction cycle.
Trading in a local bearish trend from the beginning of July,
the price managed to form multiple bearish impulses setting lower lows and lower highs.
From 20th of July though the price is stuck on 65.0 level.
Setting two equal lows there, for now, the price didn't manage to break that.
However, the lower highs that the price keeps setting, signify a bearish accumulation.
Be prepared for a breakout attempt of the underlined yellow support
and sell the market after a daily candle close below that.
Next support will be 62.0 level.
For now, I wouldn't trade OIL,
Be patient and wait for a breakout first!
❤️Please, support this idea with a like and comment!❤️

On OPEC & OILSince May 2021, S&P 500 has gained almost 10%, while Copper/Oil ratio has lost 52%; which means oil prices are relatively higher than the Global economic growth capacities.
IEA reported the same idea on Global OIL demand this week, which is totally in contrast with OPEC's demand assessments noted in it's August report.
Since these high prices are weighing on U.S. Trade Balance & causing inflationary pressures, White House has already reached OPEC for lower prices.
While OPEC is counting on strong Global growth to reach it's basket pricing, a failure on that could force the Cartel to cut it's prices; The bad scenario is a continued divergence between OPEC basket pricing & the global growth capacities, which could at last end in a pressure on World Economies which are already in ultra low Interest Rates & looming Tapering stages.
I believe the above divergence scenario has a little chance to happen, But still a possibility since OPEC miscalculation isn't new.
Whether OIL prices lower to match the world growth capacity or world recovery reach the high energy prices according to OPEC's anticipation, is to be judged by the unveiling Fundamental Factors including Delta variant outbreak & vaccines effectiveness.
However any prolonged divergent policy, despite being unlikely, could cause recessionary pressures.

TrendyTrades: UKOIL BRENT CUDE (BULLISH)UKOIL looking strong for a climb back to $76 range as it broke trend and closed above. Very bullish.

CRUDE OIL - Detailed Video Analysis!Hello everyone, if you like the idea, do not forget to support with a like and follow.
Here is the top-down analysis for CRUDE OIL, feel free to request any pair/instrument or ask any questions in the comment section below.
Best of luck!

WTI POTENTIAL LONG SCENARIOCRUDE OIL is trading in a kind of a massive wedge
And now oil is falling down to retest the rising support and trendline around 68.00-69.00$
From the Support line expecting a local pullback
With the final target being the horizontal resistance above around 71.00 $!
Today is NON=Farm Payrolls and traders can see big movements.
If the OIl breaks the support on 68.00 , next target would e 63 $
Risk Disclosure: Trading Foreign Exchange (Forex) and Contracts of Difference (CFD's) carries a high level of risk. By registering and signing up, any client affirms their understanding of their own personal accountability for all transactions performed within their account and recognizes the risks associated with trading on such markets and on such sites. Furthermore, one understands that the company carries zero influence over transactions, markets, and trading signals, therefore, cannot be held liable nor guarantee any profits or losses.

Crude Oil (CRUD) UpdatesQuick update on crud oil (the investment is on the "CRUD" ETC as you well know).
No fundamental news from OPEC, so let's analyze the chart, because we have reached an important point.
After the retracement practically lasted from 6 to 20 July, the price with a classic "V shape" is returning to the 5.80 area.
I highlighted a similar situation in the past when in May, after some profit-taking, there was a double top in the € 5 zone.
It is not certain but it is highly probable that such a situation will repeat itself when the price touches the previously mentioned level.
As far as I am concerned, I have already said that I consider the level of 8 € the real target, but obviously, we are talking about a raw material, very linked to what is happening in the world, in a moment of recovery, but recently threatened by the Delta variant. of the virus.
A very uncertain picture and the markets generally don't like uncertainty.
We must constantly follow the news and check that the price does not fall below the level of 5. 05 that I recently traced. In fact, this could mean a trend reversal and for many who may have an entry price close to that level (possible since it was a breaking point of an important resistance). a risk of a possible loss.
But by far, August 1st, the price has returned to the uptrend channel clearly visible on the chart, which I have drawn. This we know.
In an ideal scenario, there should be a strong break with a daily candle closing above 5.80. If accompanied by volumes it would be a clear signal of continuation of the trend.
In the event of a retracement, for those who have been investing for a long time, the most interesting levels to add positions are 4.577 (green line on the chart) and the SMA 200 moving average.
I remember that we are talking about a commodity, so the scenarios could change radically at a fundamental level, so if you were long, follow the economic calendar, the trend of the dollar, and the seasonality very carefully. however importance.
Lazy Bull

USDWTI H4 - Short SetupUSDWTI H4
Nice trading zones highlighted here. Clear bear trend on the H4 and D1, so we are trading the zones in line with the overall market trend.
We also have our D1 and H4 supply, depending on which instrument you're trading brent/crude.
Quite and attractive 6R potential on this one too. Hopefully resistance/supply holds and we start to see a nice bear continuation.

Crude Oil 4 hr chart.For more than a year, we can see where Crude Oil has been moving and it latest price. Our 160 WMA and smoothed technical indicators can show a beautiful trace over the chart. A nice daily chart can also be plotted to see its great trend. While no statement of continuation or a change in trend, just illustrating the general view of some recent history.

CRUDE OIL Swing Forecast! Sell!
Hello,Traders!
CRUDE OIL is trading in an uptrend
Making a spectacular recovery after the COVID crash
And there is still some way to go
However, a massive monthly resistance level is ahead
And it looks ironclad to me
Which makes me think that we will see a correction
That is long overdue, and judging by the nearest strong support level
The correction might be as big as 15% from the highs
Sell!
Like, comment and subscribe to boost your trading!
See other ideas below too!

