Crude-oil


CFDS ON CRUDE OIL(WTI) Daily Chart - SHORTAs shown in the chart Crude Short
to Medium Term the trend is lower.
Only sustain trading above $45
negate the downtrend.

Crude oil - another warning message for the marketsAfter almost two month period of consolidations, CL1! is breaking down from bear flag, indicating high probability of significant decline (10-20%) to 30$ level ahead.
But what is more important I think, breakdown in crude oil acts as another hint of what to expect from risky assets going forward, and clear warning sign that more downside in equities should be expected.

WTI - Bearish CypherAs we can see we have a clear formation of the bearish cypher, we can enter a good short position with the shown TP


UKOIL: Another drop is possible to complete correctionThe wave B is a flat and it could be over.
Another drop could start soon in wave C to hit the blue box between 35 and 31

oil short term bullish ideaprice looks to have made a continuation flag, i am cautious however as we have rallied hard already this week, but i have taken a postion with a smaller risk

Crude Oil bounces at 36.63 to retest the 38.66 zoneLast week Crude oil closed bearish for the week, retesting 36.63. This week I’m lookin for more bearish momentum and possible continuation to the downside. If price can close below 36.63, next target will be 34.51.
If you have any questions please feel free to comment below.

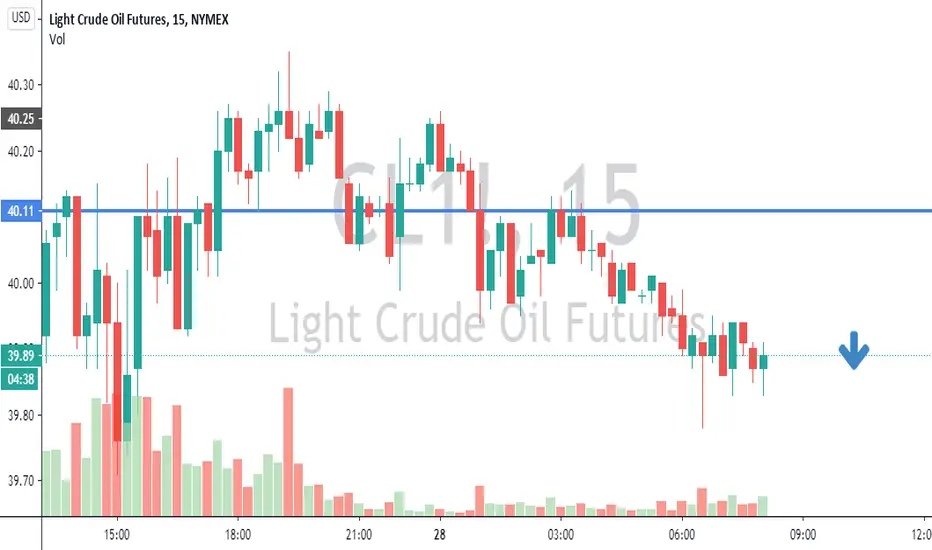
The CL is still going down on the 15M chartThe Cl started a bearish move from the very morning showing a bearish move but there is still no big momentum that will show the real direction of the market.


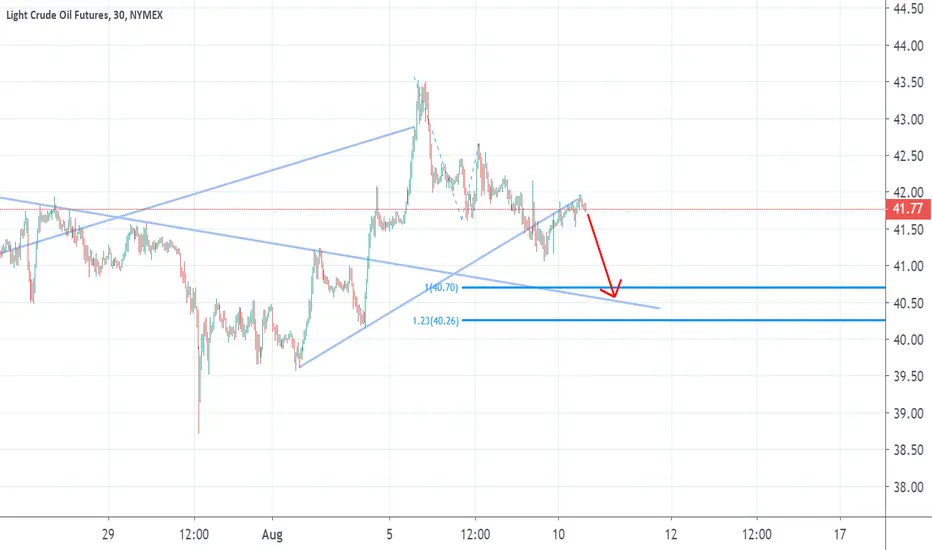
Crude oil On the top, we can see a rising wedge and we already break out the resistance line.
waiting for 23.6-32.8% level Fibonacci
The additional shift of workers to remote work is a bad prospect for the oil industry. This means that tens of millions of people in developed countries will greatly reduce the movement of their cars.
Only this factor for 2021 means a decrease in world oil demand by 0.4-0.8 million barrels per day (or 0.4-0.8% of oil consumption).
Best regards EXCAVO

Brent Crude: Watch recovery for sellThe long awaited correction in oil has kicked off as we got beautiful impulse down with all 5 waves visible and clear.
It could be a wave A of (2). And I expect some recovery soon as another short opportunity.
The next leg target will be updated upon completion of the wave B.
The wave 5 of A is still in progress and could drop lower.

Bearish Idea on Crude Oil Consider this just an idea, IF the scenario happens, we will have an interesting setup to take, and if not, we don't do anything, and that's always good for your trading capital.
Main items we can see on the chart:
a) The price was inside a compression
b) Currently, we can see a bearish breakout of the previous structure
c) This doesn't mean that the price should start a new bearish trend. The price has been on a bullish movement since APRIL; we need confirmations first.
d) That's the reason we will wait for a clear pullback to the broken structure. IF that happens, we will trade towards the next support zone.

To the rescue 17yr Cycle reveals post COVID19 futureTo the rescue 17yr Cycle reveals: bull market in SPX Gold WTI & bounce in TNX & bear market in USDCHF & DXY. Importantly on 3 occasions no change in DXY after 39 WKS. NOT ADVICE. DYOR


OIL is buy - shorting is riskyTrend is still up
dont look to short
infact try to buy lower
there is no short untill this trendline breaks - even that would be corrective
oil can make a flat here and continue going up

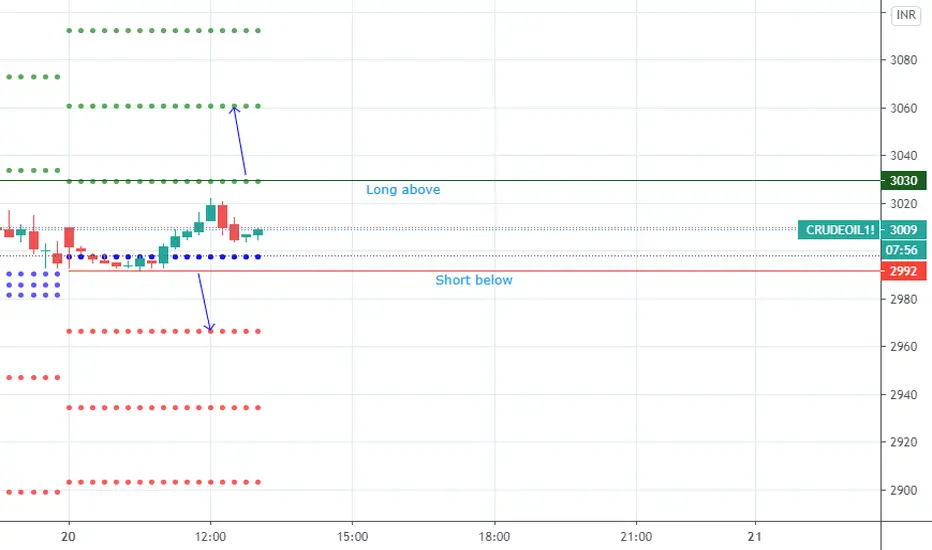
Crude intradayLong and short zones shown using 2 lots.
Morning entries- Buy t1 hit and 2nd entry SL.. Then sell hit both targets
Net points=8-10+8+18=24
Use same levels to reenter for the day.

WTI Crude Oil - USOIL Possible bearish scenario!The chart, wave count, and support resistance level shown indicate a possibility for bearish trend.
