Crude-oil


Shorting Crude OilCrude oil prices managed to slightly incline during yesterday’s session amid comments about an OPEC output cap seemed to overshadow the high inventory build up, according to the Department of Energy on Wednesday. - See more at: globalcurrenciez.com


Time to Go Long in OilExcellent opportunity to go long for positional players. High risk reward with great entry.

Crude Oil structureNow we have the following structure on WTI
It is likely that we will break(besides taking into consideration technical indicators) the resistance line of 51.75 $ and then we go to the area of 60 $
Globally, it is the 4-th wave and it will be the last part of this growth
Note: This is not trading chart, only the analyst.

Opportunity to Long Oil for IntradayThe Main trend still seems down, but this is looking like a long opportunity.

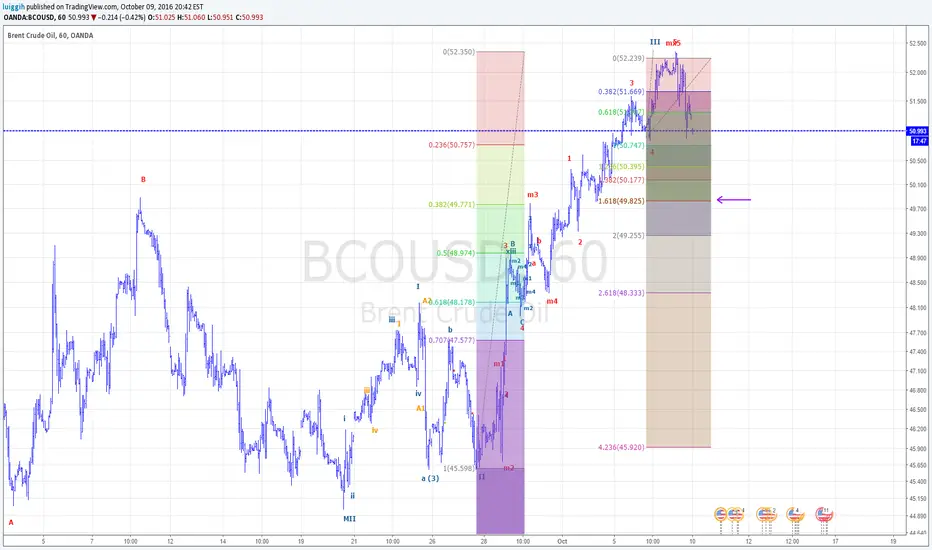
WTI CRUDE OIL - UPWARD DIAGONAL ELLIOT WAVEThis is my perspective for this subyacent for the next weeks.


One more reason to short oil todayThis wedge looks like it will break down. We are also at the hourly pivot and have not been able to cross it so far.

UKOIL (Brent crude). Alternative count. Ending diagonal It could be an Ending Diagonal in the position of wave C.
We can reach then the $55-58 area where both 61.8 of A and the top of diagonal meet.
Break below 45.12 (wave II) would invalidate this count.
I will add another possible count in the comment to this post to show you different perspectives.


Wait to Long WTIA bottoming formation with valid setups suggest trend reversal, better to long 35.8x if happens RR wise, one should dig in smaller time frames for long setups.


JMP A good candidate to shortJPM is struggling to make new highs and has been lower low for a while. Once it breaks the 2009 black trend line it will be a free fall to the green support line from 1990's low. Once that breaches JPM might become a penny stock. Ultimate support MIGHT BE around $1 or $2. Those who missed to short Other so called good bank, still has time left to short JPM by buying leap puts 9if any available) of beyond 2018 like 2019/2020 or so.
