One more reason to short oil todayThis wedge looks like it will break down. We are also at the hourly pivot and have not been able to cross it so far.
Crude-oil

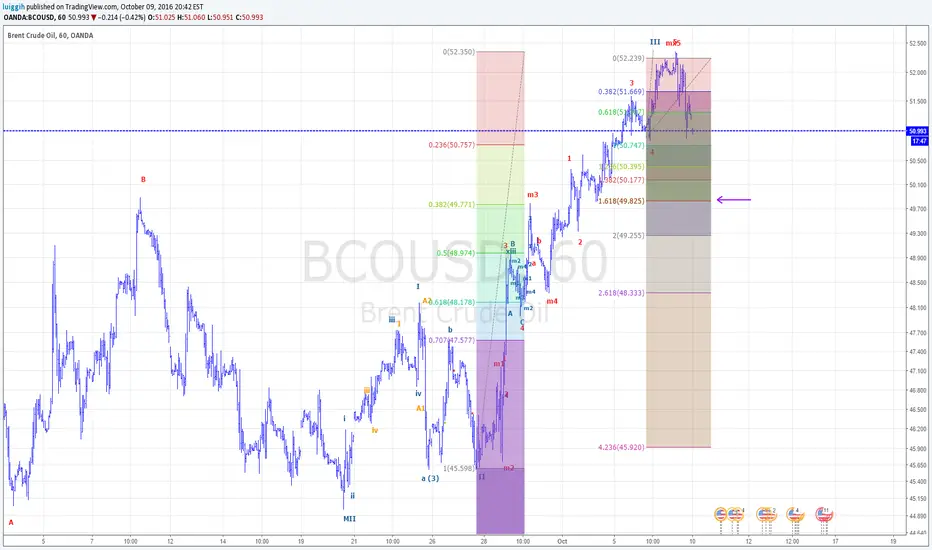
UKOIL (Brent crude). Alternative count. Ending diagonal It could be an Ending Diagonal in the position of wave C.
We can reach then the $55-58 area where both 61.8 of A and the top of diagonal meet.
Break below 45.12 (wave II) would invalidate this count.
I will add another possible count in the comment to this post to show you different perspectives.


Wait to Long WTIA bottoming formation with valid setups suggest trend reversal, better to long 35.8x if happens RR wise, one should dig in smaller time frames for long setups.


JMP A good candidate to shortJPM is struggling to make new highs and has been lower low for a while. Once it breaks the 2009 black trend line it will be a free fall to the green support line from 1990's low. Once that breaches JPM might become a penny stock. Ultimate support MIGHT BE around $1 or $2. Those who missed to short Other so called good bank, still has time left to short JPM by buying leap puts 9if any available) of beyond 2018 like 2019/2020 or so.

Possible price action following surprize oil draw pre OPEC meetThe -6M draw on Wednesday took many by surprise, and sounds like oil is being moved around rather than being used up. The price action following the news was subdued, as if there is no enthusiasm for what would have been very bullish news under normal circumstances, given the Fed didn't hike and DXY took a steep fall.
OPEC side meeting in Algiers is on Wed 28th, with further rumors that it could be a full blown meeting. That in itself suggests that there is very little possibility of agreement. If you can't organize a meeting, what chance is there of organizing a freeze, or what they really need, a production cut.
Do opec really want higher prices, or are they satisfied to be putting further pressure on small US shale producers. If the oil majors want a piece of the shale pie, lower prices might suit them as well, especially if they are well hedged.
On 28th expect big price moves. Move to the upside not guaranteed IMHO.

Light Oil Technical ViewCL1! USOIL
The technical overview in the Oil expose a solid Downtrend and keep the spot inside the Triangle.
Triangle Bottom: $ 43.00
The bear is in the Auction control and it will keep pushing, we need keep it in mind. ALL retraccement can be a profitable oportunity.
happy week

Crude Oil Short opportunity Double top at 46.5 sends oil down, triggered by Saudi oil production freeze deal high probability of failure. From elliot perspective this could be described as impulse wave 1, assuming this is wave one, the retracement is likely to occur at 0.5 fib of the move, given the oversold RSI on the 60m chart, we are likely to find an entry at 45.35.
Wave 3 should be the greatest wave and is the objective of this trade. typically the size of the third wave is 1.618 the move of the first wave. However we could corrective structures in between the impulses, possibly forming bearish harmonic patterns and forming a downtrend line.
4h chart looks bearish and fundamentals are looking gloomy again.

Light Crude IdeaCL11 has formed an interesting pattern and is now in a tight wedge with a target of $45. My idea is that it will break to a channel downward and then reform into another wedge pattern this time with a target of $35. I think that it will then break to the upside again.

WTi Long Term viewLooking Like a Very Large Descending triangle X-E with C-D currently being printed. D @ $77 per barrel.


LONG WTI CRUDE OILBullish on WTI CRUDE OIL,on bullish falling channel formation. If the channel breaks, next resistance level is at around 47 - 47.5 area. More of a long term trade


treasure map different angle , targets ,supports , resistance treasure map different angle , targets ,supports , resistance

USOIL----POTENTIAL BUTTERFLY & 5 WAVE MOVE to 50.5...Route MapOil moves on news specifically the weekly oil inventory figures.....so If price is 45.87 or thereabouts on WEDS PM 14th September ....then buy the oil inventory data release to complete this butterfly pattern.....to a target of 50.50......
There is a bigger potential butterfly sequence that this is part of which would take price to 59 area.....see my other post on this...

Oil Will Be $46 In The First Days of Next Week.From my point of view I planed double fibonacci indicator and it arose a triangle without drawing.For the resistance part,in the next week,the prices can be seen.

Effect of fundamentals on USOILOIl is now suffering from the over-hyped bull effect of opec. Friday's non farm payroll numbers will have a dramatic effect on the US dollar as a high jobs number will put further pressure on the Fed to hike rates in September. Oil will feel that effect.

Crude TA Wave Analysis 9/1/16I'm expecting oil futures to rebound between the .38 and .5 retracements in the short-term, before possibly continuing its downward momentum. This would bring it around the beginning of the fourth (D) wave. Thoughts? Let me know what you think! -Matt

US OIL LONG TERM BUY OPPORTUNITY I will be looking to go long on oil around 44.10 with a target 1 of 49 and target 2 of 51.80 with stop below 42.80. lets see how it plays out!

A path for WTI USOIL crude to slide back into 30s SHORTA path for WTI USOIL crude to slide back into the higher 30s SHORT

treasure map follow up , targets , supports ,resistancetreasure map follow up , targets , supports ,resistance
