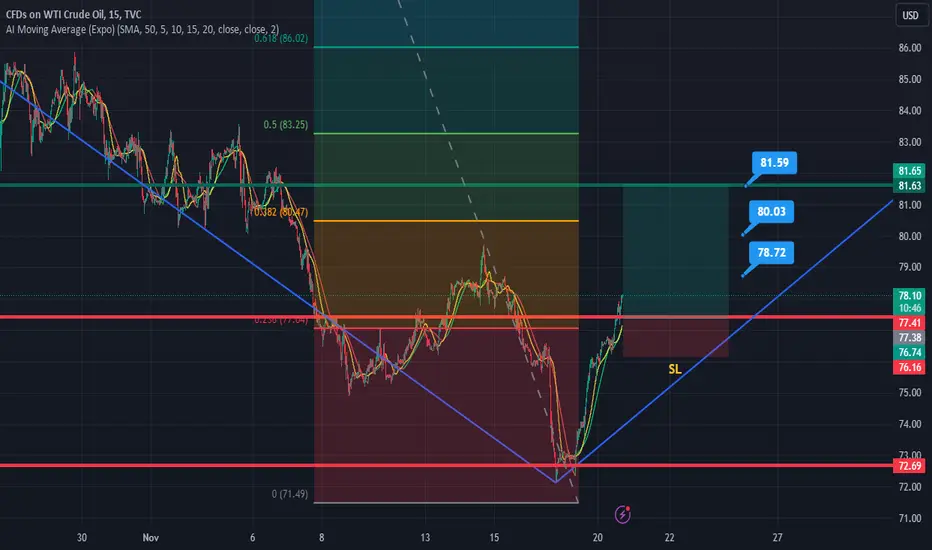
WTI OIL Excellent buy opportunity.WTI OIL (USOIL) has been trading within a long-term Rectangle since the August 30 High. This is most accurately displayed by the use of the Fibonacci retracement levels where we can see that the majority of the price action has been within the 0.236 - 0.618 Fibonacci range. We call that the "High Volatility Zone". On November 16 the price almost hit the bottom of that Zone and since the 1W MA200 (red trend-line) is just below and has been the long-term Support (hasn't closed a 1D candle below it since January 29 2021!), we consider the commodity to have significant upside potential.
On top of that, the 1D RSI has Double Bottomed on the oversold barrier of 30.00 (where it always gave strong rallies on May 04 2023, March 17 2023, December 09 2022 and September 26 2022) while the 1D MACD formed a Bullish Cross (with all such crosses below the 0.00 mark being a buy signal).
We are bullish at least for the short-term, targeting the 0.5 Fibonacci level at 80.50, expecting also a potential contact with the 1D MA50 (blue trend-line).
-------------------------------------------------------------------------------
** Please LIKE 👍, FOLLOW ✅, SHARE 🙌 and COMMENT ✍ if you enjoy this idea! Also share your ideas and charts in the comments section below! This is best way to keep it relevant, support us, keep the content here free and allow the idea to reach as many people as possible. **
-------------------------------------------------------------------------------
💸💸💸💸💸💸
👇 👇 👇 👇 👇 👇
Crude

Crude oil looks set to bounce ahead of OPECWith oil prices having fallen around -25% from the September high, a correction higher may be due.
And as prices failed to hold beneath $70, Wednesday's bullish hammer (which is also a higher low) has caught out eye). The hammer was coupled with above-average volume to suggest demand around $75, and the initial break below $70 was seen on strong negative delta (more sellers than buyers) which means the subsequent move higher likely forced them to cover and reconsider their direction.
A move towards $75 could help improve the reward to risk ration for an anticipate move to $80, a break above which brings $82 into focus just beneath the January and April highs.

USOIL (CRUDE OIL ) SELL ON REJECTION HELLO TRADERS !!!
As i can see CRUDE OIL 🛢️
The anticipated OPEC+ meeting set for this weekend to a postponement to Nov 30th. The delay stemmed from challenging discussion between Saudi's and fellow members regarding oil production levels....
Saudi Arabia currently implements an additional 1 Million barrel per day output cut since July engaged in talks without specifying the cause for the delay....
Recently weeks have seen oil prices fluctuate amir signs of expending supply.....
CRUDE OIL 🛢️ INVENTORIES ROSE 8.70 MILLION BARREL
while this presents another bearish factor 🔥
and technically it is showing us a rejection here on a fake breakout of trend line so we planing for these design TP and expected more fall in USOil its just an trade idea do a proper analysis before trade on ur real account share ur trade idea with us it will help alote the trader community

Oil continues to slide within the channelThe price of WTI crude oil continues to rise ahead of the OPEC+ meeting scheduled for Sunday, during which cartel members will discuss policy regarding production. The group will likely decide to lower the output in response to more than a 20% decline in the oil price since September 2023 highs (now, closer to an 18% decline). While a drop in supply is normally bullish for oil, it is important to note that some of it will get offset by the United States trying to ramp up its domestic production. Furthermore, the prices are already rising in anticipation of the cartel’s decision. Nonetheless, our outlook stays unchanged, with a price target of $70 per barrel for 2024.
Illustration 1.01
Illustration 1.01 displays the daily chart of USOIL and simple support/resistance levels derived from peaks and troughs.
Technical analysis
Daily time frame = Bearish
Weekly time frame = Slightly bearish
Please feel free to express your ideas and thoughts in the comment section.
DISCLAIMER: This analysis is not intended to encourage any buying or selling of any particular securities. Furthermore, it should not be a basis for taking any trade action by an individual investor. Therefore, your own due diligence is highly advised before entering a trade.

BUY USOIL !!! TIME TO RETRACE hello traders as i can see its a great entry point for oil to caught some easy pips oil had created a good support zone on last daily low in shorter TF its seems more upside to test broken support zone Saudi and Russian are stick on their cut policy and war is also creating more demands
trade with ur on risk its just and trade idea if ur like our prediction we appreciate ur support it help our trader community stay tuned for more updates
Crude Oil Found The Support?Crude oil is trading lower, currently showing blue wave C in late stages of a corrective wave B pattern. We can also see now five subwaves down within C from 88/89 zone, where final subwave (5) of C can be now coming to an end with a huge volume increase. We can actually already see a sharp bounce from the support that can be signal for a minimum three-wave recovery back to 80 area. If we get a five-wave impulsive recovery back above channel resistance line and 80.00 level, that's when we may call a bottom for crude.

WTI H4 | Rising into 38.2% Fibo resistanceWTI oil (USOUSD) could rise towards a pullback resistance and potentially reverse off this level to drop lower towards our take profit target.
Entry: 79.454
Why we like it:
There is a pullback resistance that aligns with the 38.2% Fibonacci retracement level
Stop Loss: 81.725
Why we like it:
There is a pullback resistance that aligns with the 50.0% Fibonacci retracement level
Take Profit: 72.437
Why we like it:
There is a swing-low support level
Please be advised that the information presented on TradingView is provided to Vantage (‘Vantage Global Limited’, ‘we’) by a third-party provider (‘Everest Fortune Group’). Please be reminded that you are solely responsible for the trading decisions on your account. There is a very high degree of risk involved in trading. Any information and/or content is intended entirely for research, educational and informational purposes only and does not constitute investment or consultation advice or investment strategy. The information is not tailored to the investment needs of any specific person and therefore does not involve a consideration of any of the investment objectives, financial situation or needs of any viewer that may receive it. Kindly also note that past performance is not a reliable indicator of future results. Actual results may differ materially from those anticipated in forward-looking or past performance statements. We assume no liability as to the accuracy or completeness of any of the information and/or content provided herein and the Company cannot be held responsible for any omission, mistake nor for any loss or damage including without limitation to any loss of profit which may arise from reliance on any information supplied by Everest Fortune Group.

WTI H4 | Rising into resistanceWTI oil (USOIL) is rising towards a pullback resistance and could potentially reverse off this level to drop lower.
Sell entry is at 77.555 which is a pullback resistance that aligns close to the 38.2% Fibonacci retracement level.
Stop loss is at 80.000 which is a level that sits the 23.6% Fibonacci retracement level and a swing-high resistance.
Take profit is at 74.894 which is a pullback support.
High Risk Investment Warning
Trading Forex/CFDs on margin carries a high level of risk and may not be suitable for all investors. Leverage can work against you.
Stratos Markets Limited (www.fxcm.com):
CFDs are complex instruments and come with a high risk of losing money rapidly due to leverage. 67% of retail investor accounts lose money when trading CFDs with this provider. You should consider whether you understand how CFDs work and whether you can afford to take the high risk of losing your money.
Stratos Europe Ltd, previously FXCM EU Ltd (www.fxcm.com):
CFDs are complex instruments and come with a high risk of losing money rapidly due to leverage. 72% of retail investor accounts lose money when trading CFDs with this provider. You should consider whether you understand how CFDs work and whether you can afford to take the high risk of losing your money.
Stratos Trading Pty. Limited (www.fxcm.com):
Trading FX/CFDs carries significant risks. FXCM AU (AFSL 309763), please read the Financial Services Guide, Product Disclosure Statement, Target Market Determination and Terms of Business at www.fxcm.com
Stratos Global LLC (www.fxcm.com):
Losses can exceed deposits.
Please be advised that the information presented on TradingView is provided to FXCM (‘Company’, ‘we’) by a third-party provider (‘TFA Global Pte Ltd’). Please be reminded that you are solely responsible for the trading decisions on your account. There is a very high degree of risk involved in trading. Any information and/or content is intended entirely for research, educational and informational purposes only and does not constitute investment or consultation advice or investment strategy. The information is not tailored to the investment needs of any specific person and therefore does not involve a consideration of any of the investment objectives, financial situation or needs of any viewer that may receive it. Kindly also note that past performance is not a reliable indicator of future results. Actual results may differ materially from those anticipated in forward-looking or past performance statements. We assume no liability as to the accuracy or completeness of any of the information and/or content provided herein and the Company cannot be held responsible for any omission, mistake nor for any loss or damage including without limitation to any loss of profit which may arise from reliance on any information supplied by TFA Global Pte Ltd.
The speaker(s) is neither an employee, agent nor representative of FXCM and is therefore acting independently. The opinions given are their own, constitute general market commentary, and do not constitute the opinion or advice of FXCM or any form of personal or investment advice. FXCM neither endorses nor guarantees offerings of third party speakers, nor is FXCM responsible for the content, veracity or opinions of third-party speakers, presenters or participants.

WTI OIL Short-term rebound expected.Last month's Head and Shoulders (H&S) pattern (see chart below) hit both of our Targets (79.00 and 75.00) and transitioned into a Channel Down:
The price almost hit the pattern's bottom (Lower Lows trend-line) and after a 4H MA50 (blue trend-line) rejection, the 4H RSI formed the same Higher Lows trend-line as it did on October 12.
We are expecting this to be the start of the Lower High leg towards the 4H MA200 (orange trend-line). This is expected to be within the 0.618 Fibonacci retracement level and a +10.25% range. Target 82.50.
-------------------------------------------------------------------------------
** Please LIKE 👍, FOLLOW ✅, SHARE 🙌 and COMMENT ✍ if you enjoy this idea! Also share your ideas and charts in the comments section below! This is best way to keep it relevant, support us, keep the content here free and allow the idea to reach as many people as possible. **
-------------------------------------------------------------------------------
💸💸💸💸💸💸
👇 👇 👇 👇 👇 👇

USOILUSOIL Seems to have a harmonic pattern on the daily timeframe. We can also see we have a developing divergence with the RVI struggling to make a new low despite oil price falling rapidly. 81.64 Seems most probable in this circumstance.

CRUDE OIL (WTI): Intraday Bearish Confirmation?! 🛢️
Retesting a broken daily horizontal structure,
Crude Oil formed a tiny double top pattern on an hourly time frame.
The neckline of the pattern was broken after the market opening with a gap
and a consequent strong bearish candle.
We can anticipate a further bearish continuation.
Goals: 75.9 / 75.5
❤️Please, support my work with like, thank you!❤️


WTI H4 | Rising into resistanceWTI oil (USOIL) is rising towards a pullback resistance and could potentially reverse off this level to drop lower.
Sell entry is at 77.252 which is a pullback resistance that aligns with the 23.6% Fibonacci retracement level.
Stop loss is at 78.600 which is a level that sits above a pullback resistance that aligns with the 38.2% Fibonacci retracement level.
Take profit is at 74.121 which is n overlap support.
High Risk Investment Warning
Trading Forex/CFDs on margin carries a high level of risk and may not be suitable for all investors. Leverage can work against you.
Stratos Markets Limited (www.fxcm.com):
CFDs are complex instruments and come with a high risk of losing money rapidly due to leverage. 67% of retail investor accounts lose money when trading CFDs with this provider. You should consider whether you understand how CFDs work and whether you can afford to take the high risk of losing your money.
Stratos Europe Ltd, previously FXCM EU Ltd (www.fxcm.com):
CFDs are complex instruments and come with a high risk of losing money rapidly due to leverage. 72% of retail investor accounts lose money when trading CFDs with this provider. You should consider whether you understand how CFDs work and whether you can afford to take the high risk of losing your money.
Stratos Trading Pty. Limited (www.fxcm.com):
Trading FX/CFDs carries significant risks. FXCM AU (AFSL 309763), please read the Financial Services Guide, Product Disclosure Statement, Target Market Determination and Terms of Business at www.fxcm.com
Stratos Global LLC (www.fxcm.com):
Losses can exceed deposits.
Please be advised that the information presented on TradingView is provided to FXCM (‘Company’, ‘we’) by a third-party provider (‘TFA Global Pte Ltd’). Please be reminded that you are solely responsible for the trading decisions on your account. There is a very high degree of risk involved in trading. Any information and/or content is intended entirely for research, educational and informational purposes only and does not constitute investment or consultation advice or investment strategy. The information is not tailored to the investment needs of any specific person and therefore does not involve a consideration of any of the investment objectives, financial situation or needs of any viewer that may receive it. Kindly also note that past performance is not a reliable indicator of future results. Actual results may differ materially from those anticipated in forward-looking or past performance statements. We assume no liability as to the accuracy or completeness of any of the information and/or content provided herein and the Company cannot be held responsible for any omission, mistake nor for any loss or damage including without limitation to any loss of profit which may arise from reliance on any information supplied by TFA Global Pte Ltd.
The speaker(s) is neither an employee, agent nor representative of FXCM and is therefore acting independently. The opinions given are their own, constitute general market commentary, and do not constitute the opinion or advice of FXCM or any form of personal or investment advice. FXCM neither endorses nor guarantees offerings of third party speakers, nor is FXCM responsible for the content, veracity or opinions of third-party speakers, presenters or participants.

WTI H4 | Potential bearish breakoutWTI oil (USOUSD) is falling towards a pullback support and could potentially break below this level to drop lower towards our take profit target.
Entry: 75.870
Why we like it:
There is a potential breakout level
Stop Loss: 78.437
Why we like it:
There is a pullback resistance that sits above the 23.6% Fibonacci retracement level
Take Profit: 72.714
Why we like it:
There is an overlap support level
Please be advised that the information presented on TradingView is provided to Vantage (‘Vantage Global Limited’, ‘we’) by a third-party provider (‘Everest Fortune Group’). Please be reminded that you are solely responsible for the trading decisions on your account. There is a very high degree of risk involved in trading. Any information and/or content is intended entirely for research, educational and informational purposes only and does not constitute investment or consultation advice or investment strategy. The information is not tailored to the investment needs of any specific person and therefore does not involve a consideration of any of the investment objectives, financial situation or needs of any viewer that may receive it. Kindly also note that past performance is not a reliable indicator of future results. Actual results may differ materially from those anticipated in forward-looking or past performance statements. We assume no liability as to the accuracy or completeness of any of the information and/or content provided herein and the Company cannot be held responsible for any omission, mistake nor for any loss or damage including without limitation to any loss of profit which may arise from reliance on any information supplied by Everest Fortune Group.

Crude Oil - New Lows - DailyCrude Oil just printing another LOWER-LOW.
78 support line became now a resitance zone , so we can see 73-74 zone , very soon.
Also OPEC anounced that they estimate an increase in barels per day in 2024-2025 , that is a bearish info beacause they already cut the production every month and the price is still in down trend, so with an slower economy also the demand its lower for OIL...so medium term im bearish on it.

WTI POSSIBLE RALLYOil prices rebounded after experiencing losses last week, primarily due to expectations of a tight supply situation for the rest of the year. This rebound was driven by key factors, including the commitment of major oil producers Saudi Arabia and Russia to maintaining production cuts until the end of the year. The decrease in the U.S. oil rig count also played a role, as it indicated a lack of response from U.S. producers to the current price environment, giving confidence to Saudi Arabia to continue withholding supply from the market. Additionally, concerns about potential supply disruptions in the Middle East related to the Israel-Hamas conflict subsided, contributing to the market's rebound.
The oil market is now closely focused on economic data from China, particularly trade and inflation figures, to gauge commodity demand in the country. While China's oil imports and fuel demand have remained robust, rising stockpiles could lead to a drop in oil imports in the coming months, especially if economic conditions deteriorate. Meanwhile, the overall health of the U.S. economy, another major consumer of oil, remains a factor influencing oil demand, with expectations of weakening demand during the winter season. Additionally, a weaker U.S. dollar is currently providing some support to oil prices, but it may also reflect concerns about a cooling U.S. economy, which could impact oil consumption.
If the trend continues the price might reach levels of 90.51, in the opposite scenario the price might drop to 80.49.
Risk Disclosure: Trading Foreign Exchange (Forex) and Contracts of Difference (CFD's) carries a high level of risk. By registering and signing up, any client affirms their understanding of their own personal accountability for all transactions performed within their account and recognizes the risks associated with trading on such markets and on such sites. Furthermore, one understands that the company carries zero influence over transactions, markets, and trading signals, therefore, cannot be held liable nor guarantee any profits or losses.

USOUSD H4 | Heading into resistanceWTI oil (USOUSD) could rise towards an overlap resistance and could potentially reverse to drop lower towards our take profit target.
Entry: 84.135
Why we like it:
There is an overlap resistance level
Stop Loss: 86.849
Why we like it:
There is an overlap resistance that aligns with the 61.8% Fibonacci retracement level
Take Profit: 81.169
Why we like it:
There is a pullback support level
Please be advised that the information presented on TradingView is provided to Vantage (‘Vantage Global Limited’, ‘we’) by a third-party provider (‘Everest Fortune Group’). Please be reminded that you are solely responsible for the trading decisions on your account. There is a very high degree of risk involved in trading. Any information and/or content is intended entirely for research, educational and informational purposes only and does not constitute investment or consultation advice or investment strategy. The information is not tailored to the investment needs of any specific person and therefore does not involve a consideration of any of the investment objectives, financial situation or needs of any viewer that may receive it. Kindly also note that past performance is not a reliable indicator of future results. Actual results may differ materially from those anticipated in forward-looking or past performance statements. We assume no liability as to the accuracy or completeness of any of the information and/or content provided herein and the Company cannot be held responsible for any omission, mistake nor for any loss or damage including without limitation to any loss of profit which may arise from reliance on any information supplied by Everest Fortune Group.

CRUDE OIL (WTI): Massive Breakout Confirmed 🛢️
Crude Oil remains under a strong bearish pressure.
First, the market violated a solid rising trend line on a daily,
Second, a wide horizontal zone of demand.
The broken horizontal and vertical structures compose
and expanding supply zone now.
I will expect a bearish movement from that to 78.6 - the next horizontal support.
❤️Please, support my work with like, thank you!❤️

Crude Oil - KeyLevelsOil, after breaking the support of the trend line, attempted a comeback and retested the former support line that turned into resistance, from where the sellers managed to defend the price and thus it seems that we only had a discount for a new sell.
Now the price is in an interesting neckline and I, personally, am only looking for a short.

CRUDE OIL (WTI): Detailed Technical Analysis Ahead of FED 🛢️
Multiple time frame analysis on Crude Oil.
Potential scenarios.
Detailed trading plan.
Important key levels.
❤️Please, support this video with like and comment!❤️

How to Trade Crude OilLearning how to trade crude oil requires a nuanced understanding of its fundamental aspects, instruments, and trading strategies. This comprehensive article offers insights into the critical elements that affect crude oil prices, the range of instruments available for trading, and specific strategies traders use in this market.
The Basics of Crude Oil
Crude oil, often referred to as "black gold," is a fossil fuel derived from the remains of ancient organic matter. It serves as a crucial raw material for various industries, including transportation, chemicals, and manufacturing.
Two primary types of crude oil traded on global markets are West Texas Intermediate (WTI) and Brent Crude. WTI is primarily sourced from the United States and is known for its high quality and low sulphur content. On the other hand, Brent Crude originates mainly from the North Sea and serves as an international pricing benchmark.
The Organization of the Petroleum Exporting Countries (OPEC), which includes members like Saudi Arabia, Iran, and Venezuela, plays a pivotal role in determining global oil supply. By adjusting production levels, OPEC influences crude oil prices significantly. Additionally, other regions like Russia and the United States contribute to the world's oil supply, further affecting market dynamics.
Factors Affecting Crude Oil Prices
In oil trading, economics is a fundamental aspect that traders need to grasp to make educated decisions. Several factors drive the price of crude oil, and here are some of the most significant:
Supply and Demand: At its core, the price of crude oil is determined by how much of it is available (supply) versus how much is wanted (demand). An oversupply can depress prices, while high demand can cause prices to spike.
Geopolitical Events: Conflicts, wars, and diplomatic tensions in oil-producing regions can disrupt supply chains, affecting prices. For instance, sanctions on Iran or instability in Venezuela can push prices higher.
Currency Fluctuations: Oil prices are generally quoted in US dollars. A strong dollar can make oil more expensive for countries using other currencies, thereby affecting demand.
Seasonal Changes: During winter, demand for heating oil can rise, pushing crude oil prices up. Conversely, a mild winter might result in lower demand and prices.
Technological Advances: Innovations in extraction methods, such as fracking, can alter the supply landscape, making it easier to extract oil and thereby affecting prices.
OPEC Decisions: As previously mentioned, OPEC has a significant influence on oil prices. Their production quotas can tighten or flood the market, causing price swings.
Economic Indicators: Data like unemployment rates, manufacturing output, and interest rates can indicate the health of an economy, which in turn can affect oil consumption and prices.
How Is Crude Oil Traded?
When learning how to trade crude oil, traders have a variety of instruments to choose from. However, it’s also important to be aware of its trading hours and how leverage is used.
Crude Oil Instruments
Futures Contracts: A futures contract is an agreement to buy or sell a specific quantity of crude oil at a predetermined price on a specified future date. Both WTI and Brent Crude have their own futures contracts traded on exchanges like the New York Mercantile Exchange (NYMEX).
Contracts for Difference (CFDs): This financial derivative allows traders to speculate on oil price movements without owning the actual commodity. Essentially, you're entering into a contract with a broker to exchange the difference between the opening and closing prices of the crude oil position.
Exchange-Traded Funds (ETFs): These are investment funds traded on stock exchanges. ETFs such as the United States Oil Fund (USO) or the SPDR S&P Oil & Gas ETF (XOP) provide exposure to oil prices by either tracking the commodity's price or investing in oil-related equities.
Options: These financial instruments give traders the right but not the obligation to buy or sell crude oil at a fixed price before a certain date. They offer more flexibility but are generally considered riskier due to their complex nature.
Spot Market: In the spot market, physical crude oil is bought and sold for immediate delivery. However, this is less common for retail traders due to the logistical challenges involved.
At FXOpen, we offer both WTI and Brent Crude CFDs. To get started with oil trading, software such as our free TickTrader platform can provide the technical analysis tools necessary to analyse crude markets.
Trading Hours
Crude oil markets are open almost around the clock, offering high liquidity and the potential for trading opportunities at various times. The New York Mercantile Exchange (NYMEX), for example, is open for trading from Sunday evening until Friday afternoon, with a daily trading break. The most active trading hours are generally during the US (9:00 AM to 2:30 PM EST) and European sessions (6:00 AM to 11:00 AM EST).
Leverage
Leverage allows traders to use small amounts of capital to control a larger position. While this can amplify profits, it also increases risk. Most retail traders opt for trading crude oil through CFDs, which often come with higher leverage options, making it essential to manage risk carefully.
Crude Oil Trading Strategies
Given the volatile nature of crude oil prices, traders employ specific strategies to capitalise on price fluctuations. Here are some strategies particularly useful for crude oil trading:
Trend Following with Moving Averages
The trend is your friend, especially in commodities like crude oil. One effective way to follow the trend is by using moving averages, such as the 50-day (blue) and 200-day (orange). When the 50-day crosses above the 200-day, it's generally a bullish signal, and vice versa for a bearish trend. However, as with all technical analysis tools, moving averages can sometimes trigger false signals.
Range Trading
Due to supply-demand dynamics and geopolitical factors, crude oil prices often fluctuate within a specific range. Identifying these ranges can be useful for short-term trading. Traders buy at the lower end of the range and sell at the higher end, applying technical indicators like RSI or Stochastic Oscillator for entry and exit signals.
News-Based Trading
In crude oil markets, news about OPEC decisions, US oil inventory data, geopolitical tensions, and technological advancements can dramatically impact prices. Traders keeping an eye on oil news can take advantage of sudden announcements or an economic release likely to push prices in a particular direction. Given the high leverage commonly available in CFD trading, this strategy can be profitable but also comes with significant risk.
The Bottom Line
In crude oil trading, having the right strategies and tools is essential for success. By understanding the fundamentals, market dynamics, and utilising specific trading techniques, you are now equipped with the knowledge you need to get started. To access these markets with competitive spreads and rapid execution speeds, consider opening an FXOpen account and step confidently into the world of crude oil trading.
This article represents the opinion of the Companies operating under the FXOpen brand only. It is not to be construed as an offer, solicitation, or recommendation with respect to products and services provided by the Companies operating under the FXOpen brand, nor is it to be considered financial advice.

WTI H4 | Potential bullish bounceWTI oil (USOIL) could fall towards a pullback support and potentially bounce off this level to climb higher.
Buy entry is at 83.014 which is a pullback support level.
Stop loss is at 81.200 which is a level that sits under a swing-low support level.
Take profit is at 86.456 which is an overlap resistance that aligns with the 50.0% Fibonacci retracement level.
High Risk Investment Warning
Trading Forex/CFDs on margin carries a high level of risk and may not be suitable for all investors. Leverage can work against you.
Stratos Markets Limited (www.fxcm.com):
CFDs are complex instruments and come with a high risk of losing money rapidly due to leverage. 67% of retail investor accounts lose money when trading CFDs with this provider. You should consider whether you understand how CFDs work and whether you can afford to take the high risk of losing your money.
Stratos Europe Ltd, previously FXCM EU Ltd (www.fxcm.com):
CFDs are complex instruments and come with a high risk of losing money rapidly due to leverage. 72% of retail investor accounts lose money when trading CFDs with this provider. You should consider whether you understand how CFDs work and whether you can afford to take the high risk of losing your money.
Stratos Trading Pty. Limited (www.fxcm.com):
Trading FX/CFDs carries significant risks. FXCM AU (AFSL 309763), please read the Financial Services Guide, Product Disclosure Statement, Target Market Determination and Terms of Business at www.fxcm.com
Stratos Global LLC (www.fxcm.com):
Losses can exceed deposits.
Please be advised that the information presented on TradingView is provided to FXCM (‘Company’, ‘we’) by a third-party provider (‘TFA Global Pte Ltd’). Please be reminded that you are solely responsible for the trading decisions on your account. There is a very high degree of risk involved in trading. Any information and/or content is intended entirely for research, educational and informational purposes only and does not constitute investment or consultation advice or investment strategy. The information is not tailored to the investment needs of any specific person and therefore does not involve a consideration of any of the investment objectives, financial situation or needs of any viewer that may receive it. Kindly also note that past performance is not a reliable indicator of future results. Actual results may differ materially from those anticipated in forward-looking or past performance statements. We assume no liability as to the accuracy or completeness of any of the information and/or content provided herein and the Company cannot be held responsible for any omission, mistake nor for any loss or damage including without limitation to any loss of profit which may arise from reliance on any information supplied by TFA Global Pte Ltd.
The speaker(s) is neither an employee, agent nor representative of FXCM and is therefore acting independently. The opinions given are their own, constitute general market commentary, and do not constitute the opinion or advice of FXCM or any form of personal or investment advice. FXCM neither endorses nor guarantees offerings of third party speakers, nor is FXCM responsible for the content, veracity or opinions of third-party speakers, presenters or participants.

WTI H4 | Falling to pullback supportWTI oil (USOUSD) is falling towards a pullback support and could potentially bounce off this level to rise towards our take-profit target.
Entry: 83.142
Why we like it:
There is a pullback support level
Stop Loss: 81.725
Why we like it:
There is a swing-low level
Take Profit: 86.849
Why we like it:
There is an overlap resistance that algins with the 50.0% Fibonacci retracement level
Please be advised that the information presented on TradingView is provided to Vantage (‘Vantage Global Limited’, ‘we’) by a third-party provider (‘Everest Fortune Group’). Please be reminded that you are solely responsible for the trading decisions on your account. There is a very high degree of risk involved in trading. Any information and/or content is intended entirely for research, educational and informational purposes only and does not constitute investment or consultation advice or investment strategy. The information is not tailored to the investment needs of any specific person and therefore does not involve a consideration of any of the investment objectives, financial situation or needs of any viewer that may receive it. Kindly also note that past performance is not a reliable indicator of future results. Actual results may differ materially from those anticipated in forward-looking or past performance statements. We assume no liability as to the accuracy or completeness of any of the information and/or content provided herein and the Company cannot be held responsible for any omission, mistake nor for any loss or damage including without limitation to any loss of profit which may arise from reliance on any information supplied by Everest Fortune Group.
