USOUSD H4 | Falling to an overlap support?USOUSD is falling towards a key support level and could potentially reverse from here. We could see price bounce up to our take profit target.
Entry: 69.435
Why we like it:
There is an overlap support
Stop Loss: 67.454
Why we like it:
There is an overlap support
Take Profit: 73.466
Why we like it:
There is an overlap resistance that aligns close to the 50.0% Fibonacci retracement
Please be advised that the information presented on TradingView is provided to Vantage (‘Vantage Global Limited’, ‘we’) by a third-party provider (‘Everest Fortune Group’). Please be reminded that you are solely responsible for the trading decisions on your account. There is a very high degree of risk involved in trading. Any information and/or content is intended entirely for research, educational and informational purposes only and does not constitute investment or consultation advice or investment strategy. The information is not tailored to the investment needs of any specific person and therefore does not involve a consideration of any of the investment objectives, financial situation or needs of any viewer that may receive it. Kindly also note that past performance is not a reliable indicator of future results. Actual results may differ materially from those anticipated in forward-looking or past performance statements. We assume no liability as to the accuracy or completeness of any of the information and/or content provided herein and the Company cannot be held responsible for any omission, mistake nor for any loss or damage including without limitation to any loss of profit which may arise from reliance on any information supplied by Everest Fortune Group.
Crude

WTI OIL aiming for an UPSIDE reversal.WTI net buys has been steadily increasing this past few days -- conveying accumulation at the current discounted price range.
WTI just touched 1.0 FIB LEVEL -- the most discounted price range you can get. Expect some notable bounce from the present levels.
The 70.0 level is a strong solid support which has been tested many times in the last 6 months -- and price keeps bouncing off it.
Weekly higher lows has been created signifying that the present price as the last base before the incoming series of ascend.
Spotted at 72.0
TAYOR
Safeguard capital always.

USOILSPOT H4 | Resistance overhead?USOILSPOT is rising towards a key overlap resistance and could potentially reverse from this level. Price could hit our sell entry at 74.552 and potentially move lower from here. Our stop loss will be at 76.931 which is an overlap resistance that aligns close to the 61.8% Fibonacci retracement. The take profit level will be at 71.726 which is an overlap support.
Any opinions, news, research, analyses, prices, other information, or links to third-party sites contained on this website are provided on an "as-is" basis, as general market commentary, and do not constitute investment advice. The market commentary has not been prepared in accordance with legal requirements designed to promote the independence of investment research, and it is therefore not subject to any prohibition on dealing ahead of dissemination. Although this commentary is not produced by an independent source, FXCM takes all sufficient steps to eliminate or prevent any conflicts of interest arising out of the production and dissemination of this communication. The employees of FXCM commit to acting in the clients' best interests and represent their views without misleading, deceiving, or otherwise impairing the clients' ability to make informed investment decisions. For more information about the FXCM's internal organizational and administrative arrangements for the prevention of conflicts, please refer to the Firms' Managing Conflicts Policy. Please ensure that you read and understand our Full Disclaimer and Liability provision concerning the foregoing Information, which can be accessed on the website.

Oil is shaping to a bearish wedge pattern.Hi, I can see a wedge in the Oil 4H time frame. The entry level is between 74.20-74.8. You can set your stop loss at 75.1 and your target for this pattern should be at 71, 70.1 and 69. It's better to wait and watch for price consolidation at the entry point before entering the trade.

USOILSPOT H4 | Rising into 61.8% Fibo resistanceUSOILSPOT could rise towards a key overlap resistance and potentially reverse from this level. Price could hit our sell entry at 76.759 and drop down from here. Our stop loss will be at 78.944 which is an overlap resistance. The take profit level will be at 74.203 which is an overlap support.
Any opinions, news, research, analyses, prices, other information, or links to third-party sites contained on this website are provided on an "as-is" basis, as general market commentary, and do not constitute investment advice. The market commentary has not been prepared in accordance with legal requirements designed to promote the independence of investment research, and it is therefore not subject to any prohibition on dealing ahead of dissemination. Although this commentary is not produced by an independent source, FXCM takes all sufficient steps to eliminate or prevent any conflicts of interest arising out of the production and dissemination of this communication. The employees of FXCM commit to acting in the clients' best interests and represent their views without misleading, deceiving, or otherwise impairing the clients' ability to make informed investment decisions. For more information about the FXCM's internal organizational and administrative arrangements for the prevention of conflicts, please refer to the Firms' Managing Conflicts Policy. Please ensure that you read and understand our Full Disclaimer and Liability provision concerning the foregoing Information, which can be accessed on the website.

USOIL Local Pullback From Resistance! Sell!
Hello,Traders!
USOIL is about to retest
A local resistance level of
74$ and from where a local
Pullback is to be expected
So I think that the price
Will soon hit the rising support
Sell!
Like, comment and subscribe to help us grow!
Check out other forecasts below too!

WTI OIL Triangle closing decides the trend.WTI Oil (USOIL) has easily hit our short-term target (see chart below) and is now consolidating:
This consolidation is being done within a Triangle pattern, which as we saw on Friday it remained valid despite the fact that the price broke marginally above it, as the 4H candle closed eventually back inside it. This suggests that the (currently neutral trend) will change only when we have a 4H candle closing outside of the Triangle.
If that is above it, then we will buy and target within the 76.50 Resistance and the 4H MA200 at 75.50. If it closes to the downside, we will sell towards the Support and target 68.00. The fact that the 1D RSI is above its MA line, indicates that the bullish case is slightly favored.
-------------------------------------------------------------------------------
** Please LIKE 👍, FOLLOW ✅, SHARE 🙌 and COMMENT ✍ if you enjoy this idea! Also share your ideas and charts in the comments section below! **
-------------------------------------------------------------------------------
💸💸💸💸💸💸
👇 👇 👇 👇 👇 👇

Crude Oil (WTI) 2 Scenarios Explained 🛢️
WTI Crude Oil is stuck between 2 solid structures.
Depending on the reaction of the price to these structures, I see 2 potential scenarios.
Bullish Scenario.
If the price breaks and closes above 74.3 resistance on a daily,
a bullish continuation will be expected to 76.57 level.
Bearish Scenario.
If the market drops and closes below 69.4 support,
a bearish movement will be expected to 65.0 level.
Wait for a breakout, it will show you the future direction of the market.
❤️Please, support my work with like, thank you!❤️

WTI CRUDE OIL Confirmed buy opportunityWTI Crude Oil is rebounding on the Rising Support, internally inside the Channel Down pattern.
The 1day RSI remains under 50.00, so there is still time to buy this bullish wave to the top of the Channel Down.
Target the 1day MA100 at 76.00.
Open 1st Sell there and 2nd (if required) on the 1day MA200 (which formed the previous top) at 79.50. Target on both Support A at 64.50.
Additional indicator to sell, when the 1day RSI hits 60.00.
Previous chart:
Follow us, like the idea and leave a comment below!!

Will WTI follow Natty into the basement? Is WTI going to suffer the same fate as Natural Gas ? Endearingly referred to as Natty ? Well the good ship Natty got REKT last week. The long side which was overcrowded, overleveraged caught the "to da moon" bagholders off guard . Stunned whilst spitting out the kool aid they were seen gasping for air when the dead cat bounce rocked the boat ., Natty was batterred and was last seen heading into shallow water dangerously close to the rocks . Choppy water ahead alert the marine units.
The setup on CL very same chart right before the dump so spread out grab your umbrellas !!!
The trade : Let price action have the final say on your entry get the best price you can very important! Patience pays when shorting! Monday may get some purchasing for the week early on so shorts may get pinched a bit before any ride either way. Wednesday the EIA inventory numbers are relesed at 10:30 EST. OPEC meeting also this week I believe so expect volatility. Sell 83.60 & higher use stops longer time frames target 59.50 might be best move of the year if it goes. Record or near record inventory build over the last month so stay tuned! Not a trade recommendation or a reccomendation to buy or sell securites of any kind.

WTI REMAINS IN RANGECrude oil prices consolidate around 68 and 77 dollars per barrel, remaining below the heights of March and April. The risk of downside movement is fueled by the slow recovery of China and their slow demand increase, higher interest rates on demand and uncertainty around US economy.
On the other hand, if the prices dip too low, the countries of OPEC+ will be fast to decrease the supply in order to mitigate further down movement.
The price will most likely keep ranging between 68 and 77 dollars, but if it breaks the support, it might fall to 64, while if the resistance gets broken, the price might target levels of 83.50.
Risk Disclosure: Trading Foreign Exchange (Forex) and Contracts of Difference (CFD's) carries a high level of risk. By registering and signing up, any client affirms their understanding of their own personal accountability for all transactions performed within their account and recognizes the risks associated with trading on such markets and on such sites. Furthermore, one understands that the company carries zero influence over transactions, markets, and trading signals, therefore, cannot be held liable nor guarantee any profits or losses

CRUDE OIL - SHORT SCALP TRADEI will Short Crude Oil , this area look like distribution so in the next moment we can see a downtrend continuation

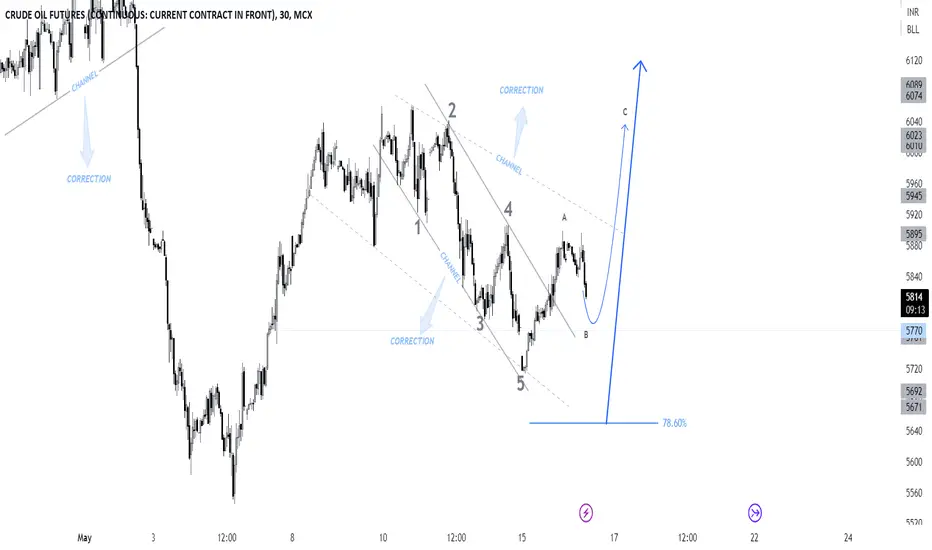
Crude Oil Next MovePair : Crude Oil
Description :
Impulse Correction
RSI - Divergence
Completed " 12345 " Impulsive and " AB " Corrective Wave
Break of Structure
Flag Pattern
Bearish Channel as an Correction in Short Time Frame with the Breakout of the Upper Trend Line and Retracement
WTI OIL: Trend changing to bullish.WTI Oil pulled back as we expected on our previous trade and filled the 0.618 Fibonacci level.
Consistent with the March 24th 0.618 Fib fill (and the RSI on a harmonic buy level), a rebound now is heavily favored as the Falling Resistance from the prior market top, has already broken.
Trading Plan:
1. Buy on the current market price.
Targets:
1. 76.00 (MA200 4h).
Tips:
1. RSI (4h) crossed above the MA, as it did on March 27th on the previous market rally. This is an additional strong buy signal.
Please like, follow and comment!!
Notes:
Past trading plan:

CRUDE OIL (WTI) Bearish Pattern Explained🛢
WTI Crude Oil has recently reached a key horizontal resistance.
Testing that, the price formed a head and shoulders pattern.
Its neckline was broken yesterday.
The price is currently retesting that.
I believe that selling volumes are currently accumulating.
Probabilities are high that we will see a bearish move soon.
Goals will be: 69.87 / 68.11
❤️Please, support my work with like, thank you!❤️

WTI BEARISH OUTLOOK CONTINUESThe weak trade and inflation data from China further casts doubt on the ability of fast economical recovery of the country after COVID.
This puts a rench in OPEC's forecast that China will drive the demand for crude oil to record high.
The technical indicators are also confirming the downtrend, with MACD histogram being below 0 and RSI under 50 neutral line.
If this scenario continues, the price of the instrument might test levels of 64 and even 62. In the opposite scenario, the price might revert and test 77 point resistance.
Risk Disclosure: Trading Foreign Exchange (Forex) and Contracts of Difference (CFD's) carries a high level of risk. By registering and signing up, any client affirms their understanding of their own personal accountability for all transactions performed within their account and recognizes the risks associated with trading on such markets and on such sites. Furthermore, one understands that the company carries zero influence over transactions, markets, and trading signals, therefore, cannot be held liable nor guarantee any profits or losses.

WTI BEARISH OUTLOOKThe price of WTI fell with 1.15 USD last trading day, due to expectations by investors that Fed will keep increasing the interest rate. US CPI had risen in April and is suggesting that the interest rates will remain high.
Nearly 3M barrels oil inventory growth, weaker imports in April and slow export growth to China are putting additional downward pressure to the price of the crude oil.
Both RSI and MACD indicators are also suggesting continue of the down trend. If this trend continues, the price might test levels of 64 USD.
In the opposite scenario, the price might reach levels of 77 USD.
Risk Disclosure: Trading Foreign Exchange (Forex) and Contracts of Difference (CFD's) carries a high level of risk. By registering and signing up, any client affirms their understanding of their own personal accountability for all transactions performed within their account and recognizes the risks associated with trading on such markets and on such sites. Furthermore, one understands that the company carries zero influence over transactions, markets, and trading signals, therefore, cannot be held liable nor guarantee any profits or losses.

Crude Oil Ka-BoingNice long tail on the weekly chart, after a lower low. Technical indicators MACD and VolDiv appear bearish but this is suspiciously like a hidden dragon.
Taken altogether, the first resistance is 76, and once close above 80 is firmed bullish. The lower low suggests more downside, but the length of that tail is telling a very bullish story for the next couple of weeks.
So... expecting a consolidation range fighting between bears and bulls between 70-80; while leaning towards a bullish breakout much later... perhaps (ideally) after higher low.
Do note that in alignment to the earlier post about the USD dropping, it does look like Crude now has a better chance of turning around to reinstate its bullish efforts.

WTI Crude Volatility Hello traders,
As you can see from the chart above, the low at 63 last Thursday was fiercely rejected for a bounce up into the long but we are not out of the woods just yet as far as bearish dumps are concerned. Tomorrow will be a crucial start for WTI in order to determine its next short to medium term direction with key fundamentals and geopolitical machinations at play. Trade safely with conservative lot sizes until the excess volatility has moderated.

Oil One Step From a Major Buy SignalThursday brings us a short update on brent oil. This instrument has been heavily bombarded recently by the macro data, not only for oil, but also the macro data for the USD.
Let’s start with the one for oil. Yesterday’s inventories. Data came in hot (bullish for oil) as the number were significantly below expectation, showing a decrease of 4.5 mln barrels from the previous week. Well, how about that?
As for the USD, yesterday’s less hawkish FED was bearish for the dollar, so again, bullish for instruments quoted in the dollar like our oil. So, we had two positive sets of information for oil and yes, brent used it wisely.
Oil One Step From a Major Buy Signal
As was widely expected, the Federal Reserve raised its policy rate by 75 basis points (bps) at the July meeting, taking the target rate range to 2.25%–2.5%. This is just below the Fed’s estimate for a neutral policy stance in the longer run (2.5%). At the press conference, Chair Jerome Powell said that “modestly restrictive” monetary policy is warranted by the current economic fundamentals, including elevated inflation, and mentioned that another outsize rate hike may be necessary at the next meeting in September in order to ensure monetary policy is restrictive.
The overall movement of gold prices was bearish since inflation numbers rose and the U.S dollar index moved bullishly. However, there might be a change in the situation as gold prices currently moving upward while the U.S dollar index stalled and the stock market is trading slightly lower. If gold prices could continue the bullish movement and close above $1,800 then the bullish trend is set to continue.
Silver prices bounced from the $18.50 support level and made a bullish close yesterday. There is a bullish continuation in today’s trading session which brings the price near the $20.00 handle. If the price could maintain the bullish pressure and continue upward to close above $21.35 then the price will start a new bullish trend.
Crude oil prices situation is not good for the bull as the price could not maintain the bullish pressure. There is a bullish attempt today but the price currently trading below the opening level. If the price is pushed lower and closes below $95.25 then traders will prepare for a bearish continuation.
How far will OIL GO UP?
Well, if you ak this question then you are no professional, experienced trader, but a naive one, and have not understoad the purpose of trading.
Keep it simple. Keep your stops alert.

Crude Oil Gives up OPEC Cut GainOIL STRATEGY POWER SELL
Already predicted the Fall of ENERGY and Oil months ago.
Crude oil prices edged lower Monday, extending a two-week slide in which macroeconomic concerns and signs of weakening refined product demand have outweighed a surprise supply cut made by some OPEC+ members on May 2.
A group of large oil producers led by Saudi Arabia said Sunday they would cut more than a million barrels of output a day starting next month, a surprise move that upset Washington and led to a jump in crude prices amid concerns about the global economy.
The output cut adds to a reduction of 2 million barrels a day agreed to in October by the Saudi-led Organization of the Petroleum Exporting Countries and a group of other producers led by Russia. Taken together, the output cuts amount to about 3% of the world’s petroleum production taken off the market in seven months.
Futures on WTI crude oil, the U.S. benchmark, declined more than 1% Friday's closing price and were trading for less than $76 a barrel, about where they settled on March 31, the last trading day before the surprise cut was made. That's down from a peak of over $83 a barrel reached in the second week after the oil cartel's announcement.
Analysts are pinning today's drop on Chinese government data released over the weekend showing that manufacturing activity fell between March and April. China is the world's second-largest consumer of oil, behind the U.S.

CRUDE to bounce a bit, if at all, else dive hardBased on Crude's weekly chart, it clearly lost the bullish plot (posted 1st May, see linked post). As of the current Crude futures price action, a few preliminary observations can be recorded...
1. A lower low is recorded, and this aligns with the weekly technical outlook of a more bearish close to the weeks ahead;
2. Yesterday closing at 68.52 broke down all prior marked supports, except for the TDST at 66.12.
Note that a close below and 3 days of closing below 66.12 changes Crude into a bearish primary trend. So, expect a lot of dancing about (or bounces off) this area, until that happens.
3. Today closing is important... IF closing at current levels, then a bounce to 74-76 can be expected, due to the long shadow/tail (green ellipse). Otherwise, a breakdown below the TDST support level turns all bearish.
4. Technically, it appears to favour further downside once market hours open. MACD and VolDiv on the daily are aligned to weekly indication of more downside momentum, having already crossed into bear territory.
Watch the USD... it has a lot to do with the magnitude, although other fundamentals will affect Crude directly. Mindful that tomorrow is the Non-farm Payrolls.

Crude lost the bullish plotIt appears that Crude lost the bullishness.
Initially in March, Crude broke up into the range, and expected bullishness to breakout on the other side, which gave much upside. This was followed by a marubozu and then a gap up. Thing is, it met resistance and failed. Breaking back down and now almost closing the gap.
Once the gap is closed, looking for 66-70 for a period to consolidate. MACD is weakening, VolDiv crossing down very soon.
