WTI CRUDE OIL: Aggressive sellingWTI Crude Oil is on a strong selloff that was accurately anticipated by our firm on the 1D MA200 rejection, making a LH on the long term Channel Down and providing us with the most optimal sell entry. The 4H technicals are oversold but the 1D remains on standard bearish price action (RSI = 42.644, MACD = 0.240, ADX = 42.786) and we don't expect this selling to take a pause before the 1D RSI tests the S1 (39.50).
Our short term target has always been 74.00 and after a short lived rebound we expect 72.00. Unless 1D closes a candle above the 1D MA50, in which case a bigger rebound is possible to 80.00 before an even deeper fall to 66.00.
Prior ideas:
## If you like our free content follow our profile to get more daily ideas. ##
## Comments and likes are greatly appreciated. ##
Crude

HAS CRUDE OILD FOUND SUPPORT @ 77?A bullish close after today's trading will provide more confirmation. however, price has tested the support level at 77 for the past 4 days and bulls keep sending price high every time bears brought the price low...
N.B!
- USOIL price might not follow drawn lines . Actual price movement may likely differ from the forecast.
- Let emotions and sentiments work for you
- ALWAYS Use Proper Risk Management In Your Trades
#usoil
#crudeoil
#wti
#brentoil

CRUDE OIL - SELL AND BUY SCENARIOSThe trend on the 1h time-frame is broken, but until the resistance (green line) is bearish because part of the GAP has not yet been completely closed and we can have a rise up to the resistance from which a rejection can follow and then a closing of the gap and barely then a climb with breaking resistance, so I would wait now to see what happens. But I'm looking to enter BUY

Weekly FOREX Forecast: April 24 - 28th (Part 1)Welcome to another Forex Daily Forecast!
We will be preparing for the trading week ahead:
- Analysis of the individual currency Futures, to identify the strong and the weak
- Analysis of the FX pairs (EURUSD, EURCAD, ...)
- Analysis of Gold, Silver, and OIl too!
- Plot and plan for the best setups.
I'm taking my time with this analysis with the viewer in mind. I want you to see the markets through my eyes, so the analysis is fresh, done live, for you to learn how to do this yourself. I want to raise independent traders, capable of reading the markets and planning their own trades. I'm hoping we can end up raising each other's level, in an "iron sharpens iron" kind of way, coming together and sharing trade ideas in our community of traders.
Always remember, just because they aren't setting up now, doesn't mean it won't set up later! So stay tuned for updates!
We are going to look in depth at the forex market, using top down analysis. If you have a question on any of the content, please leave a message in the comments section. For beginners, this is how you analyze forex markets, identify supply and demand zones, key levels of support and resistance, and look for swing trade setups.
Smash a LIKE and tell me what you think in the comments section! These things help to grow this channel! I appreciate your support and feedback, my people! It encourages me to continue to provide free content to the public, in hopes to grow a community of sharp traders.

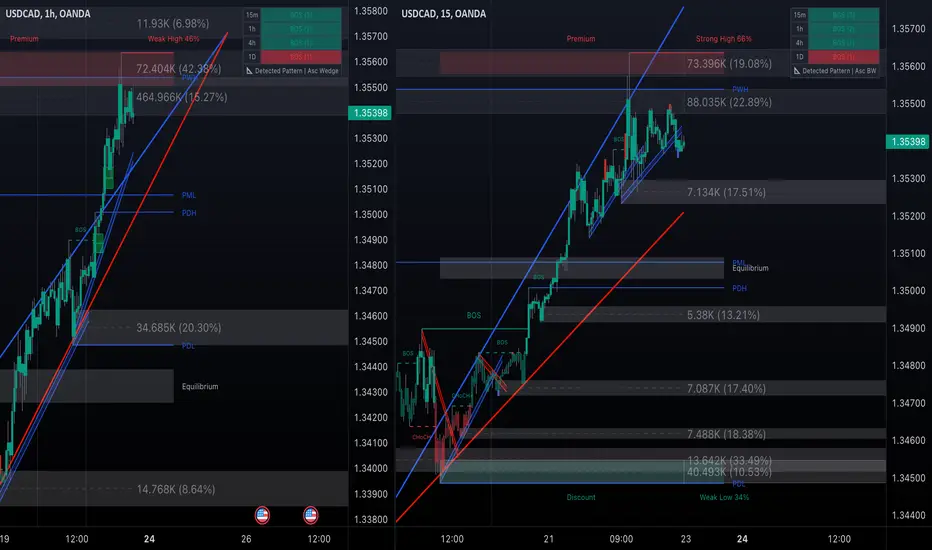
USD/CAD - On the READYOANDA:USDCAD
1H price action hitting resistance order blocks above, and top range (premium) of the most recent swing structure.
Price unable to break above, and looking for possible short scalps on the 15m when structure breaks to the downside.
WTI, preppin for reverse to the upside, again.WTI, is preparing again to reverse to the upside after a much needed correction.
shorters are weakening at the current price levels.
SEEDED L at 77.0

USOIL - Crude
after the last update. bullish move went untill crude hit 200dma. Now we might see a slight pull back to rsi to get reset and further bullish course of action may be expected.
Previously broken trendline will now work as support. and around 85 we might see a supply zone

Crude Oil - Why i am BearishThere are several aspects that I am bearish on this chart.
First of all, we have a huge GAP on daily that must be closed soon.
Secondly, Wednesday's stock data came below those of the market, so the crude oil stock is higher than the estimates, which is very bad because they have already reduced production by 1.5mln/day, which means that unless they . had reduced production, now the price of Crude Oil would have been between 50-60 usd/barrel.
Now the graph shows us a close below the resistance zone, which at least for a short time, I will have a SHORT position.
Also, look at the RSI , its over bought and we need a corection of price to create more demand.

CRUDE OIL H4 Trading The Bullish SequenceIN this update we review the recent price action in #crude oil futures contract and identify the next high probability trading opportunity and price objectives to target

WTI OIL on a triple Resistance test! Get ready for a big move.WTI Oil (USOIL) has gone a long way since our buy call a month ago, that not only did it hit its target but smashed through the Jan Lower Highs and the 1D MA100:
The critical development of the week is that it hit the 1D MA200 (orange trend-line) for the first time since August 30 2022. Naturally that alone constitutes big news as along with the 83.35 High of December 01 and the top (Lower Highs trend-line) if the 8-month Channel Down, form a Triple Resistance Cluster.
In our opinion, as long as the price is inside the Channel Down, we have a huge long-term sell opportunity, with Target 1 being on the 1D MA50 (blue trend-line) at 76.50.
If on the other hand breaks above the Channel Down, we will hedge buy on the short-term and target the 1W MA50 (red trend-line) at 88.00, which is untouched since October 10.
-------------------------------------------------------------------------------
** Please LIKE 👍, FOLLOW ✅, SHARE 🙌 and COMMENT ✍ if you enjoy this idea! Also share your ideas and charts in the comments section below! **
-------------------------------------------------------------------------------
💸💸💸💸💸💸
👇 👇 👇 👇 👇 👇

Crude Oil pushing into its 200-day ma and downtrendA close above the downtrend at 85.00 will trigger a move to its 55-week ma and ultimately to 100+ we believe.
Disclaimer:
The information posted on Trading View is for informative purposes and is not intended to constitute advice in any form, including but not limited to investment, accounting, tax, legal or regulatory advice. The information therefore has no regard to the specific investment objectives, financial situation or particular needs of any specific recipient. Opinions expressed are our current opinions as of the date appearing on Trading View only. All illustrations, forecasts or hypothetical data are for illustrative purposes only. The Society of Technical Analysts Ltd does not make representation that the information provided is appropriate for use in all jurisdictions or by all Investors or other potential Investors. Parties are therefore responsible for compliance with applicable local laws and regulations. The Society of Technical Analysts will not be held liable for any loss or damage resulting directly or indirectly from the use of any information on this site.

Oil Gap - A Game Changer for its PricesGap means a runaway in prices or a confirmation of a clean break away from its downtrend line. (Technical)
OPEC-Plus made a surprise announcement to reduce oil production starting May. Unlike OPEC, OPEC-Plus involve many more countries. This signals a synchronise effort to boost crude oil prices. Expect a much higher oil prices to come. (Fundamental)
My recent crude oil videos:
• Crude Oil Outlook - USD106 as major resistance
• Why Crude Oil is Trending Higher Again, Breaking Above US$100
• Correlation - Crude Oil & CPI
• Crude oil a leading inflation indicator
See its link below.
3 types of crude oil for trading:
• Crude Oil Futures
0.01 per barrel = $10.00
Code: CL
• E-mini Crude Oil Futures
0.025 per barrel = $12.50
Code QM
• Micro WTI Crude Oil
0.01 per barrel = $1.00
Code MCL
Disclaimer:
• What presented here is not a recommendation, please consult your licensed broker.
• Our mission is to create lateral thinking skills for every investor and trader, knowing when to take a calculated risk with market uncertainty and a bolder risk when opportunity arises.
CME Real-time Market Data help identify trading set-ups in real-time and express my market views. If you have futures in your trading portfolio, you can check out on CME Group data plans available that suit your trading needs www.tradingview.com

CRUDE - the technical alignment to the UPside Part IIThe daily chart shows greater details as to why a shallow retracement of sorts is expected.
The Gap occurred after the Sell Setup completed. This becomes an overextension. The overextension is now a collection of 4 dojis of indecision. This tells that it is not a Gap and Run scenario, and leaves the Gap and close to be more likely.
The technical indicators MACD and VolDiv are also tapering off and need to retrace to launch further into the longer term picture.
The gap is denoted by the red box.
The expected bounce zone by the green box inside the red box.
Noted that the daily trend is still a bear trend as the TDST Resistance of 80.94 was not exceeded by the Sell Setup closing 31 March. This is again another point suggesting a retracement... before a new Sell Setup can be started to break above 80.94.
Oh... watch the orange 23-week EMA levels too!
Btw, for more info on these Buy/Sell Setups, you should look into Thomas DeMark indicators, especially from his original books or the more recent condensed version by Jason Perl.

CRUDE - the technical alignment to the UPsideJsut reviewing Crude, especially in light of the recent major gap up last week after OPEC decided to cut output...
Orientate to the weekly chart shows the TD Setup displayed and the Sell Setup (green box early 2022) and Buy Setup (red box mid 2022). These set the TDST, and the support is at 66.12, being the lowest point of the Sell Setup.
Noted that the Buy Setup did not close below the TDST, and so noted that the long term (weeks) primary trend is bullish.
Price action however, decided to test the TDST in March 2023 and bounced off. This is a bullish sign and was an expected bounce point (trade taken and exited btw, shared in earlier analysis). This bounce off was followed through by a nice gap up and a Sell Setup (bullish) restarted. Noted also that 123.68 is the TDST, which is a little far for the next two weeks, with the exception of an anomaly of very severe events happening, it is unlikely to break that level any time soon.
Nonetheless, there are ranges to watch... the yellow, red, and green boxes denote these.
The yellow box is the major range which Crude is ranging and needs to break out of. Expected to as the break back in a few weeks ago suggests that a breakout is in the cards. You see, when a breakdown is reversed and price breaks back into a range, it tends to go out the other side later.
For now, the gap up represents a gap range that is likely to be tested to close the gap. However, price action, and other technical indicators like the MACD and VolDov are suggesting that the attempt to close the gap would be short lived. For this, a smaller time frame analysis marked out the green box for a probably bounce off support level in the likely to fail close the gap attempt, at about 77.5 to 78.
Shorter term is likely to see a stall up to 82ish.
Long term, bullish, but a shallow retracement and then reversal upside should be in play...

OPEC’s supply cuts pre-empt economic weaknessThe Organisation of Petroleum Exporting Countries and its partners (OPEC+) producers surprised the market with a decision on Sunday 2 April 2023 to lower production limits by more than 1mn barrels per day (bpd) from May through the end of 2023. This decision was announced ahead of the OPEC+ Joint Ministerial Monitoring Committee (JMMC) meeting scheduled on 3 April and was contrary to market expectations that the committee would keep policy unchanged. Over the prior week, OPEC+ ministers were giving public assurances that they would stick to their production targets for the entire year. This cut tells us that OPEC+ is pre-empting weaker demand into the year and was looking to shore up the market.
OPEC+ announcement may have caught speculators by surprise
It is evident Sunday’s decision caught the market by surprise evident from the commitment of trader’s report which showed net speculative positioning in Brent crude oil futures at -44k contracts were 146% below the 5-year average. Sentiment on the crude oil market had been weak prior to the decision.
Demand outlook remains soft amidst weaker economic backdrop
OPEC has been markedly dovish on oil demand for some time relative to other forecasters such as the Energy Information Administration (EIA). This cut helps solve the disparity that existed between OPEC and the EIA. OPEC expects oil demand to grow by around 2mn bpd in 2023. A significant portion of this growth (nearly 710,000bpd) is reliant on Chinese oil demand . Given that such a large amount of demand hinges on a single economy poses a risk to the demand outlook as the pace of China’s recovery post re-opening has not been as robust as previously anticipated. At the same time, tightening credit conditions owing to the recent banking crisis is also likely to weigh on growth forecasts in the rest of the developed world. Global Purchasing Managers Indices (PMI) indicators suggest manufacturing activity has contracted since September 2022.
Supply outlook will be driven by new OPEC+ cuts
Since Russia has been producing less than its notional limit, the reduction on actual production will be less than 1mn bpd. But with Saudi Arabia committing to voluntary reduction of 500,000bpd we would expect the overall decline in OPEC supply to be around 900,000bpd by the beginning of May 2023. Assuming OPEC production holding at the recent 28.9mn bpd for April, our balances would point to an equilibrium in Q2 and a return to a deficit in Q3 and Q4. This deficit is largely a function of OPEC+ cuts as opposed to stronger demand globally. The front end of the Brent crude oil futures curve remains in backwardation with a roll yield of +0.4%
OPEC+ producers can also cut without the fear that they will lose significant market share to non-OPEC members. Previously, OPEC+ would be reluctant to let prices rise too high, as it would incentivise a supply response from US producers. However, US producers today appear more focussed on capital discipline and maximizing shareholder returns. The US also has limited capacity to plug the shortfall created by OPEC+ cuts owing to last year’s unprecedented release from strategic US oil reserves (now at a 40-year low).
Conclusion
In the short term, OPEC production cuts are almost always supportive evident from the recent price reaction Brent crude oil prices have risen (+6.54% ). However, over the medium term, the price response to cuts have been more mixed as they do tend to signal underlying weakness in the supply/demand balance. Either OPEC countries are expecting demand to be significantly weaker or doubt oil production in Russia will decline as sharply as forecasted.
So, with speculative positioning at currently low levels alongside further inventory draws expected later in the year, the risks are titled towards the upside for crude oil prices. However, given the uncertainty in the macro environment, we expect the upside in prices to be capped at about US$90 per barrel.

CRUDE OIL Short From Resistance! Sell!
Hello,Traders!
CRUDE OIL trading below
The strong horizontal level
Of 82$ a barrel after a gap up
And I think that a correction
Is due so I am expecting
The price to go to the
Target level of 77.91$
Sell!
Like, comment and subscribe to help us grow!
Check out other forecasts below too!

Crude Oil: Fibonacci Retracements, Support and Resistance LevelsI've had the opportunity to closely observe the crude oil market's impressive run after its historic dip into negative territory in 2020. To better understand the market's behavior, I've outlined a Fibonacci pull from the low in November 2020 to the high in March 2022. In this idea, I'll discuss the importance of support and resistance levels, as well as Fibonacci retracements, in the context of trading crude oil.
Before diving into the technical analysis, let's first touch on the educational aspect of support and resistance levels. Support levels are price points at which an asset's price is more likely to stop falling and start rising, while resistance levels are the opposite - price points at which an asset's price is more likely to stop rising and start falling. These levels can help traders identify potential entry and exit points for trades.
Similarly, Fibonacci retracements are an analytical tool derived from the famous Fibonacci sequence. They are used to identify potential support and resistance levels by measuring the percentage retracement of an asset's price between a low and a high. The most common retracement levels are 23.6%, 38.2%, 50%, and 61.8% (the most important level).
In my crude oil analysis, the 50% Fibonacci retracement level sits at $66.29 on a log scale. We saw the price tap and test this level for a few days before witnessing a significant gap to the upside. What's particularly intriguing isn't the support we're finding at the 50% retracement level, but rather the support and resistance levels I've outlined at $61.35, $85.88, and $93.33.
Should the price fall below the 50% retracement level, we have the downside support at $61.35. On the other hand, if the price continues moving upwards, we can expect resistance at $85.88 and $93.33. The $93 level is near the 23.6% Fibonacci level, indicating that we may encounter significant resistance at this point.
A few days ago, we observed a sizable gap at around $80 after production numbers were released. Generally, production cuts lead to a higher cost for assets like crude oil, as supply shrinks while demand remains steady.
If oil prices surpass the resistance level of $93-$94, there's a high likelihood we could see oil reaching $180 in the coming years – approximately two years out. Although I would assign a 20% probability to this scenario, it's essential to note that support and resistance levels have proven to be crucial in the history of oil trading. Crude oil is unlike other assets and has a reputation for trapping the herd.
So, where do you stand in the herd today? Understanding and effectively utilizing Fibonacci retracements, support, and resistance levels can be the key to navigating the crude oil market and making informed decisions in your trading journey.

usoil 8h chart buy low after pullback tp 85 usd/bbl🔸Today let's review the 8 hour chart for crude oil . Previous setup was invalidated due to
the unexpected OPEC production cuts. Right now technical outlook flipped to bullish.
🔸Price gapped higher almost 10% after the OPEC production cuts were announced.
Bulls hit the strong overhead resistance at 82 USD/bbl and right now I'm expecting
a short-term pullback and re-test of the key s/r bulls below market price.
🔸Recommended strategy for crude oil traders: expecting short-term pullback and
therefore the recommended strategy for bulls is to buy low after we re-test the key s/r
price levels at 72/73 usd bbl. stop below recent market lows and TP1 is 80 USD/bbl and
TP2 is 85 usd/bbl. This is a swing trade setup, so may take a while. good luck traders!
🎁Please hit the like button and
🎁Leave a comment to support our team!
RISK DISCLAIMER:
Trading Futures , Forex, CFDs and Stocks involves a risk of loss.
Please consider carefully if such trading is appropriate for you.
Past performance is not indicative of future results.
Always limit your leverage and use tight stop loss.

Are you bullish on DXY?Our technical analysis shows DXY testing its long-term breakout level, with positive economic cycles pushing it higher (Indicator 1)
The used indicator shows economic cycles and their negative correlation with the dollar. When economy is overheated, DXY is going up!
Indicator 2 - we see the positive correlation between DXY and energy sector, and negative correlation with tech. The zero line is showing S&P500 as basis point return. Green line is energy sector and tan line is tech sector. Calculations are made for 52 week returns.
Despite expectations, high oil prices mean high demand for dollars. Our DXY target is $120 in the next few months.
Follow us for more expert analysis and trading insights. #DXY #Bullish #Energy #Tech #Analysis #TradingInsights

WTI CRUDE OIL Best sell position inside this 8 month patternWTI Crude Oil is approaching Resistance (1) at 83.50 after OPEC cuts.
The MA200 (1d) is almost there at 83.97 and has been untouched since August 30th.
The pattern is a Channel Up and its top is only a little over Resistance (1).
Trading Plan:
1. Sell on the current market price as the above three levels form the strongest Resistance Zone possible.
Targets:
1. 67.00 initially (Support 1).
Tips:
1. RSI (1d) is under a Rising Support. It is not quite there yet but the very first sign of sideways trading would be an indication of forming a top.
Please like, follow and comment!!
Notes:
This is a continuation of this trading plan:

Crude Oil- News-driven. Financial Wave.Oil rose sharply after news of production cuts. While "news-driven" price reactions are often volatile, we are inclined to continue rising for Crude Oil. Our priority scenario is to continue rising from the low of 64 into the 86 range. Support is around 78.85-77.10.

Oil maintains post OPEC+ gainsAs mentioned in my previous oil update a couple of weeks ago that “the OPEC might have to cut even more production to prevent prices from falling significantly further,” that’s precisely what they did at the weekend, creating a big gap in oil prices. Oil prices eased off their highs slightly, but not by much. At the time of writing, there were approaching the overnight highs again. Where does oil go from here?
Breakaway gap
While gaps typically fill, they don’t always. This could be a breakaway gap in oil prices. The impact of the production cuts could send WTI to at least $85-$90 from here, before we potentially see some real weakness in oil prices again. Any short-term weakness in oil prices could prove to be bear traps, and thus may well be bought.
In case you didn’t read the news, the OPEC+ blindsided the market with a surprise production cut, announced at the weekend. The group agreed to cut nearly 1.7 million barrels of oil per day. The reductions are pledged from next month through year end. Saudi Arabia is again leading the way with 500,000 barrels per day of cuts. Several other Gulf states have joined in with their curbs. Russia, who had already announced a 500k bpd through June, has now extended that through year end.
The OPEC+ decision comes totally unexpected. Given that nearly 1.7 million barrels of oil per day will be held back from global supply, this should keep prices supported. In the short-term we well see some further significant gains in WTI, before the focus turns to weaker demand outlook.
What about the longer-term outlook?
While the OPEC+ cuts are expected to tighten the oil market and may well provide further support to prices in the near-term, the longer-term outlook remains uncertain. After all, a side effect will be a fresh inflationary jolt to the world economy. This in turn may mean even more rate increases than was priced in last week.
Ultimately, a high oil price will hurt demand at a time when household and business finances are overstretched. The thing about oil demand, though, is that it is very price inelastic. So, unless something like Covid happens again, don’t expect to see a material drop in oil prices due to demand weakness. People will not stop driving or travelling by plane because of high oil prices.
Therefore, demand is only likely to get hurt moderately by rising oil prices.
Indeed, oil is a supply-driven market.
Thus, the only way for oil prices to come under significant pressure again is if non-OPEC supply increases sharply. This is possible but will take some time for producers outside the OPEC+ to ramp up their production.
So, the big risk is that this could start another supply war between the OPEC+ and non-OPEC countries such as the US and Canada.

Crude shoots higher on announcement of production cutsWe take a look at the resistance levels following the Saudi Arabia announcement.
We have seen a clean bounce off long term moving averages suggesting that we are likely to see the market gravitate to its 55-week ma at 90.09.
Disclaimer:
The information posted on Trading View is for informative purposes and is not intended to constitute advice in any form, including but not limited to investment, accounting, tax, legal or regulatory advice. The information therefore has no regard to the specific investment objectives, financial situation or particular needs of any specific recipient. Opinions expressed are our current opinions as of the date appearing on Trading View only. All illustrations, forecasts or hypothetical data are for illustrative purposes only. The Society of Technical Analysts Ltd does not make representation that the information provided is appropriate for use in all jurisdictions or by all Investors or other potential Investors. Parties are therefore responsible for compliance with applicable local laws and regulations. The Society of Technical Analysts will not be held liable for any loss or damage resulting directly or indirectly from the use of any information on this site.
