Chasing Oil Spikes? How Geopolitics Can Wreck SetupsOil prices surged over 12% in Asia on Middle East headlines, sparking a surge of volatility across safe-haven currencies and stock market futures during thin trade.
It felt like a good time to provide food for thought to newer traders looking to chase these moves, highlight the mockery geopolitics can make of technical analysis with recent examples, and provide a filter for when the waters may be safer to reenter.
Matt Simpson, Market Analyst at City Index and Forex.com
Crudeoil!

CRUDE OIL (WTI): Pullback From Key Level
WTI Crude Oil looks overbought after a test of key daily horizontal resistance level.
A violation of a minor horizontal support on an hourly time frame after its test
provides a strong intraday confirmation.
I expect a retracement to 66.33 level.
❤️Please, support my work with like, thank you!❤️

CRUDE OIL (WTI): Detailed Support & Resistance Analysis
Here is my latest structure analysis for WTI Oil.
Resistance 1: 63.6 - 65.9 area
Resistance 2: 68.2 - 69.2 area
Resistance 3: 71.4 - 75.2 area
Support 1: 61.8 - 62.8 area
Support 2: 59.0 - 60.8 area
Support 3: 55.1 - 57.2 area
Consider these structures for pullback/breakout trading.
❤️Please, support my work with like, thank you!❤️

XBR/USD Chart Analysis: Brent Crude Reaches 1.5-Month HighXBR/USD Chart Analysis: Brent Crude Reaches 1.5-Month High
In our analysis of Brent crude oil six days ago, we identified a large contracting triangle and a local ascending channel. We also outlined a potential scenario involving a bullish breakout above the upper boundary of the triangle.
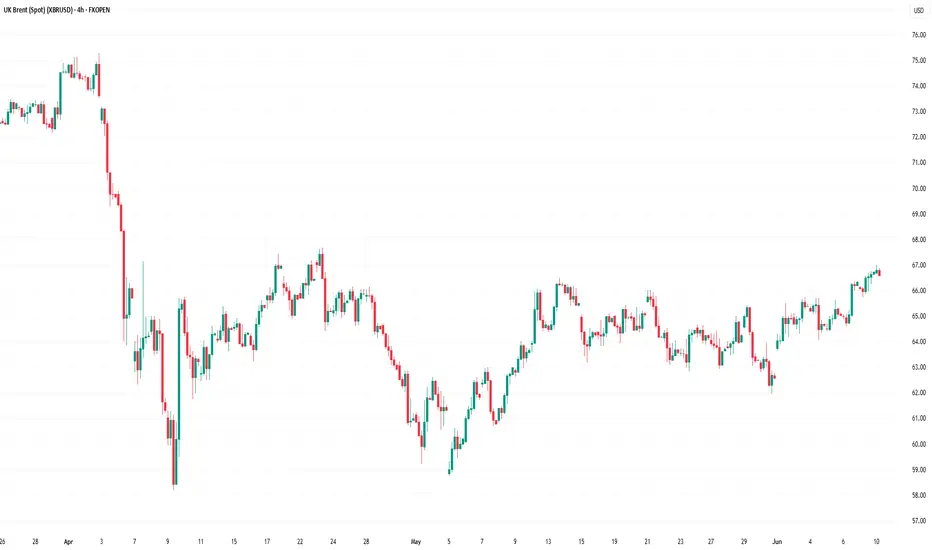
Although this was not the base-case scenario, the XBR/USD chart now suggests it has played out: yesterday, the price climbed to nearly $67 per barrel — its highest level since the end of April.
The main bullish catalyst appears to be ongoing trade talks between the United States and China, which have raised hopes of a resolution to tariff-related tensions between the world’s two largest economies.
At the same time, rising oil prices may exacerbate geopolitical tensions, particularly amid Israeli threats to strike ports in Yemen — a risk that could disrupt supply chains across the Middle East.
Technical Analysis of the XBR/USD Chart
From a technical perspective:
→ Brent crude continues to move within an ascending channel (marked in blue);
→ the upper boundary may now act as a support level.
The fact that the price is holding in the upper half of the channel indicates strong demand-side pressure. Based on this, it is reasonable to assume that as long as Brent remains above the $65.75 level (the retest zone of the breakout), the technical outlook will remain predominantly bullish.
This article represents the opinion of the Companies operating under the FXOpen brand only. It is not to be construed as an offer, solicitation, or recommendation with respect to products and services provided by the Companies operating under the FXOpen brand, nor is it to be considered financial advice.
Crude Oil Tests Monthly High—Bullish or Liquidity Grab? FenzoFx—Crude Oil broke above its previous monthly high at $64.61, trading around $65.27. While a bullish trend is indicated by a 23,000 increase in buy-side contracts, technical signals suggest caution.
RSI 14 shows bearish divergence, and the Stochastic Oscillator remains overbought. Oil could consolidate before resuming its uptrend. Buying breakouts isn’t advised. A dip toward $63.02 may offer a discounted entry.

Weekly Market Forecast: BUY Stock Indices & Oil! Sell Gold! In this Weekly Market Forecast, we will analyze the S&P 500, NASDAQ, DOW JONES, Gold and Silver futures, for the week of June 9 - 13th.
Stock Indices are looking more bullish. Valid buys only!
Gold is weak. Sells only until there is a market structure shift upwards.
Oil prices have room to go higher. Buy it.
Silver is a wait and see. Should start to pull back this week, as it closed last week stronger than Gold.
CPI Wednesday. After the news is announced, the market should be very tradeable for the rest of the week.
Enjoy!
May profits be upon you.
Leave any questions or comments in the comment section.
I appreciate any feedback from my viewers!
Like and/or subscribe if you want more accurate analysis.
Thank you so much!
Disclaimer:
I do not provide personal investment advice and I am not a qualified licensed investment advisor.
All information found here, including any ideas, opinions, views, predictions, forecasts, commentaries, suggestions, expressed or implied herein, are for informational, entertainment or educational purposes only and should not be construed as personal investment advice. While the information provided is believed to be accurate, it may include errors or inaccuracies.
I will not and cannot be held liable for any actions you take as a result of anything you read here.
Conduct your own due diligence, or consult a licensed financial advisor or broker before making any and all investment decisions. Any investments, trades, speculations, or decisions made on the basis of any information found on this channel, expressed or implied herein, are committed at your own risk, financial or otherwise.

Short Crude Oil for The LeapRisk free trade for $100 on MCL
Scaling out of the trade from 4 hour supply to 4 hour demand.
Using the TrendCloud Trading System and it's working great.
So far I'm in the top 7% for this competition.
Focusing on managing this crude oil trade and also the opening range on the MNQ and NQ
Huge win on day 1 for $4000 on NQ opening range using the TrendCloud Trading Strategy.
Backtesting data shows great results. Super proud of this. It took me a month to program everything properly and optimize specifically for the NQ.

XBR/USD Chart Analysis: Oil Price Rises to Key ResistanceXBR/USD Chart Analysis: Oil Price Rises to Key Resistance
Yesterday, the price of Brent crude climbed above $65.60 — the highest level in over a week.
According to media reports, several bullish factors are driving this move:
→ Stalled negotiations between the US and Iran over abandoning Iran’s nuclear programme in exchange for lifting oil export sanctions;
→ Wildfires in Canada, which have significantly reduced oil output;
→ Market reaction to the OPEC+ meeting held over the weekend;
→ A weakening US dollar.
Technical Analysis of the XBR/USD Chart
From a technical standpoint, Brent crude oil:
→ Has been forming a short-term ascending channel (marked in blue) since the beginning of the week;
→ Has approached a major resistance level.
This resistance is defined by the upper boundary of a narrowing triangle, with its central axis around the $63.70 level — a price that could be considered a fair value based on trading over the past one and a half months.
This situation points to two possible scenarios:
→ A downward reversal from the key resistance, with expectations that the price will return to the triangle’s central axis. A break below the lower boundary of the local blue channel would support this scenario.
→ An attempt at a bullish breakout of the triangle. While this scenario cannot be ruled out, it appears less likely due to the global economic slowdown risks posed by tariff-related trade barriers.
This article represents the opinion of the Companies operating under the FXOpen brand only. It is not to be construed as an offer, solicitation, or recommendation with respect to products and services provided by the Companies operating under the FXOpen brand, nor is it to be considered financial advice.

Liquidity Hunt: Crude Oil's Next TargetFenzoFx—Crude Oil remains below the $64.19 resistance level. The Stochastic Oscillator is in overbought territory, and RSI 14 signals bearish divergence, suggesting a possible price dip.
Oil could briefly surpass $64.19 to grab liquidity before facing selling pressure. In this case, a drop toward the $61.72 support level may occur to fill the bullish fair value gap.
However, if Oil stabilizes above $64.19, the bearish outlook becomes invalid.
>>> Trade Crude Oil without swap and low spread at FenzoFx

WTI Crude Returns to $63Over the past two trading sessions, WTI crude oil has gained more than 5%, as confidence has temporarily returned to the market following the latest OPEC+ announcements. The organization recently announced a new production increase of 411,000 barrels per day starting in July, but the volume was lower than anticipated, which has been interpreted as a positive signal for short-term price behavior. This has helped sustain a consistent bullish bias in recent sessions.
Bearish Trend Remains Intact
Since early January, crude oil has followed a steady bearish trend. Currently, the price is approaching the resistance marked by the trendline, and if buying pressure holds in the short term, the bearish formation could come under threat in the upcoming trading sessions.
MACD
At the moment, the MACD histogram shows slight oscillations above the neutral line (0), but it has not yet indicated a decisive market impulse. As a result, a strong sense of short-term neutrality persists, as the price approaches key resistance levels.
RSI
The Relative Strength Index (RSI) is showing a similar pattern: the line is starting to rise, but it is flattening out, which could be weakening the current buying momentum and signaling a possible sideways movement in the short term.
Key Levels to Watch:
$63 – Current Barrier: Aligns with the bearish trendline and could be where price indecision intensifies, leading to continued consolidation.
$57 – Major Support: A recent low. If the price returns to this level, it could reactivate the bearish trend and lead to a deeper sell-off.
$68 – Key Resistance: Located around the 200-period moving average. A breakout above this level could mark the beginning of a new long-term bullish trend.
Written by Julian Pineda, CFA – Market Analyst

CRUDE OIL TO HIT $160?!Oil prices broke down lower in the past few weeks, after a much needed LQ grab, following a 2 year consolidation. We’ve seen a ‘5 Wave Complex Correction’, which should now be followed by price recovery.
Wait for buyers to BREAK ABOVE our ‘buying confirmation’ level, followed a by a retest before buying, otherwise leave it❗️

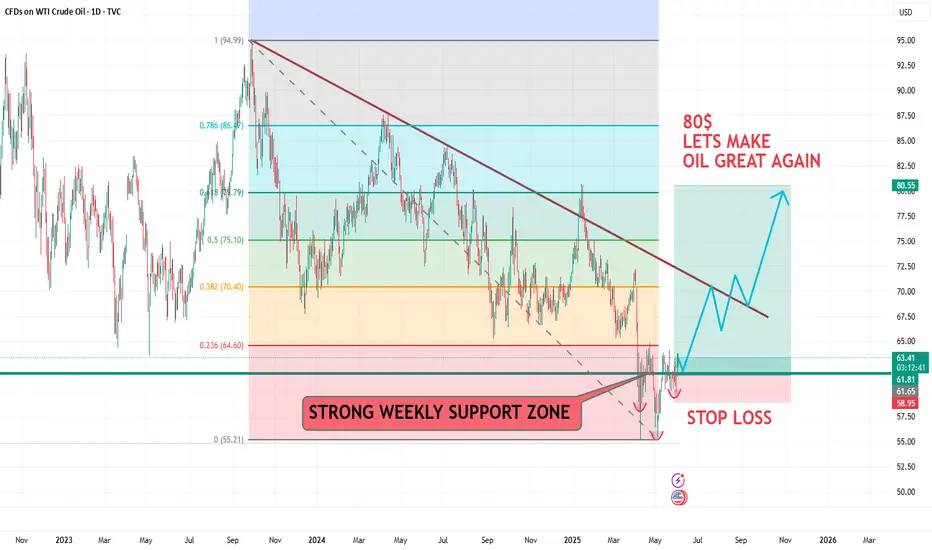
USOIL LETS MAKE OIL GREAT AGAIN TO 80$HELLO TRADERS
As i can see USOIL it formaing H & S pattrent and now trading above a strong Weekly horizontal Support zone if prices hold above 65$ then given Tp can be easy target if we see a higher demand and tight supply with the War going on around the world its a huge possibilty that pricce can shoot up we have to monitor the 65$ price zone which is importat to hold bull cycle on smaller TF 4HR it is creating Wickoff pattren too and we can see Fibo levels golden ratio can hit our targers or risk reward is great for us becaus we was buying the dip in May it is just starting chart is crystal clear its just a trade idea share your thoughts we appriciate ur comments and support Stay tuned for more updates
CRUDE OIL Swing Short! Sell!
Hello,Traders!
USOIL keeps growing
And Oil is locally overbought
So after the price hit a very
Strong resistance level
Around 65.00$ we will be
Expecting a pullback and
A local bearish correction
Sell!
Comment and subscribe to help us grow!
Check out other forecasts below too!
Disclosure: I am part of Trade Nation's Influencer program and receive a monthly fee for using their TradingView charts in my analysis.

Market Analysis: WTI Crude Oil Price Could Gain Bullish PaceMarket Analysis: WTI Crude Oil Price Could Gain Bullish Pace
WTI Crude Oil is gaining bullish momentum and might even test $62.75.
Important Takeaways for WTI Crude Oil Price Analysis Today
- WTI Crude Oil climbed above the $60.50 and $60.80 resistance levels.
- There was a break above a key bearish trend line with resistance at $60.80 on the hourly chart of XTI/USD at FXOpen.
WTI Crude Oil Price Technical Analysis
On the hourly chart of WTI Crude Oil at FXOpen, the price started a fresh upward move from $59.45 against the US Dollar. The price gained bullish momentum after it broke the $60.00 resistance.
The bulls pushed the price above the 50% Fib retracement level of the downward move from the $62.76 swing high to the $59.45 low. The price even climbed above the 50-hour simple moving average. Besides, there was a break above a key bearish trend line with resistance at $60.80.
It tested the $61.50 resistance zone and the 61.8% Fib retracement level of the downward move from the $62.76 swing high to the $59.45 low.
The RSI is now near the 50 level and the price could aim for more gains. If the price climbs higher again, it could face resistance near $62.00. The next major resistance is near the $62.75 level. Any more gains might send the price toward the $63.45 level or even $65.00.
Conversely, the price might correct gains and test the $60.80 support level. The next major support on the WTI Crude Oil chart is near the $59.45 zone, below which the price could test the $58.00 zone.
If there is a downside break, the price might decline toward $56.50. Any more losses may perhaps open the doors for a move toward the $55.50 support zone.
This article represents the opinion of the Companies operating under the FXOpen brand only. It is not to be construed as an offer, solicitation, or recommendation with respect to products and services provided by the Companies operating under the FXOpen brand, nor is it to be considered financial advice.

WTI Crude Oil – Bearish Elliott Wave SetupOn the 15-minute chart, I’m tracking a corrective rally in wave (ii) heading toward the 0.618 Fib zone (around 62.2–62.3) before the next major leg lower.
🔻 Bearish target: 52.00
📈 Looking for the final push up before confirming downside continuation.
💬 What are your thoughts on this Elliott Wave count?
For more updates and ideas, check my profile bio!
#WTI #CrudeOil #elliottwave #priceaction #technicalanalysis

Crude Oil is in Buy Side Discount LevelFenzoFx—Crude Oil formed a hammer candlestick pattern near weekly support after losing 4.0% of its value on Thursday. The London session began with a bullish FVG in the lower time frame, with support at $60.55.
The price is expected to target the immediate resistance at $61.3.

USOIL - Bullish Double BottomHello Traders !
The USOIL price formed a double bottom pattern.
Currently, The neckline is broken !
So, I expect a bullish move🚀
_______________
TARGET: 63.49🎯

CL Analysis – May 28, 2025Currently, I believe Crude Oil (CL) is trading within a well-defined range. My strategy is clear:
🔴 Sell only at the red supply zone above, but only after confirmed seller reactions backed by order flow.
🟢 Buy only at the green demand zone below, once buyer strength is confirmed through price action and order flow.
No trades in between — I’m staying patient and letting the market come to my levels.

BRENT outlook: Watching for a move toward the upper boundary (D)Price is currently trading within a broad range, and the main expectation is a move toward the upper boundary — but confirmation is key.
I'm watching the high of the May 22 bar as a key level, since it holds the highest traded volume in recent days.
If price breaks and holds above 64.987 ,
🎯 First target: 67.791
🎯 Second target: 68.619

CL Futures Outlook May 27, 2025 Compression Near Structure ZonesToday, CL is trading just above a key mid-structure zone, continuing its sideways movement between defined supply and demand levels.
🔹 Current Technical Picture:
Price remains inside a compression range
Resistance at the top red zone where price was rejected yesterday
Mid green zone acting as current structure support
Lower green zone marked by last week's strong buyer reaction
Volume profile is neutral, showing no aggressive buyer or seller dominance at the moment. A failed breakout attempt above the descending channel in the previous session keeps this structure coiled and reactive.
🔍 My Outlook:
If price retests the middle zone with strong volume + bullish reaction, it could offer a continuation toward resistance.
If price climbs into the red zone and rejects with weakness, there’s potential for a move back toward the middle zone.
A sharp drop into the lower green zone with strong buyer confirmation would create a high-reward reversal opportunity.
No trades are taken blindly. I only act when price shows clear intent at key levels. Today is a reactive environment — not one for forced setups.
📉 Analysis based on volume structure, order flow, and key S/R zones.
⚠️ This post is for educational purposes only and does not constitute financial advice. Trading futures involves risk.

OPEC Countdown: Inverted H&S Signals Potential Oil Price Rise🧭 Market Context – OPEC in Focus
As Crude Oil Futures (CL) grind in tight consolidation, the calendar reminds traders that the next OPEC meeting takes place on May 28, 2025. This is no ordinary headline event — OPEC decisions directly influence global oil supply. From quota adjustments to production cuts, their moves can rapidly shift price dynamics across energy markets. Every tick in crude oil reflects not just current flows but also positioning ahead of such announcements.
OPEC — the Organization of the Petroleum Exporting Countries — coordinates oil policy among major producers. Its impact reverberates through futures markets like CL and MCL (Micro Crude), where both institutional and retail traders align positions weeks in advance. This time, technicals are speaking loud and clear.
A compelling bottoming structure is taking shape. The Daily timeframe reveals an Inverted Head and Shoulders pattern coinciding with a bullish flag, compressing into a potential breakout zone. If momentum confirms, CL could burst into a trend move — just as OPEC makes its call.
📊 Technical Focus – Inverted H&S + Flag Pattern
Price action on the CL daily chart outlines a classic Inverted Head and Shoulders — a reversal structure that traders often monitor for high-conviction setups. The neckline sits at 64.19, and price is currently coiled just below it, forming a bullish flag that overlaps with the pattern’s right shoulder.
What makes this setup powerful is its precision. Not only does the flag compress volatility, but the symmetry of the shoulders, the clean neckline, and the breakout potential align with high-quality chart pattern criteria.
The confirmation of the breakout typically requires trading activity above 64.19, which would trigger the measured move projection. That target? Around 70.59, which is near a relevant UFO-based resistance level — a region where sellers historically stepped in with force (UnFilled Orders to Sell).
Importantly, this bullish thesis will fail if price drops below 60.02, the base of the flag. That invalidation would potentially flip sentiment and set up a bearish scenario with a target near the next UFO support at 53.58.
To properly visualize the dual scenario forming in Crude Oil, a multi-timeframe approach is often very useful as each timeframe adds clarity to structure, breakout logic, and entry/exit positioning:
Weekly Chart: Reveals two consecutive indecision candles, reflecting hesitation as the market awaits the OPEC outcome.
Daily chart: Presents a MACD bullish divergence, potentially adding strength to the reversal case.
Zoomed-in 4H chart: Further clarifies the boundaries of the bullish flag.
🎯 Trade Plan – CL and MCL Long/Short Scenarios
⏫ Bullish Trade Plan:
o Product: CL or MCL
o Entry: Break above 64.19
o Target: 70.59 (UFO resistance)
o Stop Options:
Option A: 60.02 (tight, under flag)
Option B: ATR-based trailing stop
o Ideal for momentum traders taking advantage of chart pattern combined with fundamental data coming out of an OPEC meeting
⏬ Bearish Trade Plan:
o Trigger: Break below 60.02
o Target: 53.58 (UFO support)
o Stop Options:
Option A: 64.19 (tight, above flag)
Option B: ATR-based trailing stop
o Ideal for momentum traders fading pattern failures
⚙️ Contract Specs – CL vs MCL
Crude Oil can be traded through two futures contracts on CME Group: the standard CL (WTI Crude Oil Futures) and the smaller-sized MCL (Micro WTI Crude Oil Futures). Both offer identical tick structures, making MCL a powerful instrument for traders needing more flexibility in position sizing.
CL represents 1,000 barrels of crude per contract. Each tick (0.01 move) is worth $10, and one full point of movement equals $1,000. The current estimated initial margin required to trade one CL contract is approximately $6,000 per contract, although this may vary based on market volatility and brokerage terms.
MCL, the micro version, represents 100 barrels per contract — exactly 1/10th the size of CL. Each 0.01 tick move is worth $1, with one point equaling $100. The estimated initial margin for MCL is around $600, offering traders access to the same technical setups at significantly reduced capital exposure.
These two contracts mirror each other tick-for-tick. MCL is ideal for:
Testing breakout trades with lower risk
Scaling in/out around events like OPEC
Implementing precise risk management strategies
Meanwhile, CL provides larger exposure and higher dollar returns but requires tighter control of risk and account drawdowns. Traders can choose either—or both—based on their strategy and account size.
🛡️ Risk Management – The Foundation of Survival
Technical setups don’t make traders profitable — risk management does.
Before the OPEC meeting, traders must be aware that volatility can spike, spreads may widen, and whipsaws can invalidate even the cleanest chart pattern.
That’s why stop losses aren’t optional — they’re mandatory. Whether you choose a near level, a deeper stop below the head, or an ATR-based trailing method, the key is clear: define risk before entry.
MCL helps mitigate capital exposure for those testing breakout confirmation. CL demands higher margin and greater drawdown flexibility — but offers bigger tick rewards.
Precision also applies to exits. Targets must be defined before entry to maintain reward-to-risk discipline. Avoid adding to losers or chasing breakouts post-event.
And most importantly — never hold a losing position into an event like OPEC, hoping for recovery. Risk is not a gamble. It’s a calculated variable. Treat it with respect.
When charting futures, the data provided could be delayed. Traders working with the ticker symbols discussed in this idea may prefer to use CME Group real-time data plan on TradingView: www.tradingview.com - This consideration is particularly important for shorter-term traders, whereas it may be less critical for those focused on longer-term trading strategies.
General Disclaimer:
The trade ideas presented herein are solely for illustrative purposes forming a part of a case study intended to demonstrate key principles in risk management within the context of the specific market scenarios discussed. These ideas are not to be interpreted as investment recommendations or financial advice. They do not endorse or promote any specific trading strategies, financial products, or services. The information provided is based on data believed to be reliable; however, its accuracy or completeness cannot be guaranteed. Trading in financial markets involves risks, including the potential loss of principal. Each individual should conduct their own research and consult with professional financial advisors before making any investment decisions. The author or publisher of this content bears no responsibility for any actions taken based on the information provided or for any resultant financial or other losses.

USOil Dips Amid Global Demand WorriesXTI/USD is currently exhibiting bearish technical signals, with key indicators pointing towards potential further declines. However, the presence of oversold conditions suggests that a short-term rebound could occur if prices find support at current levels. Traders should monitor the $60.13 support and $61.38 resistance levels closely, as breaks of these levels could signal the next directional move.
XTI/USD is experiencing a noticeable downward shift in market sentiment. After a period of relative stability, prices have started to decline, influenced primarily by concerns over global demand and shifting geopolitical conditions. Despite earlier support from tensions in Eastern Europe and U.S. sanctions on Russian energy exports, the market now appears to be reacting more to economic headwinds, such as signs of slowing industrial growth in major economies like China and the Eurozone. Traders are closely watching whether current support levels will hold or if the recent downward momentum will lead to a deeper correction. Overall, the sentiment leans cautious, with traders waiting for clearer signals from both supply-side developments and macroeconomic indicators.
Pivot Points:
Support Levels: S1 at $60.13, S2 at $59.69, S3 at $58.88.
Resistance Levels: R1 at $61.38, R2 at $62.19, R3 at $62.63.
Bearish Outlook
Trigger: A break below the $60.13 support level.
Targets: $59.69 followed by $58.88
Invalidation: A decisive move above the $61.38 resistance level.
Bullish Outlook
Trigger: A sustained break above the $61.38 resistance level.
Targets: $62.19 followed by $62.63
Invalidation: A drop below the $60.13 support level.
Note
Please risk management in trading is a Key so use your money accordingly. If you like the idea then please like and boost. Thank you and Good Luck!

Will Middle East Tensions Ignite a Global Oil Crisis?The global oil market faces significant turbulence amidst reports of potential Israeli military action against Iran's nuclear facilities. This looming threat has triggered a notable surge in oil prices, reflecting deep market anxieties. The primary concern stems from the potential for severe disruption to Iran's oil output, a critical component of global supply. More critically, an escalation risks Iranian retaliation, including a possible blockade of the Strait of Hormuz, a vital maritime chokepoint through which a substantial portion of the world's oil transits. Such an event would precipitate an unprecedented supply shock, echoing historical price spikes seen during past Middle Eastern crises.
Iran currently produces around 3.2 million barrels per day and holds strategic importance beyond its direct volume. Its oil exports, primarily to China, serve as an economic lifeline, making any disruption profoundly impactful. A full-scale conflict would unleash a cascade of economic consequences: extreme oil price surges would fuel global inflation, potentially pushing economies into recession. While some spare capacity exists, a prolonged disruption or a Hormuz blockade would render it insufficient. Oil-importing nations, particularly vulnerable developing economies, would face severe economic strain, while major oil exporters, including Saudi Arabia, the US, and Russia, would see substantial financial gains.
Beyond economics, a conflict would fundamentally destabilize the geopolitical landscape of the Middle East, unraveling diplomatic efforts and exacerbating regional tensions. Geostrategically, the focus would intensify on safeguarding critical maritime routes, highlighting the inherent vulnerabilities of global energy supply chains. Macroeconomically, central banks would confront the difficult task of managing inflation without stifling growth, leading to a surge in safe-haven assets. The current climate underscores the profound fragility of global energy markets, where geopolitical developments in a volatile region can have immediate and far-reaching global repercussions.
