Planning for the Next Trade in Crude OilNYMEX:CL1!
Key Levels – Higher Timeframe:
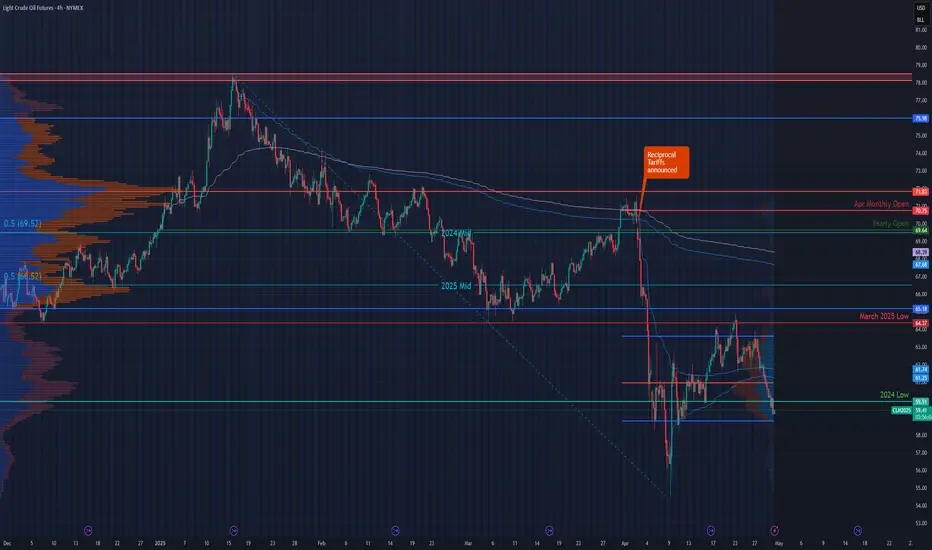
• 2025 High: 78.56
• Yearly Open (2025): 69.64
• 2025 mCVPOC: 71.83
• Yearly VWAP: 68.41
• AVWAP from Yearly Highs: 67.71
• 2025 mCVAL: 65.28
• March 2025 Low: 64.37
• 2024 Low: 59.91
April 2025 Key Levels:
• April mCVAL: 58.79
• April mCVPOC: 60.94
• April AVWAP from Lows: 61.29
• April AVWAP from Highs: 61.76
• April mCVAH: 63.73
Our previous trade idea played out as expected. With updated levels now in place, we aim to reassess the market context without falling into recency or confirmation bias. These biases often lead to an overly bearish outlook at market lows, especially amid ongoing headlines around trade war tensions and supply concerns. While such fundamentals are important, maintaining objectivity is key.
This leads us to the central question: Is all this bearish sentiment already priced in? If so, why are sellers still dominant?
From a broader perspective, the overall context for crude remains bearish. However, this does not imply an immediate continuation to lower prices.
Currently, price is trading below both the midpoint of 2025 and that of 2024. Additionally, the recent price swing failed at the March 2025 low—an important technical rejection. The 2024 low at 59.91 now serves as key structural support. We anticipate further consolidation within the April 2025 value range, specifically between mCVAH (63.73) and mCVAL (58.79).
We define the area between April’s mCVPOC (60.94) and AVWAPs (61.29 / 61.76) as a "noise zone"—a region where price action is likely to be choppy and directionless. This zone is not favorable for directional trades.
Potential Trade Setup – Range-Bound Play
Example Trade 1: Long Crude Oil
• Entry: 59.91
• Stop: 59.20
• Target: 61.76
• Risk: 71 ticks
• Reward: 185 ticks
• Risk/Reward Ratio: 2.6R
Example Trade 2: Long Crude Oil
• Entry: 58.80
• Stop: 58.20
• Target: 61.76
• Risk: 60 ticks
• Reward: 296 ticks
• Risk/Reward Ratio: 4.93 R
Important Notes:
• These are example trade ideas and not financial advice or recommendations.
• Traders should conduct independent analysis and ensure proper risk management.
• Stop-loss orders are not guaranteed; slippage may occur, resulting in losses beyond predefined levels.
• AVWAP levels are accurate at the time of posting, they may vary as indicator further calculates prices with new volume and price information.
Glossary Index for all technical terms used:
ATH: All time high
VPOC: Volume Point of Control
VAL: Value Area Low
VAH: Value Area High
VP: Volume Profile
AVP: Anchored Volume Profile
C: Composite (prefix before VAL, VAH, VPOC, VP, AVP)
mC: micro-Composite (prefix before VAL, VAH, VPOC, VP, AVP)
AVWAP: Anchored Volume Weighted Average Price
Green Zones: Bull/ Buyers support zones
Red Zones: Bear/Seller resistance zones
Crudeoil!
USOIL - Bearish Double TOPHello Traders !
The USOIL price formed a double top pattern.
Currently, The neckline is broken !
So, I expect a bearish move📉
________________
TARGET: 59.410🎯

CRUDE OIL Move Down Ahead! Sell!
Hello,Traders!
USOIL was making a
Bullish correction but
It is in the downtrend
Overall, so as the price
Is hovering beneath the
Horizontal resistance
Of 64.80$ from where
We will be expecting a
Local bearish correction
Sell!
Comment and subscribe to help us grow!
Check out other forecasts below too!
Disclosure: I am part of Trade Nation's Influencer program and receive a monthly fee for using their TradingView charts in my analysis.

Buy idea on Crude Oil (CL1!)Based on :
- US10Y Leading long spike
- Commercials and Non Commercials at Extremes
- Open Interest at Extremes
- Cycles and quantitative data
- Undervalued conditions
-Demand zone

CRUDE OIL BEARISH WEDGE|SHORT|
✅CRUDE OIL has formed a
Bearish wedge pattern and
Then made a breakout and a
Pullback so we are locally
Bearish biased and we will
Be expecting a further
Bearish move down
SHORT🔥
✅Like and subscribe to never miss a new idea!✅
Disclosure: I am part of Trade Nation's Influencer program and receive a monthly fee for using their TradingView charts in my analysis.

Looking to sell CLI'm looking to sell CL futures based on yesterdays' price action on daily chart which suggests that we might see the next leg down in line with Daily downtrend.
Looking to short pending one more move higher to take equal highs created in early London session and looking for breaker lower to structure logic stop loss and sufficient R:R.

Crude Oil Is Making Hard Work of Gains into ResistanceCride oil may have recovered back above $60, but it is making hard work of it. And with resistance looming and large specs increasing short bets, perhaps a pullback due. But does that mean a break below $60 is imminent?
Matt Simpson, Market Analyst at Forex.com and City Index

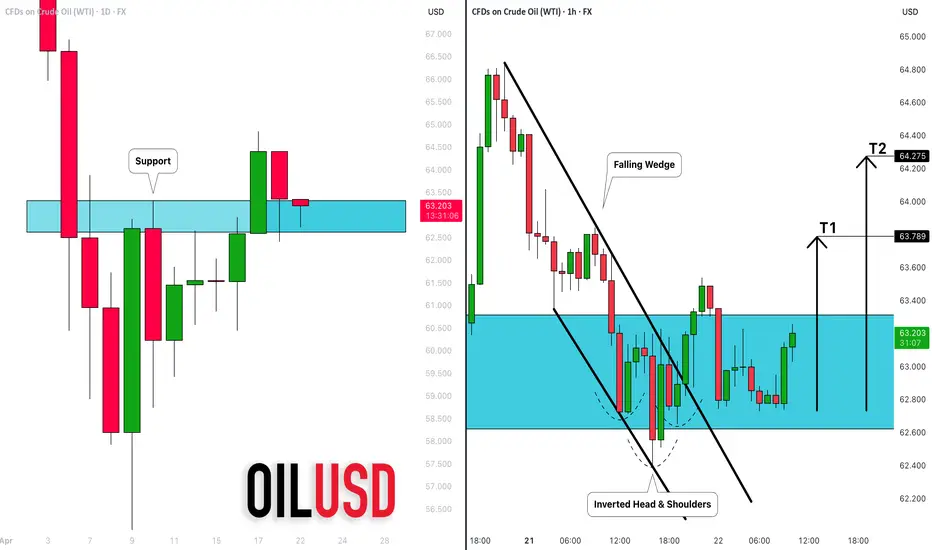
CRUDE OIL (WTI): Long From Support Explained
There is a high chance that WTI Crude Oil will go up
from the underlined key daily support.
As a confirmation, the price violated both a neckline of an inverted
head & shoulders pattern and a resistance line of a falling wedge
on an hourly time frame.
Goals: 63.780 / 64.275
❤️Please, support my work with like, thank you!❤️
Habibi, the Price is Right at 70-79$Habibi, the Price is Right
Post Content (with emojis version of title at the top):
🤝🛢️ Habibi, the Price is Right at 70–79$ 💸🎯
The Call That Never Happened (But Might Have)
📞 I was just updating my crude oil chart when suddenly… my phone rang.
No caller ID. I answered. And somehow— I was patched into a live call between:
🍊🦅 Trump and 🌴👑 the King of Saudi Arabia.
They mistook me for a translator.
So naturally, I stayed on the line.
Here’s how the oil market actually got settled...
🍊🦅 Trump: “Hello? Who is this? I have the best phone security. The Chinese can’t hack it. Nobody can.”
🌴👑 King: “Donald, ya’ani... it’s me!”
🍊🦅 Trump: “Me who? I know the most people, you sound like an immigrant, do you have a visa?”
🌴👑 King: “Your King of Saudi Arabia, habibi! Your favorite oil guy! I can afford all the Visas and Mastercards!”
🍊🦅 Trump: “My King! My favorite King, my guy, what a Tremendous timing. Oil prices are way too high. I need cheap oil to start my tariff wars again! ”
🌴👑 King: “Habibi, we said $88! We need to fund flying taxis and desert ski slopes. The Line isn’t building itself, ya’ani.”
🍊🦅 Trump: “But I gave you the PGA Tour! LIV Golf is huge ! You’re welcome.”
🌴👑 King: “ Mashallah , yes... but we paid this Tiger Woods $800 million just to say no. Wallah , that’s expensive rejection, Donald.”
🍊🦅 Trump: “That’s nothing my King. Peanuts. Melania’s token did better than that. Peanuts my King, peanuts for the camels. What about $76?”
🌴👑 King: “Cristiano Ronaldo costs $200M a year! And he wants an oasis with seven pools! And now we want Messi from Miami and Ronaldinho. Mashallah! ”
🍊🦅 Trump: “I need lower gas prices my King or I can’t revive the economy!
And you made Messi cry in the World Cup, my King — not my fault. You kicked his ass, not my fault..I need to check on his visa if he is legally in my great country (again) or i will send him to El Salvador and you can get him cheap from there”
🌴👑 King: “Inshallah. But we’re also building a ski slope in the desert. With real snow.
We need $88.88 oil Donald! 88$ minimum”
💙🧠 FXPROFESSOR: “Uh... sorry to interrupt... I don’t know how I got on this call... but I think I can help.
I understand charts.”
🍊🦅 Trump: “Who is that?!I know the voice, who is that?”
💙🧠 FXPROFESSOR: “I’m the FXPROFESSOR. And I might have a solution for you.
It’s called… The Compromise Zone. ”
🌴👑 King: “Ya’ani… go on.”
💙🧠 FXPROFESSOR: “$70–79. That’s where the technicals align.
Trump gets a few more months below that, help him with low oil for inflation until he can deal with Powell, then you two take it sideways in that range 70-79$ and you get stability for The Line, the AI and all the great things the Kingdom is working on.”
🍊🦅 Trump: “I know the Professor! I follow him on TradingView. Genius. Huge brain. One of the best brains. I bought Ethereum at 4400$ because of him and I'm down 60% but it's ok..peanuts, great guy the Professor, great guy”
🌴👑 King: “Inshallah. But we still have losses. Ya’ani... Donald, how do we cover them? And how did this guy get on our call habibi”
🍊🦅 Trump: “Easy King, it's easy! We launch a Great meme coin together, me and you, the greatest token in the world. We call it — $KINGOFARABIA —meme token, we Pump it on Solana. We'll pump it like you pump Oil. Gonna be Great, we will Cover the gap my King.”
🌴👑 King: “We tried blockchain before. Royal IT guy lost the wallet. Had to… correct the situation. Plus i also invested on Ethereum Donald, Solana is for the kids and the stuff”
🍊🦅 Trump: “Let's find a solution my King and i will do this for you: I’ll send Jerome Powell. A gift. Let him run your rates. Take him for free (please take him)”
🌴👑 King: “Jerome is good for my country, he is so cold he will make the temeratures drop 2 degrees, ok we take him but One more thing Donald… I want Taylor Swift at my nephew’s wedding? And please she comes dressed properly and act respectfully”
🍊🦅 Trump: “Done. Nobody says no to me. Except from the Feds, the Europeans, the Japanese, Canada and the penguins i taxed by accident. But that's ok, we make America Great again. I will send you the new Trump memorabilia collection, the best MAGA t-shirt for you my King. It's still made in China but it's soon to be made here at home, soon. ”
🌴👑 King: “Wait Donald! I just remembered.. Also... we want UFC in Riyadh, for ever! Big events. I want Dana White to agree and i want a podcast with Josh Rogans.”
🍊🦅 Trump: “I’ll talk to Joe Rogan, great guy Joe. I’ll call Dana. Maybe Khabib makes a comeback. I know fighters. Strong fighters. Big ratings. They love me. They love you too my King”
📉 And that’s how oil found balance between memes, monarchs, and macro.
📊 Chart Insights – USOIL 12h
❌ $93 = clear rejection
🟦 Compromise Zone: $70–79
🟢 $88 = Saudi’s macro target
🔻 $70 = Trump’s inflation floor
🔄 Consolidation expected unless OPEC or Powell shift the game
💬 What do you think? Are we just memeing the macro?
Or is this really how the oil market works in 2025?
One Love,
The FXPROFESSOR 💙🧠
Disclaimer: This is a fictional satire written for entertainment and educational purposes.
Any resemblance to real negotiations is purely… coincidental.
The chart is real, though — and so is the technical compromise.
Special Salam and much love to my friends in Saudi Arabia 🇸🇦 — the most wonderful people I’ve met in the world.The image is not of the new King but that's ok, great image.It's great! ❤️

Weekly Market Forecast WTI CRUDE OIL: Bearish! Wait For SellsThis forecast is for the week of April 21 - 25th.
Oil has made a classic bearish impulse down, then a corrective retracement. The natural expectation is another impulse down. The fact that price pulled back into a W -FVG allows for this bearish expectation.
Wait for a bearish break of market structure to confirm a valid sell setup... and trade accordingly. No confirmation, not trade!
Check the comments section below for updates regarding this analysis throughout the week.
Enjoy!
May profits be upon you.
Leave any questions or comments in the comment section.
I appreciate any feedback from my viewers!
Like and/or subscribe if you want more accurate analysis.
Thank you so much!
Disclaimer:
I do not provide personal investment advice and I am not a qualified licensed investment advisor.
All information found here, including any ideas, opinions, views, predictions, forecasts, commentaries, suggestions, expressed or implied herein, are for informational, entertainment or educational purposes only and should not be construed as personal investment advice. While the information provided is believed to be accurate, it may include errors or inaccuracies.
I will not and cannot be held liable for any actions you take as a result of anything you read here.
Conduct your own due diligence, or consult a licensed financial advisor or broker before making any and all investment decisions. Any investments, trades, speculations, or decisions made on the basis of any information found on this channel, expressed or implied herein, are committed at your own risk, financial or otherwise.

CRUDE OIL... Time to BUYPreviously posted and heads up...
Did not quite work immediately because of POTUS and the Trade War II/
Did a cliff dropper and now it looks about ripe for the rally, confirmation when it is above the resistances shown.
Heads up!

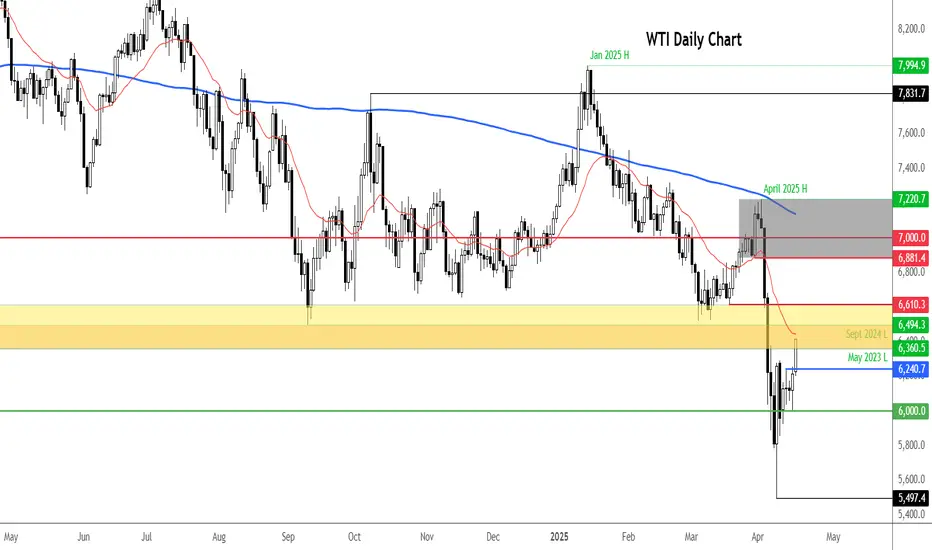
Crude Oil Holds at Key ResistanceFollowing a sharp rebound from the $55 low—mirroring broader market strength and gains in U.S. indices—oil is now hovering near a key resistance level at $64. Meanwhile, major U.S. indices remain below their respective resistance zones, awaiting confirmation of further uptrends.
A sustained break and hold above $64 could open the door for additional upside toward $66 and $70.
On the downside, if gains fail to hold and prices slip back below $64, support levels to watch are $60, $58, and $55.
A decisive break below $55 may trigger a steeper decline, potentially driving oil prices back toward the $49 per barrel region.
Written by Razan Hilal, CMT
Let the Revaluation Continue-Oil to 250 by 2035Oil is roughly as cheap as ever denominated in gold. A significant upside move is due, repricing oil accordingly with gold

Crude rallies on Trump China trade optimism, WTI test key levelCrude oil prices were already on the ascendency but have just hit fresh highs on the day after the latest Trump remarks:
WILL MAKE GOOD DEAL WITH CHINA
WE WILL HAVE A DEAL WITH CHINA
But...
*TRUMP SAYS HE'S IN 'NO RUSH' TO CLOSE DEALS
Anyway WTI has risen to session highs, now testing a major resistance area around $65 give or take $1. The area is shaded on the chart. If we go above this zone then bullish, else the bears remain in control.
By Fawad Razaqzada, market analyst with FOREX.com
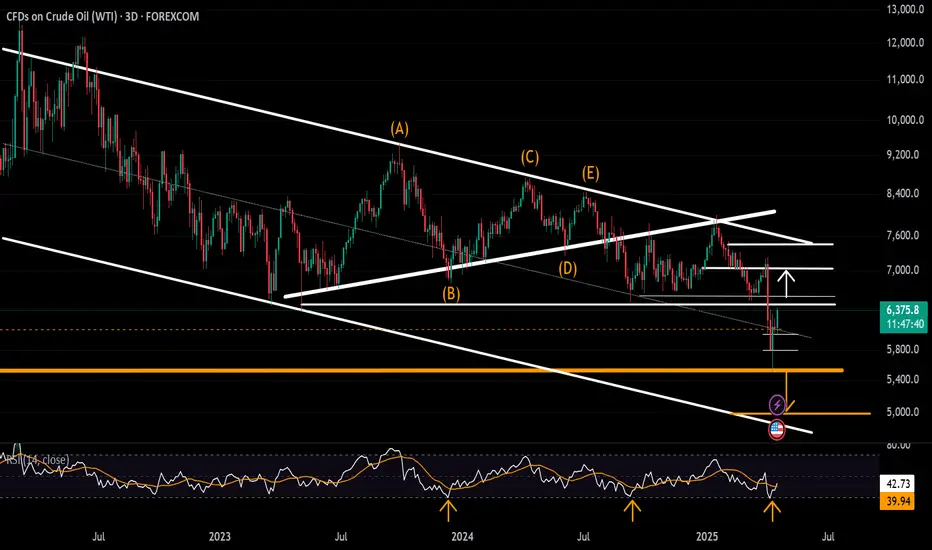
Analysis of the BRENT chart with expectations for 2025-2026◽️Technically, all conditions for the completion of the second wave correction have been met, and now quotes can be safely reversed up. However, current events in the global economy do not yet provide grounds for confidently asserting this. Locally, the price may still be driven down to $50 per barrel and even slightly lower. One way or another, it is important to understand a simple thing: everything below $70 per barrel should be seen as an opportunity to buy oil and everything related to it cheaply.
◽️According to my estimates, there is probably still time for deliberation on purchases until the end of spring. But further, from the beginning of summer, I expect a sharp rise in prices amid the escalation in the Middle East. From above, in the $100-150 range, growth will likely be contained for some time, which will be interpreted as the formation of sub-waves (i)-(ii), where after sharp rise in the first sub-wave from approximately $50-60 to $120-130, a local correction will follow within the second sub-wave.
◽️The growth period may take 3-6 months, and the correction to it another 2-4 quarters, and then a breakout of the $120-150 resistance zone and further "to the moon" in the third waves is expected.
🙏 Thank you for your attention and 🚀 for the idea.
☘️ Good luck, take care!
📟 See you later.

#BRENT Gold/Oil Ratio, Stocks/Oil RatioOn chart I tried to fit three instruments at once:
1️⃣ Bottom (white) chart: Gold to Oil Ratio.
2️⃣ Middle (red) chart: BRENT crude oil price.
3️⃣ Top (blue) chart: Dow Jones Industrial Average to Oil Price Ratio.
1️⃣ The first thing to pay attention to is the white chart: GOLD/OIL Ratio , specifically where this ratio is today. Over the last 75 years of observation, the ratio has reached unprecedented levels. The spread is once again testing the record values of the COVID-19 hysteria of 2020, when panic caused oil prices to plummet sharply. At the current moment, the ⚖️Gold to Oil Ratio is around the 50 mark, meaning that one ounce of gold can buy as much as 50 barrels of oil. Over the last century, when the spread exceeded 25 barrels per ounce, it was interpreted as a moment of cheap oil relative to gold. Today, against the backdrop of the chaos reigning in the world, the GOLD/OIL Ratio is entering what can be called the " MAGA Mega Cheap Oil Zone" if it is again valued in gold, and not in fiat green piece of paper. Further, we should expect at least a return to its average values, and here three scenarios are possible:
1. First Scenario. Let's assume that today's price of $60-70 per barrel of oil is "fair" and this is where it belongs. In this case, gold is currently strongly overvalued, and it's time for a correction from $3300 to the $2500-2800 range.
2. Second Scenario. Everything is fine with gold, and it will continue to rise without correction. In this case, oil is severely undervalued relative to gold, and it's time for it to catch up so that the spread of 50 returns to its average values in the 10-25 range.
3. Third Scenario suggests that both oil is significantly undervalued and gold has risen too sharply, and now it's time for a correction in gold and a rise in oil prices.
In any of the three scenarios described above, the GOLD/OIL Ratio will sooner or later return to its normal values of the last century, that is, to the range of 10-25 barrels per ounce of gold. And most likely, we will see the third scenario unfold this year, where against the backdrop of a stock market crash, problems with liquidity in the global financial system, the entry of Western economies into recession, as well as the start of a full-scale war in the Middle East this summer, all of this together will provoke a correction in gold and an explosive growth in oil prices, and consequently, a return of the gold to oil ratio to its historical averages.
2️⃣ On the second (red) linear chart of BRENT crude oil prices , everything looks quite ordinary. If we briefly describe the chart for the last twenty years in simple terms, it's worth saying the following: since 2008, they have been trying in every possible way to keep the oil price below $130 per barrel, and as soon as the price approaches the $120-150 zone, some "invisible hand of the market" throws it down. The first test of this resistance zone occurred during the GFC global financial crisis of 2008, the second test with prolonged trading took place during the Eurozone debt crisis of 2011-2014 (culminating in the Greek default), and the third test was in 2022, as a consequence of the monetary madness of 2020 (global lockdown, unlimited QE, and as a result: a wave of monetary + structural inflation worldwide). One way or another, from the fourth or fifth time, the $120-150 per barrel boundary will be finally broken. And then the price above, like a samurai, "has no destination, only the path," and this path is upwards, "to the moon"🚀
3️⃣ Now it remains to consider the last (blue) chart at the top, the ⚖️Dow Jones Industrial Average to Oil Price Ratio . This chart should be understood as a long-term trend indicator of cycle changes in financial markets. When it rises, it implies a 10 or even 20-year growth cycle in the stock market, and accordingly, corrections in the commodity market. And when it falls, then vice versa, the cycle changes to growth in the commodities market and a correction in the risky stock market, which also lasts one or even two decades. Today, it can be said with certainty that since 2020, the cyclicality has changed, and we are just entering a ten or even twenty-year growth trend in the commodity sector, which portends a change from the "eternally" growing trend in the American stock market to a fall or at least a multi-year sideways movement a la the 1970s.
🙏 Thank you for your attention and 🚀 for the idea.
☘️ Good luck, take care!
📟 See you later.

Today analysis for Nasdaq, Oil, and GoldNasdaq
The Nasdaq closed higher on the daily chart. It held above 18,360 at the close, and today’s candle formed a golden cross as the MACD crossed above the Signal line, creating a potential buy signal. However, this signal will only be confirmed if the candle closes as a solid bullish bar, so it's too early to say that a buy confirmation has been established.
On the weekly chart, although the index has not yet reclaimed the 5-week MA, it has gapped above it. Overall, the index appears to be forming a box range between the 3-week and 10-week MAs, and if further upside occurs, we could potentially see a move toward the 60-week MA. However, since the MACD and Signal line on the weekly chart are still sloping downward, there's a high possibility of a medium-term pullback even if the index rallies to the 10-week MA.
On the daily chart, the index is still meeting resistance at the 20-day MA, and the key point now is whether the MACD completes the golden cross or turns downward again. Since the index has managed to hold above 18,360, the potential for a rebound remains open. Buying during pullbacks near the lower wick remains a favorable strategy.
On the 240-minute chart, the MACD is turning upward after finding support at the Signal line, forming a potential third wave of buying. In short-term timeframes, buying on dips remains favorable.
This week, the Retail Sales data is scheduled for Wednesday, and the U.S. markets will be closed on Friday. Please keep that in mind for risk management.
Crude Oil
Crude oil closed higher in a narrow range on the daily chart. On the weekly chart, a long lower wick formed, finishing with a doji candle, suggesting indecision. Last week, oil was rejected at the 3-week MA, forming an upper wick. If it rallies this week, it could target the 5-week MA. The $65 level, near both the 5-week and 240-week MAs, remains a strong resistance zone, making it a potentially favorable area to consider short trades.
On the daily chart, oil has entered a box range between the 5-day and 10-day MAs. Though the MACD and Signal line still point downward, oil is currently holding within a supportive range. There is a possibility the MACD could begin to turn upward, so keeping both bullish and bearish scenarios open is advisable.
On the 240-minute chart, the MACD is still rising after a golden cross but remains below the zero line, suggesting a potential for another pullback. Overall, monitor intraday movements and continue to trade within the range.
Gold
Gold closed higher, setting a new all-time high. The weekly chart formed a strong bullish candle, resuming its upward trend. Buying near the 3-week MA remains favorable. As the price has overshot the previous target of $3,216, we’ve now entered an overshooting zone, making it difficult to define the next resistance. Therefore, caution is advised for short positions, and it’s best to focus on buying the dips.
On the daily chart, the new all-time high generated a bullish signal, and buying near the 3-day MA is recommended. Gold may enter a sideways consolidation phase while aligning its moving averages. In that case, buying near the 5-day MA may also be considered, but avoid chasing the price higher.
The MACD has made another golden cross, and it’s important that the MACD doesn’t create a divergence by failing to surpass its previous peak. Avoid shorts, and stick with buy-the-dip strategies. On the 240-minute chart, buying momentum remains strong. The RSI is in overbought territory, so again, avoid shorting and focus only on buying during pullbacks.
Market Outlook
Compared to the last two weeks of high volatility, this week is expected to be more subdued. After a period of extreme moves, the market is likely to consolidate and seek direction. Rather than swinging for home runs, it's better to focus on small base hits and steadily build profits.
Wishing you a successful trading week!
If you like my analysis, please follow me and give it a boost!
For additional strategies for today, check out my profile. Thank you!

I've Cracked the BULLISH Code in Crude Oil Using COTCrude oil is setup for longs based on fundamental conditions underlying the market place.

Crude Oil Found Support: What's Next?FenzoFx—Crude oil tested the $58.9 level as support and bounced back from it. The primary trend is bearish; therefore, it will likely resume if the price closes and stabilizes below this support.
If this scenario unfolds, the next bearish target could be the $55.15 support level.
>>> Win $160.0 prize every week by joining FenzoFx contest.

Today analysis for Nasdaq, Oil, and GoldNasdaq
The Nasdaq closed lower following news of additional tariffs on China. On the daily chart, the index failed to break above the 20-day moving average and pulled back to the 5-day MA, continuing its box-range movement. Since the 5-day MA is still acting as support, the current trend can still be seen as a sideways consolidation, with 18,500 acting as a central pivot level.
The MACD on the daily chart has not yet clearly broken above the Signal line, so it remains uncertain whether it will make a golden cross with additional upward momentum, or turn downward again. Thus, it’s best to adopt a neutral range-bound trading strategy, keeping strict stop-losses on both sides.
On the 240-minute chart, both the MACD and Signal line have moved above the zero line, entering a key area to observe whether the third wave of MACD upside begins after this box-range consolidation. Since the current price is correcting after a rebound from a double bottom, and is maintaining the center of the prior bullish candle, buying remains more favorable. Unless the previous day’s low is broken, it’s better to stay buy-biased.
Please note that today's PPI data release is scheduled, which may lead to increased volatility around the announcement time.
Crude Oil
Crude oil closed lower with a large bearish candle. On the daily chart, it failed to hold the 5-day and 10-day moving averages, breaking below the 5-day MA. The MACD continues its downward slope, and unless oil clearly reclaims the 10-day MA, the market will remain bear-biased.
There is resistance now at the 3-day and 5-day MAs, so it’s important to see whether further downside unfolds. As previously noted, the $59 level is a key support zone — watch closely for any breakdowns.
On the 240-minute chart, the MACD is trending up and pulling the Signal line along, but both remain below the zero line. If oil continues in a box range but the MACD turns downward again and forms a dead cross, there could be another leg lower. For now, continue to focus on buying near the $59 level, and maintain a range-trading approach until further confirmation.
Gold
Gold closed higher with another strong rally. On the daily chart, the MACD has now crossed above the Signal line, generating a buy signal. However, this signal will only be valid if today’s candle closes as a bullish bar, so watching the daily close is critical.
Gold hit new all-time highs during the pre-market session, with the long-awaited 3,216 level, which has been the target since March, now within reach. Beyond this level, we enter the overshooting zone, where it’s difficult to define a precise top. Therefore, it's best to stick to dip-buying strategies, as safe-haven demand continues to surge.
Even though the MACD has crossed bullishly, divergence may form if the current MACD fails to exceed the previous peak. Avoid chasing long positions at the top; instead, look for entries during pullbacks.
On the 240-minute chart, the MACD has climbed above the zero line, showing a strong one-way bullish trend. RSI across intraday charts is now in overbought territory, so it’s best to avoid short positions entirely for today.
Market Sentiment & VIX
Looking at the VIX index, the daily candle has once again broken above the 5-day MA, indicating that volatility could expand further at any time. With Trump’s remarks shaking markets, it’s impossible to predict what new developments might emerge over the weekend.
Avoid holding overnight positions due to heightened headline risk, and make sure to wrap up this trading week with solid risk management.
Wishing you a profitable trading day!
If you like my analysis, please follow me and give it a boost!
For additional strategies for today, check out my profile. Thank you!

What Happens to Global Markets When the Ukraine-Russia War Ends?What Happens to Global Markets When the Ukraine-Russia War Ends?
The end of the Ukraine-Russia war will undoubtedly impact major global markets,
here’s what we can expect:
Oil Market : With tensions easing, oil prices could drop as supply concerns lessen and sanctions ease. However, global demand could still keep prices stable or even high.
Gold Market : Gold, a safe-haven asset, might face a decrease in demand as geopolitical uncertainty fades, but if the end of the war leads to global economic instability, gold could remain a strong choice for investors.
Forex Market : The end of the conflict could boost the Euro and USD as stability returns to the market. At the same time, the Russian Ruble might face fluctuations as Russia’s economy adjusts to post-war conditions.
Crypto Market : Cryptocurrencies may see mixed reactions—some may retreat as confidence in traditional markets rises, but others could flow in if economic uncertainty continues to prevail globally.
🔮 The war's end could bring hope, but it also presents new challenges for markets worldwide. Stay tuned to see how it all plays out!

Today analysis for Nasdaq, Oil, and GoldNasdaq
The Nasdaq closed with a sharp surge following news of a possible delay in Trump’s tariff implementation. A 12% single-day rally on the daily chart is unprecedented — it was an extraordinary rise. On the daily chart, the 20-day moving average is acting as resistance, and to fully fill the April 3rd gap-down, the index would need to rise to around 19,750. If the Nasdaq continues to climb and fills that gap, a potential pullback should be anticipated.
Although the MACD has turned sharply upward in a V-shape, it hasn't fully broken above the Signal line yet. Given the rapidly changing global conditions, the possibility of a reversal still exists. However, since the 90-day tariff delay has been confirmed, the market may be entering a phase of relative stability. On the weekly chart, we see a sharp rebound that has brought the index up to the 5-week moving average. Both the Nasdaq and the VIX suggest that today could be a range-bound (sideways) session, so it's better to set wider trading ranges and adopt a box-range trading strategy.
On the 240-minute chart, a double bottom pattern has formed, with the MACD bouncing off the Signal line and rising again. The MACD is trending upward, but the Signal line remains below the zero line, which means a short-term pullback could still occur. Overall, it is advisable to use a buy-low, sell-high approach, with more upside potential still open. Also, today’s CPI report is scheduled, so please be mindful of increased volatility around the data release.
Crude Oil
Crude oil rebounded sharply from the $55 level, showing an impressive 12% range between high and low. However, the sell signal remains active. The price has broken above the 5-day moving average and entered a box range between the 5- and 10-day MAs, suggesting that a moving average-based box strategy would be effective.
On the weekly chart, oil has not yet reached the 5-week MA, so there’s still room up to the $65 level, which has historically served as strong resistance. Around that area, it might be more effective to consider short positions. On the 240-minute chart, the MACD showed signs of a third wave down, but failed to make a new low — signaling bullish divergence. A head-and-shoulders inverse pattern may be forming, with the right shoulder potentially developing around the $59–$60 zone. Overall, the strategy should remain range-based, with some more room to the upside.
Gold
Gold also closed sharply higher, benefiting from the tariff delay news. On the daily chart, the price closed higher, giving the illusion of a support bounce off the lower Bollinger Band, as that band is rising. The MACD remains above the zero line, so there’s still room for a retest of the Signal line, but given the current gap between MACD and Signal, the price needs to either rise further or move sideways to bring the MACD closer and potentially break above the Signal line.
If it fails to rise from here, the MACD may turn down again, so avoid chasing the price upward. Like Nasdaq and oil, gold is heavily influenced by global developments, so stay updated on the geopolitical landscape. On the 240-minute chart, gold formed a triple bottom around the 2,980 level and then rebounded strongly. The MACD is trending upward and pulling the Signal line along with it, but resistance around the 3,130 level remains significant. Gold may see increased volatility from today’s CPI report and tomorrow’s PPI release, so stay alert.
Market Summary
The market has been showing signs of irrational behavior. Investor sentiment is extremely volatile and driven more by emotion than logic. In times like this, it’s more important than ever to stick to the basics, shorten trade duration, cut back on risk, and trade with discipline. The more you chase after gains, the more likely your trades will be swept away by market turbulence.
Warren Buffett is considered a legend in the financial markets precisely because he has always stuck to fundamental principles. Likewise, it is crucial to establish and stick to your own trading principles to survive in the markets. If you haven’t yet experienced the kind of volatility we saw during the Trump era or the pandemic, this is a time to be especially cautious and defensive in your approach.
Wishing you another day of successful trading
If you like my analysis, please follow me and give it a boost!
For additional strategies for today, check out my profile. Thank you!

The quinquennial Bear Trap: Oil’s Next Leg DownIn this video I cover the potential for oil to trade down into the 55 $ range and what confluences we have at this price region .
Please support with a boost and I welcome any questions
