ITS A T15 min TRADE FOR USOIL
1. Got Activated @ 69.64
2. Stop loss @ 69.77 and resp. Target @68.40
3. Its a swing trade for 2 Days trade working days duration.
4. Kindly make your orders accordingly to the duration period mentioned.
God bless. Happy trading Days
Crudeoil!

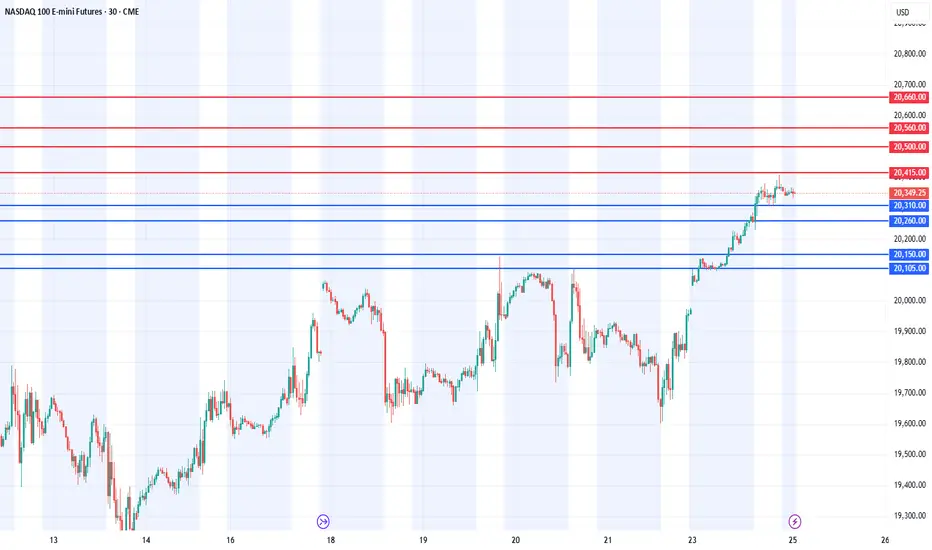
Today analysis for Nasdaq, Oil, and GoldNasdaq
The Nasdaq closed lower, facing resistance at the 240-day moving average on the daily chart. With a significant gap between the price and the 5-day moving average, a pullback toward the 5-day MA was anticipated. The index did find support at the 5-day MA, closing with a lower wick. The key question now is whether the current correction wave will fill the gap created on Monday, as it faced resistance at the 240-day line. If you’re looking to buy on dips, it’s best to focus on the gap area as a potential support zone. The MACD remains in a golden cross, and with a noticeable spread from the signal line, the market is likely to stay range-bound unless a bearish crossover occurs.
On the 240-minute chart, a bearish crossover (death cross) has formed, suggesting the potential for further downside. However, the price is approaching a strong support zone where buying interest previously emerged. Thus, buying on dips in lower zones may be favorable. In the short term, both the MACD and the signal line remain above the zero line, indicating a possible short-term rebound. Be cautious with chasing short positions and monitor lower time frames.
Also, don’t forget: Today’s GDP release may influence market direction.
Crude Oil
Oil closed higher, reaching $70 on the daily chart. Since the $70–71 range is a major resistance zone, it’s likely the trend may consolidate in this area. The daily MACD is rising sharply, and buying pressure appears strong and one-sided. Despite the resistance at $70–71, if oil gaps up over the weekend, there’s a chance this resistance could be broken by a gap-up move on Monday. Keep an open mind to this possibility, but also be cautious over the weekend (over-the-weekend risk).
On the 240-minute chart, the MACD is bouncing off the signal line, with strong renewed buying pressure. However, if oil fails to break higher, a MACD divergence could develop, so avoid chasing longs at elevated levels. Overall, it’s safer to treat the $71 level as the upper boundary of a range, favoring short-term selling strategies. Watch the lower timeframes for signs of trend reversal.
Gold
Gold ended the day flat within a narrow range, forming a small consolidation box ahead of today’s GDP release and tomorrow’s PCE data. The daily MACD is converging with the signal line, suggesting we are approaching a turning point — either a new leg up or a bearish crossover. Both bullish and bearish scenarios remain open, so it’s important to monitor how the market reacts to upcoming data. If gold fails to push higher, a bearish divergence may form, opening the door to a pullback toward the 5-week MA on the weekly chart.
On the 240-minute chart, both MACD and the signal line are hovering near the zero line, indicating sideways movement. Since the signal line remains above zero, the buy side still holds a slight edge, but confirmation via a strong bullish or bearish candle is needed to establish a trend. Any MACD signal triggered at the zero line could lead to a larger directional move, so keep that in mind. Until data is released, continue range-bound trading, and avoid premature long or short positions, as today’s trend may remain undecided.
March is coming to an end. Make sure to keep a close eye on today and tomorrow's data releases and aim to close the month with solid results.
Wishing you a successful trading day!
If you like my analysis, please follow me and give it a boost!
For additional strategies for today, check out my profile. Thank you!

USOIL - NEW BREAKOUTHello Traders !
The USOIL price broke the resistance level (68.427 - 68.703).
This key level becomes new support !
So, I expect a bullish move🚀
_______________
TARGET: 70.080🎯

WTI Crude Oil Trade Plan: DOE Release NYMEX:CL1!
In this tradingview blog, we go over our technical setup and trade idea for Crude oil.
It is important to note we also have DOE inventory numbers coming at 10:30 ET.
Once the release has settled in, the trade idea can be framed using either of our two scenarios.
Scenario 1: Liquidity Trap
Rejection above March Monthly Open or Yearly Open and prices mean revert towards March mcVAH and CVPOC confluence. The idea considers the trend from last Wednesday. Late breakout buyers get trapped. Higher time frame participants push prices lower.
An example swing trade idea would be taking a long position once the release has settled and waiting for a pull back around 69.50.
• Entry: 69.50
• Stop: 70.30
• Target: 68.15
• Risk: 80 ticks
• Reward: 135 ticks
• Risk/Reward ratio: 1.69
This is an example swing trade idea that may play out by the end of the week.
Scenario 2: Shift back into 70 - 75 range distribution.
Immediate resistance is at March monthly open and yearly open. Above it the path clears towards Q1 mid-range and 2025 mCVPOC.
An example of a trade idea for this scenario is to wait for a breakout and close of candle on the 30 minutes time frame above yearly open. Wait for a pullback towards 70.28
• Entry: 70.35
• Stop: 69.50
• Target 71.45
• Risk: 85 ticks
• Reward: 110 ticks
• Risk/Reward ratio: 1.29
Please note that these are example trade ideas. Trades are advised to do their own preparation. Stops are not guaranteed to trigger, and losses may be greater than predetermined stops.

USOIL SHORT FROM RESISTANCE|
✅CRUDE OIL has hit a TP
Of our last free signal and
Went further up just as we
Predicted but will soon hit
A horizontal resistance level
Of 70.57$ from where we will
Be expecting a local bearish
Correction and a move down
SHORT🔥
✅Like and subscribe to never miss a new idea!✅
Disclosure: I am part of Trade Nation's Influencer program and receive a monthly fee for using their TradingView charts in my analysis.

CFD on WTI CRUDEOIL (US OIL)ITS A T4HR TRADE FOR USOIL
1. Got Activated.
2. Stop loss @ 69.65 and resp. Target 1 @ 69.65 and Target 2 @ 67.59
3. Its a swing trade for 1 week trade working days duration.
4. Kindly make your orders accordingly to the duration period mentioned.
God bless. Happy trading Days

USOIL - at resistance ? What's next ??#USOIL.. market just reached at his resistance area.
Keep close it and if market thold it in that case we can see again drop from here.
Don't be lazy here..
Good luck
Trade wisely

CRUDE OIL LONG SIGNAL|
✅USOIL made a retest
Of the horizontal support
Of 68.60$ so we are bullish
Biased so we can enter a
Long trade with the TP of 69.46$
And the SL of 68.17$
LONG🚀
✅Like and subscribe to never miss a new idea!✅
Disclosure: I am part of Trade Nation's Influencer program and receive a monthly fee for using their TradingView charts in my analysis.

WTI rises to test major resistance WTI has risen in the last couple of weeks after staging an oversold bounce from around the key $65.00 long-term support level at the start of the month. However, it is now testing a key resistance area between $69.15 - $70.00 range, which is where WTI last sold off from. It is a pivotal zone. Given the underlying long-term bearish trend, I am more inclined to look for bearish setups to form here, than to chase this move higher. However, that being said, I would have to drop my short-term bearish bias in the event WTI were to break decisively above $70.00 level in the days ahead.
By Fawad Razaqzada, market analyst with FOREX.com

CRUDE OIL(WTI): Bullish Continuation Confirmed
One of the setups that we discussed on a today's live stream
was a bullish flag pattern on WTI Crude Oil on an hourly chart.
Its resistance breakout provides a strong bullish confirmation.
We can expect growth at least to 70 level.
❤️Please, support my work with like, thank you!❤️

Technical Analysis for WTI Crude Oil (Daily Chart)Current Price Action
WTI crude oil is trading at $70.51, showing a recovery from the Liquidity Pool zone near the $66.00–$67.00 range. The price has approached a key resistance level around $71.00, which aligns with a previous area of rejection in February 2025. The chart suggests a potential pullback from this resistance level, as indicated by the projected downward arrow.
Support Levels:
$66.00–$67.00: This zone represents a significant liquidity pool where buyers have consistently stepped in, leading to a reversal in price.
$65.00: A psychological support level and the lower boundary of the liquidity pool.
Resistance Levels:
$71.00: A critical resistance level that has acted as a ceiling for price action in recent months.
$73.00: The next major resistance level if the price breaks above $71.00.
Volume Profile Analysis
The Volume Profile on the right side of the chart shows significant trading activity between $70.00 and $71.00, indicating strong resistance in this area. Above $71.00, the volume thins out, suggesting that a breakout could lead to a rapid move toward $73.00.
Indicators and Momentum
Trend: The price is recovering from a bearish trend but remains below the highs of $80.00 seen earlier in the chart. The current move appears to be a retracement within a broader downtrend.
Potential Pullback: The projected arrow on the chart suggests a possible rejection at $71.00, with a pullback toward the $68.00–$69.00 range.
Market Sentiment
The chart reflects cautious optimism, with buyers stepping in at lower levels but facing strong resistance at $71.00. A breakout above this level could signal a shift in sentiment, while a rejection would confirm the continuation of the bearish trend.
Conclusion
WTI crude oil is at a critical juncture, testing the $71.00 resistance level. Traders should watch for a breakout above $71.00, which could target $73.00 and higher. Conversely, a rejection at this level may lead to a pullback toward the $68.00–$67.00 support zone. The liquidity pool near $66.00 remains a key area for buyers to defend in the event of further downside.

CRUDE OIL Will Go Up After Pullback! Buy!
Hello,Traders!
CRUDE OIL is trading in a
Local uptrend and the price
Made a strong bullish breakout
Of the key horizontal level
Of 68.40$ so after a pullback
And a retest of the new support
We will be expecting a further
Bullish move up
Buy!
Comment and subscribe to help us grow!
Check out other forecasts below too!
Disclosure: I am part of Trade Nation's Influencer program and receive a monthly fee for using their TradingView charts in my analysis.

Today analysis for Nasdaq, Oil, and GoldNasdaq
The Nasdaq closed higher, forming a gap up on the daily chart. It showed a strong, one-directional rebound up to the 5-week moving average on the weekly chart.
Since the 5-week MA overlaps with the 60-week MA, it's unlikely to break through easily without a short-term correction.
On the daily chart, the MACD has formed a golden cross, meaning that even if a pullback occurs, the strategy should remain buy-on-dip oriented.
There is still an open gap down to 19,960, which could be filled at any time—so it's important to consider the possibility of a retest of that level. If the gap is filled, that area could be a good support zone to buy from.
On the 240-minute chart, strong buying momentum entered around the zero line, confirming a breakout after basing in a range. Therefore, buying on pullbacks remains the preferred approach in this structure.
Crude Oil
Crude oil continued its upward move, closing higher on the daily chart.
With strong support around the $68 level, the market could potentially rise toward the $70 zone, and possibly test resistance between $70–$71, which is a key area to watch closely.
Overall, traders should continue to buy on dips, but be cautious with chasing long positions above $70. If taking short positions, they should be managed with tight stop-losses.
On the 240-minute chart, oil appears to be in the midst of a third wave rally, so any short positions should be considered above $70, while buying pullbacks remains valid.
Current Middle East tensions and U.S. sanctions on Venezuelan oil are contributing to a supply risk premium in oil prices.
Since the market is recovering from the lows and showing a positive technical setup, short trades should be managed carefully with proper risk control.
Gold
Gold closed lower, remaining within its range-bound structure. On the daily chart, gold is currently trading between the 3-day and 5-day MAs above, and the 10-day MA below, forming a narrow consolidation zone. This makes sell-at-highs and buy-at-lows strategies effective.
Since there's room for a pullback to the 5-week MA on the weekly chart, chasing longs is not advised. If the MACD crosses below the signal line, this could create a bearish divergence, leading to potential sharp downside, so caution is warranted.
On the 240-minute chart, the MACD is failing to break above the signal line and continues to decline. However, since the signal line remains above the zero line, a rebound attempt is likely, even if the MACD dips below zero.
Given the current slope and distance, it's unlikely that a golden cross will form soon. Also, traders should keep in mind that major economic data such as GDP and PCE reports are scheduled later this week, which could influence market direction.
If you can understand the daily chart structure, you can better anticipate intraday high/low ranges and potential wave patterns. Make it a habit to perform thorough daily chart analysis each day, and prepare a trading scenario that suits the market’s behavior. As always, questions are welcome.
Wishing you a successful trading day!
If you like my analysis, please follow me and give it a boost!
For additional strategies for today, check out my profile. Thank you!
USOIL To Retest $70.5I'm watching TVC:USOIL for a strong push towards at least the $70.5 level, though this area presents significant resistance.
A confirmed break of the bearish trend could fuel strong buying momentum, but patience is key.
Ideally, I’d like to see a solid rejection off the $68.5 level as confirmation before a move higher.
If we get a decisive breakout above $70.5 with sustained bullish momentum, my next target would be the major resistance around $75.

Buy idea on Crude Oil (CL1!)Based on
- Cyclical analysis and quantitative data
- Undervalued Conditions
- Commercials hedging higher

Market Analysis: WTI Crude Oil Face HurdlesMarket Analysis: WTI Crude Oil Face Hurdles
Crude oil is attempting a recovery wave but upsides could be limited.
Important Takeaways for WTI Crude Oil Price Analysis Today
- WTI Crude oil prices started a recovery wave from the $66.00 support zone.
- There is a key bullish trend line forming with support at $67.50 on the hourly chart of XTI/USD at FXOpen.
WTI Crude Oil Price Technical Analysis
On the hourly chart of WTI Crude Oil at FXOpen, the price remained in a bearish zone below the $70.00 level against the US Dollar. The price started a fresh decline below the $68.00 support.
The price even dipped below the $67.50 level and the 50-hour simple moving average. Finally, the bulls appeared near $66.00 and the price started a recovery wave. The price recovered above $67.50 and tested the $68.50 zone.
The price is now consolidating gains below the 23.6% Fib retracement level of the upward move from the $66.54 swing low to the $68.48 high. There is also a key bullish trend line forming with support at $67.50.
If there is a fresh increase, it could face resistance near the $68.30 level. The first major resistance is near the $68.50 level. Any more gains might send the price toward the $69.20 level.
The main resistance could be near the $70.00 level. Conversely, the price might continue to move down and revisit the $67.50 support and the 50% Fib retracement level of the upward move from the $66.54 swing low to the $68.48 high. The next major support on the WTI crude oil chart is $67.00.
If there is a downside break, the price might decline toward $66.55. Any more losses may perhaps open the doors for a move toward the $66.10 support zone.
This article represents the opinion of the Companies operating under the FXOpen brand only. It is not to be construed as an offer, solicitation, or recommendation with respect to products and services provided by the Companies operating under the FXOpen brand, nor is it to be considered financial advice.

Crude oil is coiling on a Friday. What could possibly go wrong?Intraday Update: Another strong rejection of the 68.50 level. Since it is the end of the week, the risk is building for a big move either back to the 65.20 support or perhaps a break of the key 68.50 level.

MCX Crudeoil intraday analysis for March 21, 2025According to my technical analysis, MCX Crudeoil is showing a bullish trend during intraday on March 21, 2025. Trade with Stop-Loss.

CRUDE OIL Free Signal! Sell!
Hello,Traders!
CRUDE OIL made a sharp
And sudden move up
And it seems that it will
Soon hit a horizontal
Resistance level of 68.80$
From where we can go short
On Oil with the TP of 67.67$
And the SL of 68.87$
Sell!
Comment and subscribe to help us grow!
Check out other forecasts below too!
Disclosure: I am part of Trade Nation's Influencer program and receive a monthly fee for using their TradingView charts in my analysis.

USOIL.. Near resistance? hold or not??#USOIL.. market just near to his current resistance area that is around 67.52-55
keep close that area and if market hold it in that case we can expect a drop from here.
keep close and stay sharp..
good luck
trade wisely

#CRUDEOIL SUPPLY ZONE A supply zone at 5923 indicates a potential area of selling pressure, where price may reverse or stall. Traders can consider shorting on price rejection at this zone, with a stop loss above 5923 (e.g., 5950) and a target at the next support level (e.g., 5750).

USOIL BREAKOUT FROM THE WEDGE|SHORT|
✅CRUDE OIL is trading in a
Downtrend and the price broke
Out of the bearish wedge pattern
And the breakout is confirmed
Because the 4H candle closed
Way below the wedge's support
So we are bearish biased and
We will be expecting a
Further bearish move down
SHORT🔥
✅Like and subscribe to never miss a new idea!✅
Disclosure: I am part of Trade Nation's Influencer program and receive a monthly fee for using their TradingView charts in my analysis.

Crude oil turns lower on Putin-Trump callBoth oil contracts are now lower on the day, giving up earlier gains. From the day's high, WTI is now 2.8% lower and counting as prices test the day's lows. Oil prices moved lower on hints/hopes of peace from the just-finished Trump & Putin talks. The rationale here is that any peace progress would increase the chances of removing sanctions on Russian oil shipments, increasing global supplies.
WTI has held the trend resistance and old support-now-resistance at $68.45. The inverted daily hammer candle, if completed, would point to more weakness in the days ahead. As such, we could see prices dip down to test waters below recent lows of just north of $65.00 handle - a level last tested back in September 2024. A potential break below that could pave the way for a test of the May 2023 low of $63.60.
By Fawad Razaqzada, market analyst with FOREX.com
