USOIL Local Short! Sell!
Hello,Traders!
USOIL made a rebound
From the long-term rising
Support but has now reached
A horizontal resistance level
Of 70.80$ from where we
Will be expecting a local
Bearish correction
Sell!
Comment and subscribe to help us grow!
Check out other forecasts below too!
Crudeoil!

BRENT weaker after inventories and tariffs expectationsThe BRENT Crude (Brent Crude) price action sentiment appears bearish, supported by the longer-term prevailing downtrend.
The key trading level is at 7444, 13th and 24th February swing low level. An oversold rally from the current levels and a bearish rejection from the 7444 level could target the downside support at 7245 followed by 7134 and 7050levels over the longer timeframe.
Alternatively, a confirmed breakout above 7444 resistance and a daily close above that level would negate the bearish outlook opening the way for further rallies higher and a retest of 7530 resistance followed by 7640 levels.
This communication is for informational purposes only and should not be viewed as any form of recommendation as to a particular course of action or as investment advice. It is not intended as an offer or solicitation for the purchase or sale of any financial instrument or as an official confirmation of any transaction. Opinions, estimates and assumptions expressed herein are made as of the date of this communication and are subject to change without notice. This communication has been prepared based upon information, including market prices, data and other information, believed to be reliable; however, Trade Nation does not warrant its completeness or accuracy. All market prices and market data contained in or attached to this communication are indicative and subject to change without notice.

CRUDE OIL (WTI): Waiting For a Signal to Buy
WTI Crude Oil is stuck on a major rising trend line on a daily.
To buy the market with a confirmation, I am waiting for a bullish
breakout of an intraday 4H resistance.
4H candle close above 69.3 will be a strong bullish signal.
A bullish continuation will be expected at least to 69.9 level then.
❤️Please, support my work with like, thank you!❤️

EURUSD FOR SCALPERS AND DAY TRADERS **2000 POINTS **Entry price ,stoploss and Target already marked in the chart itself FYI.
Guys pls like, share and follow my ideas .
Thank You All

WTI Crude Oil CL Futures Weekly Plan AnalysisNYMEX:CL1!
In this tradingview blog, we will refer to our February 18, 2025 weekly trade plan for NYMEX WTI CL futures . Last week, we outlined two potential scenarios, with our primary scenario playing out—though not exactly as expected. Prices reversed lower more sharply than anticipated, offering minimal pullbacks on the 4-hour timeframe. However, when analyzing the hourly chart, our plan aligned well, as prices ultimately reverted to key LIS/yearly open bull support, which also confluences with the 2025 VAL.
We highlighted the following key levels:
2025 mcVPOC: 72.82
Feb 2025 mcVAH: 72.48
2025 mcVAL: 70.56
Yearly Open/ LIS: 70.52
Key Bull Support/ Confluence Zone: 70.52 - 70.12
Scenario 1 stated “Range bound week ahead.” We noted the following:
“In this scenario we expect range bound price action contained within Feb 2025 micro composite Value Area.”
Consistency is key in everything we do. We are creatures of habit. Energy flows where attention goes.
We provide these weekly plans to traders and the wider public to showcase that, instead of strategy hopping, a trader can achieve consistency by sticking to one approach. If that approach is not working, perhaps it is time to go back to the drawing board. Whether that be backtesting, walk-forward optimization or incorporating key market statistics that you have gathered and observed.
The goal of these weekly plans is to provide you with a structured roadmap that you can adapt to your own trading style. In our experience, while there are many ways to approach the market—whether through different indicators or methods for drawing levels and plans—staying consistent in your approach often leads to identifying similar key levels. Volume, price and time leave behind footprints. Although they do not provide a certain future, they can help you stay grounded, accepting the random nature of the markets, thinking in terms of probabilities and perhaps learning more so you can also gain similar insights.
As Bruce Lee said, “I do not fear a man who practiced different kicks a thousand times. I would fear a man who practiced the same kick a thousand times.”

CL Short Termin Potential LongHey Crudsters, it's time to prep for a long.
Price reached the Center-Line and has a good chance for a push to the north.
Watchout and be prepped.

Go long crude oilDear Traders,
Currently, crude oil continues its downward trend, though the pace of its decline has moderated, showing signs of bottoming out. Moreover, oil has now pulled back to the critical support zone around the 68 level. Should oil fail to decisively break below this support, a technical rebound could occur at any moment. Additionally, with oil’s relatively low valuation, it becomes increasingly attractive in the market.
For short-term trades, I favor initiating long positions on crude oil, with an initial target of a rebound toward the 69.5-70.5 zone, which seems well within reach.Bros, profits are the ultimate goal in trading. Accumulating profits is what changes lives and destinies. Choosing wisely is far more important than just working hard. If you want to replicate trade signals and earn stable profits, or if you want to deeply learn the correct trading logic and techniques, you can consider joining the channel at the bottom of this article!

Crude Oil - Centerline reached and potential turnNow, CL has reached the Centerline.
From here we either turn, or break the L-MLH, with further decline ahead.
No rush, let the market give us facts.

US Oil Market Outlook: Bearish Momentum Indicate Further DeclineThe 4-hour chart of WTI Crude Oil (TVC: USOIL) reveals a well-defined market structure transition from bullish to bearish. Initially, the price action exhibited a strong uptrend, characterized by the formation of higher highs (HH) and higher lows (HL). However, a break of structure (BOS) marked the onset of a reversal, leading to the emergence of lower highs (LH) and lower lows (LL), confirming the shift to a downtrend.
A key technical observation is the presence of a price gap near the highest point, which often signifies inefficiency in the market and the potential for price retracements in the future. Furthermore, the highlighted resistance zone around the $72.49–$73.50 range has proven to be a strong supply area, repeatedly rejecting bullish attempts to break above it. This resistance, coupled with price trading below the 50-period and 200-period moving averages, reinforces the bearish bias.
The price has now breached the $71.78 level, accelerating downward momentum. The next significant area of interest lies at the identified support level around $69.36, which serves as the primary target area. If selling pressure remains dominant, further declines may be anticipated.
Volume analysis further substantiates the bearish outlook, as recent price drops have been accompanied by increased selling activity. The combination of structural shifts, resistance validation, and moving average positioning strongly suggests that the downward trajectory is likely to persist unless the price reclaims and sustains above the resistance zone.
Don't Forget To Hit The Like Button & Share Your Thoughts In Comments.

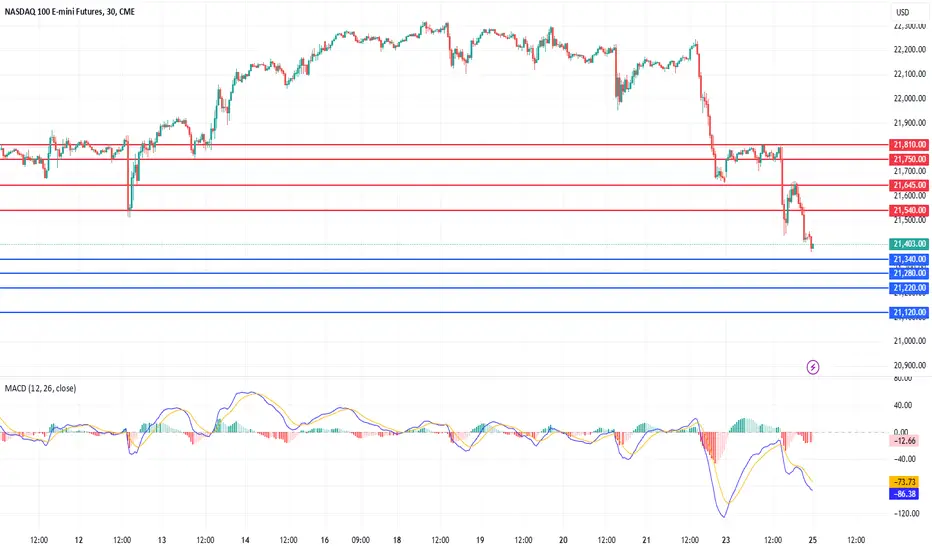
Today analysis for Nasdaq, Oil, and GoldNasdaq
The Nasdaq closed lower, continuing its selling pressure. The index quickly dropped to the lower boundary of a large range, touching the 120-day moving average. The daily MACD has formed a bearish crossover with the signal line, confirming the downtrend, and the index has now reached a potential support zone near previous lows. Yesterday provided a short opportunity at the 5-day moving average, and since there was no meaningful rebound, the gap between price and the 5-day MA has widened significantly. This suggests that a short-term technical bounce could occur based on intraday movements.
However, given the strong selling momentum on the daily chart, even if the market consolidates for a few days, further downside remains likely. If considering long positions, strict stop-loss management is essential. On the 240-minute chart, selling pressure continues to dominate, with both the MACD and signal line dropping sharply below the zero line. Comparing this to past price action near 20,763, the current MACD decline is even steeper, meaning that even if a short-term bounce occurs, the MACD is unlikely to recover back above zero easily. Overall, selling into rallies remains the preferred strategy, but traders should watch for intraday bottoming signals, as a bounce toward the 5-day MA is possible.
Crude Oil
Crude oil closed lower, weighed down by concerns over slowing consumer demand. On the daily chart, the sell signal remained intact, and the break below $70 has now confirmed a potential breakdown. Since $70 had been a key support/resistance level, the break below it suggests further downside risk. Today, a shorting opportunity may arise at the 3-day moving average, in line with technical retracement principles. However, the $66–67 range remains a strong support zone, so traders should monitor whether selling pressure is strong enough to push prices below this area. Since the MACD is turning sharply downward, and price action is forming a large bearish candle, the best strategy remains shorting into rallies near the 3-day MA.
On the 240-minute chart, a third bearish wave has developed, leading to an accelerated decline. Aside from potential buying at key support levels on the daily chart, selling into rallies remains the most favorable approach. Given that inventory data will be released today, traders should be cautious of increased volatility.
Gold
Gold closed sharply lower, forming a large bearish candle as the Consumer Confidence Index fell. Yesterday, gold was at a crossroads between a buy and sell signal, and with this bearish breakout, the sell signal is now confirmed. For now, gold is likely to trade within a broad range, as the daily MACD and signal line remain widely separated from the zero line. This suggests that while further downside is possible, periodic rebounds should also be expected.
Since gold has now fallen below the 10-day moving average and reached the 20-day MA, traders should treat the 3-day, 5-day, and 10-day MAs as key resistance levels, while the 20-day, 30-day, and 60-day MAs serve as support levels. On the 240-minute chart, the MACD has dropped below zero, with the signal line following downward. This reinforces a range-bound trading strategy, focusing on buying at major support levels while keeping in mind potential rebounds.
By analyzing the daily candles, traders can identify potential future scenarios for Nasdaq, oil, and gold. This is why daily and intraday technical analysis is essential. Additionally, NVIDIA’s earnings report will be released tonight, which could introduce further market volatility. Stay disciplined, manage risk carefully, and have a successful trading day!
If you like my analysis, please follow me and give it a boost!
For additional strategies for today, check out my profile. Thank you!

USOIL POTENTIAL LONG|
✅USOIL is about to retest a key structure level of 68.50$
Which implies a high likelihood of a move up
As some market participants will be taking profit from short positions
While others will find this price level to be good for buying
So as usual we will have a chance to ride the wave of a bullish correction
LONG🚀
✅Like and subscribe to never miss a new idea!✅

Today analysis for Nasdaq, Oil, and GoldNasdaq
The Nasdaq closed lower following news that Microsoft is reducing its data center leasing. This week, the weekly chart suggests strong selling pressure, meaning long positions should be approached with caution.
On the daily chart, yesterday’s bearish candle confirmed the MACD sell signal, though the signal line remains above the zero line. In a broader context, a potential bounce could occur near key technical levels, including the lower Bollinger Band, 120-day moving average, and previous resistance zones.
Two days ago, a large bearish candle formed, and yesterday’s price action provided an opportunity to sell at the 3-day moving average. However, the market failed to test the 3-day MA during pre-market, leading to a false impression that the daily close was rejected at resistance. This illustrates how a daily close can sometimes be misleading, reinforcing the need to plan for alternative scenarios.
Since selling was executed at the 3-day MA yesterday, today’s key resistance level shifts to the 5-day moving average. Given the wide gap between price and the 5-day MA, a short-term rebound toward this level is possible.
On the 240-minute chart, both the MACD and signal line have moved below the zero line, confirming continued selling pressure. However, since the Nasdaq has now entered a key support zone from a previous range, a short-term bounce toward the 5-day MA is possible. Traders should be cautious with short positions and focus on range-bound strategies rather than chasing downside momentum.
Crude Oil
Crude oil gapped down but managed to close higher. Despite the ongoing MACD sell signal on the daily chart, oil held above the key $70 support level.
This week’s weekly close is critical—if oil can end the week with a bullish candle, it could set the stage for a potential reversal. Holding above $70 remains the key technical factor, as a breakdown below this level would signal further downside.
On the daily chart, if the market fails to extend lower and instead rebounds, a MACD double-bottom pattern could develop, reinforcing potential upside momentum. However, since market flows remain mixed, it is best to treat oil as range-bound until a decisive break occurs.
On the 240-minute chart, both the MACD and signal line are below the zero line, but price action is attempting a temporary rebound. While selling into rallies remains the preferred approach, traders should be cautious of event-driven volatility, as news developments could trigger sudden moves.
The $70 level remains the key downside level to monitor—if it breaks, selling pressure could intensify. Risk management is crucial when taking long positions.
Gold
Gold briefly made new highs before closing flat within its range. On the daily chart, the buy signal remains intact, but today’s session will be crucial in determining whether gold can sustain its momentum or enter a consolidation phase.
The key factor to watch is whether gold finds support at the signal line and continues higher or if a bearish crossover forms, leading to a range-bound correction.
On the 240-minute chart, a bullish MACD crossover has occurred, but for the uptrend to be confirmed, a strong breakout candle is needed. Without a significant bullish move, gold risks forming a bearish divergence, meaning that even if price breaks to new highs, the MACD may fail to confirm the move.
Since market flows remain mixed, a range-trading approach remains most effective, with a focus on buying at strong support levels and avoiding breakout trades. Traders should remain flexible and manage risk carefully, as both upside and downside scenarios remain open.
Looking at VIX futures, a strong buy signal has emerged at the zero level. Historically, VIX buy signals near zero tend to generate large price swings, suggesting that Nasdaq volatility may increase significantly. This increases the likelihood of a sharp correction, making risk management a top priority.
Stay disciplined, manage risk carefully, and wishing you a successful trading day! 🚀
If you like my analysis, please follow me and give it a boost!
For additional strategies for today, check out my profile. Thank you!
Weekly and Monday analysis for Nasdaq, Oil, and GoldNasdaq
The Nasdaq closed lower as the Consumer Sentiment Index declined. Last Thursday, I mentioned that the weekly chart suggested continued downside potential, and with Friday’s sharp decline, the weekly MACD has once again turned strongly bearish. Since the weekly MACD failed to form a bullish crossover and has now resumed its downward trajectory, this move can be seen as a whipsaw pattern followed by renewed selling pressure.
On the daily chart, the Nasdaq has dropped to the 60-day moving average, and the MACD has crossed below the signal line, triggering a sell signal. However, since Friday’s daily candle alone does not fully confirm the sell signal, today’s price action will be key in determining whether the sell signal is fully confirmed. The market decline was primarily driven by concerns over weaker consumer spending, tariff-related inflation expectations, and broader economic uncertainty. Since a large bearish candle has formed on the daily chart, the market should be approached with a sell-biased strategy. Given the strong resistance zones, selling near the 3-day moving average upon any rebound would be an effective approach.
On the 240-minute chart, the MACD has dropped sharply, pushing the signal line below the zero level. However, a short-term bounce may occur due to oversold conditions, making it important to watch for early support levels in the pre-market session. A range-bound approach remains favorable in the short term.
Crude Oil
Crude oil closed lower, pressured by expectations of increased oil supply from Iraq. On the daily chart, a buy signal appeared on Friday, but as mentioned earlier, it was not fully confirmed. Instead, oil closed lower, leading to a failed bullish signal and renewed downward momentum in the MACD. This shift in momentum suggests that selling pressure is increasing, making it more likely that oil will struggle to sustain a bullish breakout.
On the weekly chart, the MACD has not yet crossed below the signal line, meaning that some rebound potential remains. However, if oil closes the week with a bearish candle, a weekly sell signal could be triggered. The $70 level remains a key support zone. Until $70 is broken, oil should be treated as range-bound. However, if $70 is breached, downside momentum could accelerate, making a sell-biased strategy more favorable.
On the 240-minute chart, the MACD has dropped below the zero line, while the signal line remains above it. This suggests that some support may still exist near $70, but if the signal line also drops below zero, selling pressure could intensify further. Risk management is crucial for long positions in this environment.
Gold
Gold closed flat, remaining within a range-bound market structure. On the weekly chart, the bullish trend remains intact, but the market is now in a potential correction zone. On the daily chart, the MACD and signal line are nearly converging, making today’s price action critical in determining whether gold will break higher or enter a consolidation phase.
On the 240-minute chart, gold is trading sideways at recent highs, reinforcing the range-bound nature of the market. The MACD failed to maintain bullish momentum and has started turning downward, but since it remains above the zero line, even if gold declines, it is likely to bounce back within the range. However, if the 240-minute MACD falls below zero and the signal line follows, this could trigger a sharp correction following the recent rally. Traders should watch this development closely.
This week, key events include NVIDIA earnings(Wednesday), U.S. GDP report(Thursday), PCE inflation data(Friday). As the week progresses, market volatility is expected to increase, making risk management a top priority.
Wishing you a successful trading week!
If you like detailed this analysis and today's strategy, please follow me and give it a boost!

Levels to consider for Crude oil Futures CL1!On this video i discuss what I think is the next long/short to consider and illustrate how not to get caught up in the noise of low probability setups .
Currently we are trading inside of a range between the POC and the VAH .
I look back on previous highs in the chart and how we reacted at those levels and what I potentially see looking forward . My bias overall is expecting more downside but I dont marry that one bias and simply look at the PA from both sides with a focus on having a plan in the event of a move up or Down .

Today analysis for Nasdaq, Oil, and GoldNasdaq
The Nasdaq closed lower as Walmart’s earnings report raised concerns about slowing consumer demand. Today marks the weekly close, and since the weekly chart has not yet confirmed a buy signal, any downward movement in the MACD could increase the likelihood of further declines.
On the daily chart, the 10-day moving average is acting as support, aligning with the upper boundary of the February range. The MACD remains in a buy signal, but market flows are mixed, suggesting that choppy price action with alternating bullish and bearish candles could persist.
Until a strong breakout candle decisively clears previous highs, it is safer to treat the current market as range-bound. While the bullish bias remains, traders should monitor whether the daily MACD generates a sell signal, which could shift momentum in favor of sellers.
On the 240-minute chart, the MACD is declining sharply, indicating that buying pressure is weak. However, since the signal line is still above the zero line, a rebound attempt could emerge between 21,800 and 21,900. If the gap between the MACD and the signal line continues to widen, traders should avoid chasing long positions, even if a short-term bounce occurs.
Crude Oil
Crude oil closed higher, finding support near the $71 level. A buy signal has appeared on the daily chart, though it is not yet confirmed. The MACD and signal line have formed a golden cross, but today’s daily close will likely determine whether the buy signal holds.
If the buy signal remains valid, oil could be forming a double-bottom pattern, confirming a base before moving higher. However, given weekend geopolitical risks, holding positions over the weekend (overweekend exposure) should be approached with caution.
On the 240-minute chart, the MACD has pulled back toward the signal line before resuming an upward move, forming a wave 3 buying pattern. Since further upside momentum is possible, traders should focus on buying dips rather than chasing breakouts.
Gold
Gold closed higher after breaking above its previous high. On the daily chart, the MACD and signal line are closely aligned, meaning that if gold prints a bearish candle and breaks below the 10-day moving average, a bearish crossover (death cross) is likely.
Since the MACD and signal line are still at elevated levels above the zero line, any selloff is likely to be met with buying interest, keeping the market range-bound. However, if gold breaks below the lower boundary of the current range, a sharp sell-off could occur, making stop-loss management crucial for long positions.
On the 240-minute chart, gold has briefly broken above a triple-top formation before pulling back, forming a whipsaw pattern. This suggests that a further drop is likely.
If the MACD on the 240-minute chart crosses below the signal line, it could mark the start of a trend reversal, making this a key technical level to watch.
Overall, gold remains in a range-bound environment, but selling at highs is currently more favorable. If buying at support, stop-loss management is essential.
As we close out the weekly session, traders should focus on risk management and ensure safe trading strategies. Take the weekend to rest, recharge, and maintain a healthy balance between trading and personal life. Wishing you a successful trading day and a great weekend!
If you like my analysis, please follow me and give it a boost!
For additional strategies for today, check out my profile. Thank you!

USOIL WTI Crude OilWTI Crude Oil (USOIL) has successfully broken above the descending trend-line, signalling a potential trend reversal. After the breakout, the price has retraced back to retest the trend-line support, confirming its strength as a new support level.
Key Technical Observations:
✅ Trend-line Breakout & Retest – The price has broken the downward trend-line and is now finding support around $70.800, indicating a shift in momentum.
The price is currently trading above the 21-period and 50-period Exponential Moving Averages (EMAs), which further confirms the bullish momentum and potential for an upward move.
✅ Targets for the Upside:
Target 2: $71.900 (First resistance level)
Target 2: $72.600 (second resistance level)
Target 2: $73.500 (Major resistance level)
✅ Support Level: $70.800 – Holding above this level strengthens the bullish outlook.

USOIL - one n single support, holds or not??#USOIL - after a perfect ride in yesterday now market is at his one of the most expensive supporting area that is 71.70 around.
keep close that area and only only stay in buying above that.
and keep in mind that below 71.70 we will go for CUT N REVERSE on confirmation.
stay sharp
good luck
trade wisely

CRUDE OIL (WTI): Classic Bullish Setup
I think that WTI Crude Oil has a potential to continue rising.
The market was consolidating for a while within a wide intraday horizontal range.
Its resistance breakout is a strong bullish signal.
Next resistance - 0.7315
❤️Please, support my work with like, thank you!❤️

Today analysis for Nasdaq, Oil, and GoldNasdaq
The Nasdaq closed higher within its range, finding support at the 5-day moving average. While the daily buy signal remains intact, the market showed some corrective movement following yesterday’s doji candle, with selling pressure continuing on the lower time frames.
As the index approaches previous highs, profit-taking is occurring, leading to a temporary consolidation phase. Market flows remain mixed, which could make it difficult for the Nasdaq to break through resistance decisively. However, as long as the index continues to hold the 5-day MA, the potential for a continued rally remains.
On the 240-minute chart, the sell signal remains active, and the market is consolidating within a range. Since the MACD and signal line remain above the zero line, further upside attempts are likely.
For now, a range-trading strategy—buying near support and selling near resistance—remains the most effective approach.
Crude Oil
Crude oil closed higher, breaking above the $72 level. On the daily chart, the MACD has not yet confirmed a bullish crossover, making it too early to fully confirm an uptrend.
Although oil has formed a double-bottom pattern, market flows remain mixed, and since the MACD and signal line are converging near the zero level, a strong breakout or breakdown could occur soon. Given that the weekly MACD remains in an uptrend, buying dips remains the preferred strategy.
On the 240-minute chart, the MACD and signal line have both moved above the zero line, confirming strong buying momentum. If oil breaks above the neckline at $73, a strong bullish move could follow. However, if the market fails to hold above $73, it could settle into a range-bound structure.
For now, buying on dips remains the most favorable strategy, but traders should be cautious, as today’s crude oil inventory report could introduce significant volatility.
Gold
Gold failed to break above its previous high, closing lower. The market remains in a range-bound structure, with the MACD initially turning upward but now shifting back toward the signal line.
If the MACD forms a bearish crossover, gold is likely to remain in a consolidation phase, and the next key question will be whether gold finds support at the 20-day moving average or moves even lower to test previous breakout levels.
On the 240-minute chart, the MACD is pulling back toward the signal line, showing signs of weakening momentum. Additionally, the market appears to be forming a triple-top (head-and-shoulders) pattern, meaning that if the neckline breaks, a further decline could follow.
Given these conditions, the best approach is to trade within the current range, favoring selling near highs while only considering long positions at key support levels.
Stay disciplined, manage risk carefully, and have a successful trading day! 🚀
If you like my analysis, please follow me and give it a boost!
For additional strategies for today, check out my profile. Thank you!

USOIL - high placed? whats next??#USOIL... market just placed a high and if market hold it in that case we can see a drop from here.
don't be lazy here guys.
stay sharp
good luck
trade wisely

Today analysis for Nasdaq, Oil, and GoldNasdaq
The Nasdaq closed flat with a doji candle, facing resistance at previous highs. As mentioned yesterday, there was a possibility of a pullback to the 5-day moving average, and while the market did not fully correct to that level, it did consolidate and pull the 5-day MA higher, suggesting a preparatory phase for further upside.
On the daily chart, the MACD and signal line remain upward-facing, indicating that buying dips remains the preferred strategy. However, since trading volume remains relatively low and market flows appear mixed, it is advisable to take profits quickly when buying dips rather than holding for extended gains.
On the 240-minute chart, a sell signal has appeared at the highs, meaning that a pullback toward the upper boundary of the previous range is possible. Given the doji candle on the daily chart, traders should be cautious about chasing longs in the pre-market session. If the MACD turns downward, selling pressure could intensify.
That said, the MACD and signal line remain well above the zero line, suggesting that rebound attempts are likely. While the sell signal remains active, short positions should be managed with strict stop-loss levels.
Tonight, the FOMC meeting minutes will be released, so be mindful of potential volatility during the regular session and after-hours trading.
Crude Oil
Crude oil closed higher, testing $72 as resistance while forming a potential double-bottom pattern. The MACD on the daily chart is approaching a key decision point, where it will either bullishly cross above the signal line or turn lower again, determining the next directional move.
Since the signal line is near the zero level, the next buy or sell signal is likely to trigger a significant price move. Additionally, the ongoing Ukraine-Russia peace negotiations remain a key geopolitical risk factor, as any developments could lead to increased oil price volatility.
From a technical perspective, oil remains within a range-bound structure, making buying dips the most effective approach. A break below $70 would be a bearish signal, while sustained movement above $72 could confirm a breakout.
On the 240-minute chart, the MACD has moved above the zero line, lifting the signal line upward. While a short-term pullback is possible, as long as the MACD does not form a bearish crossover, buying pressure could strengthen further.
Gold
Gold closed higher, rebounding from previous levels. Yesterday’s price action confirmed that the MACD used the signal line as support and turned higher, reinforcing the bullish trend.
Since the MACD has not yet crossed below the signal line, the daily chart remains in a buy-biased structure, meaning that until a confirmed bearish crossover occurs, the market should still be approached with a buy-on-dip mindset.
However, if gold moves above its previous high but the MACD fails to exceed its previous peak, a bearish divergence could form, increasing the risk of a sharp correction. Traders should remain aware of this scenario and avoid chasing long positions at elevated levels.
On the 240-minute chart, the MACD has crossed above the signal line near the zero level, generating a strong upward wave. However, the market is approaching key resistance zones, and if another rally occurs, a bearish divergence could develop, reinforcing the need for cautious positioning.
Buying at major support levels remains the safest strategy, while avoiding breakout trades is advisable.
With the FOMC meeting minutes set for release tonight, overnight positions in gold should be managed carefully due to the potential for increased volatility.
Despite high market volatility, trends remain clear across different asset classes, making trading conditions manageable. Instead of attempting countertrend trades, focus on following the prevailing trend and capitalizing on structured setups.Wishing you a successful trading day!
If you like my analysis, please follow me and give it a boost!
For additional strategies for today, check out my profile. Thank you!

USOIL READY TO EXPLODE?! DON’T MISS THIS CRUCIAL MOVE!📊 USOIL (Crude Oil) Analysis – February 17
What’s up, traders? Mr. Blue Ocean FX here with another deep dive into the markets, and today, we’re breaking down US Oil (Crude Oil) and the major opportunities setting up. Let’s get straight into it.
📉 Weekly Time Frame Insight
• Last week’s candle closed with exhaustion, printing a low at 70.30 but losing volume compared to previous bearish moves.
• Key Resistance: 71.55 area was broken, signaling potential bullish momentum.
• Impulse Move: Price pushed as high as 79.44 (Jan 13th), breaking past the 77.90 October high before retesting that level.
📊 Daily Time Frame Setup
• USOIL is currently ranging in a consolidation zone, and we are at the lower region of this range.
• Buy Zone Identified:
• Three bottom touches suggest a strong support level.
• Higher low structure forming at 70.58, above the previous Feb 6th low of 70.34.
• If bulls hold this zone, we could see a strong push to the upside.
🕒 4H Time Frame Execution Plan
• Structure Confirmation: After a deep retracement, price failed to print a new low.
• Liquidity Sweep: A wick below 70.16 may have stopped early buyers before price reclaimed.
• Entry Plan:
• Buy near 70.68 (entry level).
• Stops below the recent low.
• Targeting 72.04, then 73.32, with further upside potential to 74.21+ if consolidation breaks.
• Channel Formation: USOIL is respecting an upward-sloping trend channel that could continue bouncing before a major breakout or breakdown.
🚀 What’s Next?
If bulls maintain control, we could see an explosive breakout, targeting higher liquidity zones above 74.21. However, if price breaks down, we may see another leg lower before a final push up.
🔥 What do you think? Will oil rally higher or break down? Drop your thoughts in the comments!
📢 If you found this breakdown valuable:
✅ Boost this post
✅ Share it with a fellow trader
✅ Follow for more
Let’s catch these moves! 🚀💰 #USOIL #CrudeOil #Trading #Forex #MarketBreakdown

Does our LIS hold? Weekly CL Trade IdeaNYMEX:CL1!
Macro Update:
There are a lot of market moving events taking shape on the macro landscape.
Peace negotiations between warring countries, reciprocal trade tariffs, and a US-Iran nuclear deal.
We need not mention that any of these events may potentially turn market sentiment risk on or risk off. It all depends on how these all unfold.
On the economic front, we have rate decisions from various central banks. Most central banks reiterate cautious cuts and turn hawkish amidst concerns about the rising inflation outlook. Central banks are also pointing towards rising uncertainty on the outlook itself as we mentioned above. It all depends on how events unfold.
WTI Crude Oil Big Picture:
Viewing a weekly full session WTI crude oil chart, we can see 3 weeks of one time framing up on the weekly chart starting Dec 30th, 2024. We then saw a rejection of uptrend and prices reverting to 2024 Value area. We can see four bearish weekly candlesticks from the week starting Jan 20th, 2025. Last week, the price action on the weekly timeframe formed an inverted hammer showing bearish pressure increasing on WTI crude oil. Our key LIS and key bull support show the confluence of multiple market generated levels has held up for the past 3 weeks.
Traders take note that WTI crude oil futures contract has rolled over to April 2025 contract. Symbol: CLJ2025
In addition, DOE WTI inventory numbers will be released on Thursday 11am CT due to US President’s Day on Monday February 17th, 2025.
Key Levels to Watch
Key levels represent areas of interest and zones of active market participation. The more significant a key level, the closer we monitor it for potential reactions and trade setups in alignment with our trading plan.
2025 mcVPOC: 72.82
Feb 2025 mcVAH: 7 2.48
2025 mcVAL: 70.56
Yearly Open/ LIS: 70.52
Key Bull Support/ Confluence Zone: 70.52 - 70.12
Scenario 1: Range bound week ahead
In this scenario we expect range bound price action contained within Feb 2025 micro composite Value Area.
Scenario 2: Risk-off sentiment shift prices below key LIS
In this scenario, we may see a breakdown of our key bull support and Line in Sand. Price moves and stays below yearly open price, providing a possible shift lower towards composite volume point of control (CVPOC).
Micro CME contracts allow for more precise risk management during volatile market conditions. Additionally, you can participate in the CME and TradingView paper trading competition, giving you the opportunity to test your skills in The Leap without risking real money.
