CRUDE OIL (WTI): Important Support Clusters to Watch
On a today's live stream, we discussed potentially significant
historic supports on WTI Crude Oil to watch.
Support 1: 57.0 - 59.0 area
Support 2: 52.5 - 54.6 area
Support 3: 48.8 - 50.4 area
Support 4: 40.6 - 43.7 area
The price is currently testing a lower boundary of Support 1.
It perfectly matches with a completion point of a harmonic ABCD pattern.
It looks like we may see some pullback soon.
❤️Please, support my work with like, thank you!❤️
Crude Oil

Today analysis for Nasdaq, Oil, and GoldNasdaq
The Nasdaq closed lower after forming an upper wick at the 5-day moving average on the daily chart. If it had closed with a bullish candle, a technical rebound from the oversold condition could have opened the way to the 10-day moving average, but instead, it ended with a bearish candle.
The daily chart still shows a sell signal, but the best-case scenario would be for the market to form a double bottom pattern after confirming a short-term low and attempt another rise toward the 10-day moving average.
On the intraday charts, there's a high probability that the market will show a double bottom during the pre-market session, especially since there's no clear sell reversal on lower timeframes yet. The 240-minute chart shows a golden cross on the MACD, and although a death cross hasn't yet occurred, the large gap between the MACD and the zero line suggests a continued corrective trend.
As long as the death cross doesn't materialize, buying on dips near the bottom remains favorable. The 16,500 level is a strong support zone on the monthly, weekly, and daily charts, so shorting is not recommended — better to lean toward long setups. With the FOMC minutes due out early tomorrow and the CPI report on the horizon, volatility is expected to rise as the market attempts to form a bottom. Stick to buying on dips, manage risk carefully, and reduce leverage in this volatile environment.
Crude Oil
Crude oil closed lower, continuing its recent downtrend on the daily chart. Concerns over a global economic slowdown and increased production from OPEC nations are dampening the upside. Although the sell signal on the daily MACD remains, there's still potential for a short-term rebound toward the 5-day moving average. If trading short, make sure to set a stop-loss, especially near the strong $57 support zone, where shorting is riskier.
On the 240-minute chart, the MACD has re-crossed into a death cross, showing signs of a third wave of selling pressure. However, there's still a chance of bullish divergence, so avoid chasing short positions. The $57–$59 support range remains strong, and unless this level breaks, buying on dips offers a more favorable risk-reward ratio. Note that today's U.S. crude inventory report could introduce more volatility, so trade carefully.
Gold
Gold closed lower with an upper wick on the daily chart. While the price is still above the 0 line on the MACD, if it pulls back to the previous high resistance area, which coincides with the lower Bollinger Band and the 60-day moving average, it may present a good buying opportunity for swing trades. On the weekly chart, gold is still moving within a sideways range, trapped between key moving averages. With the FOMC minutes today and the CPI tomorrow, it's important to monitor whether the price breaks out of this range.
The 240-minute chart shows that the MACD has not yet formed a golden cross, and there's still a large gap from the 0 line. If MACD rebounds and then corrects again, it's crucial to check whether a double bottom around the 2,980 area is forming. Overall, gold remains a buy-the-dip candidate, and if the price falls to around the 60-day moving average, it could present a great swing entry.
Investor sentiment is reaching extreme levels, and we're witnessing unusually fast and wide price swings. It's hard to rely on daily or weekly charts alone, so it's important to focus on short-term price action and use appropriate leverage for your strategy.
The market will always be open. Survival and consistent profitability are what matter most in the long run. Stay disciplined, manage risk carefully, and take a long-term view as a trader.
Wishing you another day of successful trading!
If you like my analysis, please follow me and give it a boost!
For additional strategies for today, check out my profile. Thank you!

USOIL CATCHING THE FALLING KNIFE|LONG|
✅CRUDE OIL lost 18% of it's
Value in the last 5 days on the
Trade war news, which makes
The market to expect a recession
And a sharp drop in the oil demand
However, I still think that Oil
Is locally oversold, therefore
A local bullish correction is
To be expected from the
Horizontal support below
Around 57.34$ and the
Target being the resistance
Above around 61.81$
LONG🚀
✅Like and subscribe to never miss a new idea!✅
Disclosure: I am part of Trade Nation's Influencer program and receive a monthly fee for using their TradingView charts in my analysis.

Buy oil! Target 63-65!Crude oil is currently in a short position overall, and the rebound momentum is relatively weak. However, in the short-term structure, oil has shown obvious signs of stopping the decline, and the support of the 60-59 area below is still valid.
After hitting the low point of 58.9, oil began to rebound, and the rebound low gradually shifted upward. At present, oil holds the support near 60, and is expected to build a W-bottom structure in the short-term structure, which is conducive to further rebound of oil prices.
Therefore, in terms of short-term trading, you can try to go long on crude oil in the 60.5-59.5 area, and the rebound target will first look at 63, followed by 65
The trading strategy verification accuracy rate is more than 90%; one step ahead, exclusive access to trading strategies and real-time trading settings

Today analysis for Nasdaq, Oil, and GoldNasdaq
The Nasdaq closed lower after experiencing extreme volatility the previous day. Following a gap-down open, the market attempted a bottoming process. However, the spread of fake news related to tariffs triggered a 10% intraday swing, making the Nasdaq trade more like an individual stock than a major index. Massive trading volume occurred due to margin calls from CFDs and hedge funds, and the market showed some signs of recognition around a potential short-term bottom.
On the weekly chart, the index rebounded but was resisted at the 3-week moving average. On the daily chart, a doji bullish candlestick with strong volume formed, suggesting the market may attempt another rebound. However, since volatility from the bottom remains significant, if you’re planning to enter long positions, it's best to buy as close to the bottom as possible. If the market continues to form a base, a rebound toward the 5-day or 10-day moving average on the daily chart is possible.
On the 240-minute chart, the market is still in a death cross and remains oversold. Still, it's showing signs of forming a base around the 16,500 level, so it's better to avoid chasing short positions during any pullbacks that could form a double bottom. In this oversold environment, a buy-on-dip approach near the lows is favorable for a technical rebound. But since volatility remains high, make sure to set clear stop-loss levels for both long and short trades.
Crude Oil
Crude oil experienced a gap-down on the daily chart and closed lower after hitting resistance at the 3-day moving average. On both the daily and weekly charts, the $57–$59 zone appears to be a short-term support level. If the price dips into this zone, it may offer a buying opportunity. Yesterday’s candle was resisted at the 3-day line, so if a bottoming pattern forms today, a rebound toward the 5-day moving average could be anticipated. However, since the MACD has just issued a sell signal near the zero line, it's better to treat any long positions as short-term trades.
On the 240-minute chart, the sell signal is still valid, and the market remains in oversold territory. Watching for a potential double bottom formation before entering long positions is recommended. That said, if market sentiment continues to accept economic recession as a given, oil prices could keep falling. There's also the risk of a one-way downward move, so if you're going long, ensure tight stop-loss levels are in place.
Gold
Gold saw sharp volatility and closed lower after being rejected at the 5-day moving average. Due to the weaker dollar from U.S. tariff announcements, the attractiveness of gold has diminished in the short term. On the weekly chart, gold is still forming a range-bound movement near the 10-week moving average, with support appearing near the $2,975 level. On the daily chart, the lower Bollinger Band and the 60-day moving average are rising and beginning to converge.
These overlapping indicators could form a strong support zone, so if the price drops into this area, it may present a good opportunity to buy the dip. On the 240-minute chart, the MACD and signal lines have both dropped below the zero line, and the RSI has entered oversold territory.
While this could lead to further accelerated selling, it is also a zone where a rebound from oversold conditions could easily occur. It’s best to avoid chasing the downside and instead focus on buying during pullbacks near strong support zones.
Market volatility is increasing, but this is also a zone where technical rebounds are likely due to excessive declines. While confirmation of a bottoming pattern is needed, in this kind of market, it's safer to focus on one direction rather than trying to trade both ways.
Long positions currently offer a better risk-reward ratio, so it’s advisable to enter at the lower end of the range. Reduce leverage as much as possible and always set stop-loss levels to ensure safe trading in these turbulent conditions.
If you like my analysis, please follow me and give it a boost!
For additional strategies for today, check out my profile. Thank you!

Crude below major support now. Intraday Update: Crude oil broke the 161% extension (lower) of the March 5th lows to April 2 lows, this is also below the support of the May 2021 lows and major horizontal support. ONLY a break back above the 61.70 level would take the downside pressure off.

Crude OIL CRASH - OPEC & Trump - Recession Catalyst#Recession is here, Markets are bleeding.
Crude #Oil is the kicker.
I shorted TVC:USOIL on Friday.
Hunting on this trade for a while now.
Very #Bearish outlook on #WTI.
MARKETSCOM:OIL Weekly
#FundamentalAnalysis
- #OPEC+ Output Hike (411K bpd)
- #Trump #Tariffs & #TradeWar
I'm looking at a #CrudeOIL #MarketCrash, similar to the #Covid era, when NYMEX:CL1! went in minus on #Nymex #Futures.
TVC:USOIL & my BIG SHORT
#Trading EASYMARKETS:OILUSD via CFDs with #Leverage.
Executed my #Sell Position on #WTI at $64.
* DYOR before, it's not a financial advice, I just share.
#TechnicalAnalysis
- #ElliottWave Impulse Cycle a (white)
- #Correction in Primary ABC (red)
- #LeadingDiagonal in Primary A (red)
- #Descending Triangle in Primary B (red)
Why will BLACKBULL:WTI Crash?
#Bearish Primary C (red) has started.
#Break-out below the Triangle Flat Line.
Important Note:
The #Bearish #Impulse will continue lower.
After the short-lived pull-back, Sellers will dominate.
$63-64 Range is the Entry.
MARKETSCOM:OIL Daily
TVC:USOIL #Short #TradeSignal
- Entry @ $63-64 Range
- SL @ $73
- TP1 @ $40
- TP2 @ $30
- TP3 @ $20
Stay in the green and many pips ahead!
Richard (Wave Jedi)

Today analysis for Nasdaq, Oil, and GoldNasdaq
The Nasdaq closed sharply lower due to the aftermath of tariff impositions. Following a significant gap-down, the index broke below the lower Bollinger Band, intensifying selling pressure. Yesterday’s bearish candlestick confirmed a sell signal, leading to an expanded third wave of selling. The index has now reached the previous support zone near 18,500, with additional volatility expected due to today’s Non-Farm Payrolls (NFP) report and Fed Chair Powell’s speech.
On the monthly chart, the Nasdaq is forming a lower shadow around the 20-month moving average. Given the sharp decline, if further selling occurs, oversold conditions may trigger a strong rebound, making it risky to chase shorts at this stage. The 240-minute chart also shows a sell signal, with heavy selling pressure continuing. However, this is a risky zone to enter new short positions, so it's advisable to monitor short-term price movements before making a move.
Regardless of whether you take long or short positions, due to high volatility, make sure to set stop-loss levels and adjust leverage to a manageable risk level.
Additionally, the VIX surged, forming a large bullish candle and reaching its March 11 high. With the VIX in an uptrend and a buy signal appearing, further volatility expansion is likely. However, since it has reached a key resistance zone, a short-term pullback in the VIX could allow for a Nasdaq rebound. For the VIX to break above its previous high, a period of consolidation may be necessary. Given the strong buying momentum on both the weekly and monthly charts, this should be taken into consideration when forming a trading strategy.
Crude Oil
Crude oil plunged following the OPEC meeting, where supply increases became a key issue. While oversupply concerns are a factor, the economic slowdown fears from tariffs have also played a major role in the decline. Previously, $68 was considered a strong support level, but oil collapsed from $72 in a steep decline. The final key support lies around $66.
On the daily chart, the MACD and signal line are converging near the zero line, suggesting that once a new wave begins, it could lead to a strong trend movement. Depending on today's session and Monday’s market, oil could see an aggressive breakout in either direction. Current candlestick patterns indicate that the weekly chart remains bearish, meaning holding long positions over the weekend carries significant risk.
The 240-minute chart also confirms a strong sell signal, with MACD plummeting. Oil may form a temporary sideways range near the $66 support, but if this level breaks, selling pressure could intensify. Ensure you manage stop-loss risks carefully in case of further downside.
Gold
Gold declined, reacting to fluctuations in the U.S. dollar's value. The price failed to hold above $3,200 and dropped below the 5-day moving average. Gold has been in a one-way trend, so a bullish approach remains valid unless it breaks below the 10-day MA. However, it has now entered a range-bound phase, and MACD on the daily chart is nearing the signal line, suggesting potential downside risks. The MACD failed to break its February highs, increasing the likelihood of divergence, which could trigger a strong correction if selling intensifies. With rising market volatility and today's NFP release, further wild swings in gold prices are expected.
The 240-minute chart has shown a sell signal, leading to a sharp decline. However, the price has found support near a key resistance-turned-support zone. Since the MACD and signal line remain above the zero line, gold may continue trading within a range in the short term. On shorter timeframes, candlestick volatility is high, so reducing leverage and widening stop ranges would be a prudent strategy.
During periods of extreme market volatility, technical analysis may become less effective, as market sentiment often overrides chart patterns. As always, trade only within your manageable volatility range. The market is always open, so even if you incur losses, there will always be opportunities to recover. Manage risk wisely, and best of luck with your trades today!
If you like my analysis, please follow me and give it a boost!
For additional strategies for today, check out my profile. Thank you!

USOIL LONG SIGNAL|
✅CRUDE OIL fell down sharply
And will soon retest a key wide
Support area around 66.00$
So I think that the pair will make a rebound
Therefore we will be able to enter
A long trade with the TP of 68.20$
And the SL of 65.17$
LONG🚀
✅Like and subscribe to never miss a new idea!✅
Disclosure: I am part of Trade Nation's Influencer program and receive a monthly fee for using their TradingView charts in my analysis.

WTI Crude Oil (XTIUSD) – H4 SELL SetupWTI Crude Oil (XTIUSD) – H4 SELL Setup
Price has reacted from a key H4 supply zone after taking out previous highs. A clean bearish shift suggests continuation to the downside.
🔹 Entry: At supply zone
🔹 SL: Above mitigation zone
🔹 TPs:
First support
Equal lows
Extended swing low
Bias: Bearish
Reasoning: Liquidity sweep + market structure shift + imbalance

Today analysis for Nasdaq, Oil, and GoldNasdaq
The Nasdaq closed higher on the daily chart. However, following the announcement of mutual tariffs after the previous session’s close, the index experienced a significant gap-down. On the daily chart, the MACD has crossed below the signal line, generating a sell signal, though confirmation is still pending. If today's session closes with a bearish candle, we must monitor whether this leads to a third wave of selling, signaling further downside.
Due to the gap-down, the price is now significantly distanced from the 3-day and 5-day moving averages (MAs), making it crucial to observe whether the price rebounds intraday or continues to decline further. With the first support level at 19,000 now breached, the next key support is around 18,500. When considering buy positions, it is essential to manage stop-loss risk carefully.
On the 240-minute chart, a sell signal has appeared but is not yet confirmed. If confirmed, it could trigger a third wave of selling pressure, potentially leading to further declines. Given the increased market volatility, a cautious approach is recommended—reducing leverage and only trading at key price levels to minimize potential losses.
Crude Oil
Crude oil closed higher while maintaining a range-bound movement around $72. On the daily chart, the MACD has moved above the signal line and the zero line, establishing a bullish trend. However, following the mutual tariff announcement, the price gapped down, dropping below $70. The strongest support zone lies around $68, making it crucial to observe whether the MACD adjusts and aligns with the signal line before rebounding from this support level to resume the bullish trend.
On the 240-minute chart, a sell signal has appeared, but with multiple support levels nearby and both MACD and the signal line still above the zero line, the market is likely to attempt rebounds. A buy-the-dip approach remains favorable, but caution is necessary given today’s OPEC meeting, which could lead to increased volatility.
Gold
Gold closed higher, finding support at the 5-day MA. Following the mutual tariff announcement, the price initially gapped up to around 3,200, before pulling back. As previously mentioned, the upward target for this wave is around 3,216, with strong buying momentum continuing. On the daily chart, gold is trading between the 5-day MA and the upper Bollinger Band, maintaining a one-way bullish structure.
A bullish strategy remains favorable unless the daily close falls below the 10-day MA. On the 240-minute chart, the MACD remains above the zero line and previously attempted to break above the signal line but has since pulled back. Since buying momentum is still present, if the price finds support at a key supply zone, another leg higher could occur, potentially triggering a golden cross in the MACD and leading to a third wave of buying pressure.
Short positions should be approached with caution, and given the increased market volatility, risk management is crucial. Whether buying or selling, stop-loss discipline is essential to manage potential risks.
Market volatility has surged since the pre-market session due to Trump’s mutual tariff policies. Volatility is both an opportunity and a risk for traders. Do not let greed lead to losses in a market that doesn’t match your trading style. Adjust position sizes accordingly and only trade within your comfort zone. The market is always open. Do not focus solely on today—take a steady and stable approach to trading.
Wishing you a successful trading day!
If you like my analysis, please follow me and give it a boost!
For additional strategies for today, check out my profile. Thank you!

USOIL - NEW BREAKOUTHello Traders !
On Wednesday 5 March, The USOIL reached the support level (65.24 - 66.28).
Yesterday, The price broke the resistance level (70.08 - 70.57).
This key level becomes new support level !
So, I expect a bullish move🚀
________________
TARGET: 72.490🎯

Crude Oil Technical AnalysisFenzoFx—Crude Oil trades are bullish, stabilizing above $70.60. Stochastic signals overbought. A correction toward the 50-SMA is likely before the uptrend resumes.
Trade Crude Oil without Swap Charges at FenzoFx.

Today analysis for Nasdaq, Oil, and GoldNasdaq
The Nasdaq closed higher on the daily chart. Although a sell signal briefly appeared in the previous session, the MACD failed to form a bearish crossover with the signal line, instead finding support and rebounding. The index strongly bounced from its low, reaching the 5-day moving average (MA) before closing with an upper wick.
Since the MACD is supporting the signal line and potentially resuming an upward trend, the key level to watch is whether the price can break through the strong resistance at 19,625–19,675. As long as the MACD does not confirm a bearish crossover, it is advisable to trade within the range.
On the 240-minute chart, the index rebounded from the bottom while generating a buy signal. However, with strong resistance around 19,675, if the price pulls back once more, it could either form a double bottom or resume a strong upward move from a single-bottom structure.
Although the MACD has crossed above the signal line (golden cross) on the 240-minute chart, it is still far from the zero line, suggesting that further pullbacks may occur after additional gains. It is important to avoid chasing the price and instead focus on buying dips at key support levels while maintaining a range-trading approach.
Crude Oil
Oil closed flat, facing resistance at $72. On the daily chart, the price broke above the 240-day MA and is now testing resistance from a previous supply zone. It is likely to consolidate within a range while pulling up the short-term moving averages.
The daily MACD has moved above the zero line, lifting the signal line as well. If the price remains in a range-bound consolidation, the signal line will eventually rise above the zero line, further supporting a bullish structure.
Key upcoming events include today’s oil inventory report and tomorrow’s OPEC meeting, which could act as catalysts for either a continuation of the rally or a pullback. Since there is still a gap between the 3-day and 5-day MAs, range trading remains the best approach.
On the 240-minute chart, strong buying momentum continues, but given the heavy supply at previous resistance levels, a period of sideways movement or a pullback is likely.
If a bearish crossover occurs on the 240-minute chart, oil could drop below $70. For now, monitor whether the uptrend can hold, and if it does, consider trading within the range while managing downside risks.
Gold
Gold closed lower after an overshoot to the upside. On the daily chart, the price was in an overextended high position, with a significant gap from the 3-day and 5-day MAs. After a brief rally, selling pressure emerged, leading to a bearish close.
Since gold has yet to properly test the 5-day MA, a pullback to this level remains a possibility. However, the daily MACD is still trending upward, and liquidity remains strong, increasing the likelihood of a one-way rally unless the 10-day MA is broken. Short positions should be approached with caution.
On the 240-minute chart, a bearish crossover has occurred, leading to a pullback from the high. However, since the uptrend remains intact, even if the MACD crosses below the signal line, the fact that it is still above the zero line suggests a potential rebound.
The best strategy is to focus on buying dips at key support levels, as the market is likely to consolidate before resuming a trend move. Be cautious when trading within a range-bound market.
With Friday’s U.S. employment report approaching, market volatility remains elevated. Trump’s tariff policies are increasing concerns about inflation and a potential economic slowdown. The interpretation of upcoming economic data will be crucial in determining market direction.
Risk management remains essential, so trade cautiously and stay prepared.
Wishing you a successful trading day!
If you like my analysis, please follow me and give it a boost!
For additional strategies for today, check out my profile. Thank you!

CRUDE OIL LONG SIGNAL|
✅CRUDE OIL is trading in a
Strong uptrend and was making
A local bearish correction but
A horizontal support level was
Hit at 71.00$ so we can go
Long on with the TP of 71.72$
And the SL of 70.59$
LONG🚀
✅Like and subscribe to never miss a new idea!✅
Disclosure: I am part of Trade Nation's Influencer program and receive a monthly fee for using their TradingView charts in my analysis.

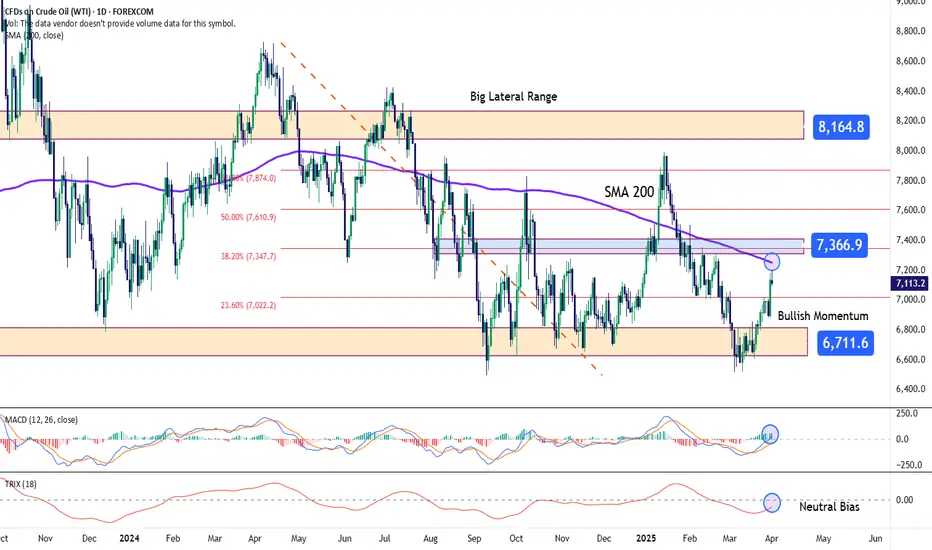
Crude Oil: WTI Recovers Slightly Above the $70 ZoneSince touching the key support level at $67 , WTI crude oil has posted a notable recovery of more than 7% in recent weeks, and is now hovering slightly above the $70 per barrel mark. For now, the bullish bias remains intact as comments from the White House suggest potential tariffs ranging from 25% to 50% on countries that choose to trade Russian oil. According to President Trump, Russia has failed to implement a ceasefire in the short term and this could lead to additional tarrifs. Although this new tariff strategy has no official date, if enacted, it could significantly disrupt global oil supply, reinforcing short-term bullish expectations for crude.
Wide Sideways Range:
For several months now, oil has been moving within a stable sideways range between $81 (resistance) and $67 (support) per barrel. So far, there hasn't been any significant breakout from this channel, making it the dominant structure on the chart in the short term.
MACD:
The MACD histogram continues to oscillate just above the zero line, but recent sessions have shown slight bearish momentum, possibly signaling a pause in the upward movement as the dominance of the moving averages appears to be neutralizing.
TRIX:
A similar situation is developing in the TRIX indicator, with the line hovering just below the neutral 0 level. This suggests that the strength of the 18-period moving average has entered a zone of balance, lacking a clear directional force.
The behavior of both indicators implies that momentum is gradually weakening as the price approaches resistance levels.
Key Levels:
$73: A key resistance level located near the midpoint of the sideways range, also aligning with the 200-period moving average. A breakout above this level could trigger a solid short-term bullish trend.
$81: A distant resistance level marking the top of the current range. Price action reaching this level could be decisive in confirming a long-term bullish breakout.
$67: A significant support level , marking the lower boundary of the range. A return to this level could revive previously dormant bearish pressure and potentially resume a longer-term downtrend that began several weeks ago.
By Julian Pineda, CFA – Market Analyst
USOIL Daily Analysis: Bullish Reversal from Key Support USOIL (WTI Crude Oil) daily chart showing price action analysis.
Key Observations:
Support Zone:
A strong demand zone is marked around $65-$66, which has acted as a reversal area in the past.
The price has recently bounced off this zone, indicating potential buyer interest.
Current Price Action:
Price is currently trading at $68.25.
A bullish move started from the support region, with a higher low formation suggesting potential upside momentum.
Potential Scenario:
The chart suggests a pullback before continuation to the upside.
If the support holds, $70-$72 could be the next target.
If price fails to hold above $66, further downside towards $64 may be possible.
Outlook:
Bullish Bias 📈 as long as the price remains above the demand zone.
Watch for a higher low confirmation before entering a long trade.
Breakout above $70 could signal a stronger rally.

CRUDE OIL (WTI): More Growth Ahead
After a 4-days long accumulation on a key daily resistance,
WTI Oil bounced strongly on Monday, violating a key daily resistance.
The market is likely to continue advancing.
Next resistance is 72.5
❤️Please, support my work with like, thank you!❤️

Today analysis for Nasdaq, Oil, and GoldNasdaq
The Nasdaq closed lower with a gap-down amid growing recession fears. Although it did not reach the 20-month moving average (MA) on the monthly chart, last month’s long bearish candlestick has resulted in a sell signal on the monthly futures chart—the first time in three years since February 2022. From a monthly perspective, the 16,900–17,500 range appears to be a good buying zone, but it is important to monitor whether the index reaches this level within this month’s candle. The 20-month MA is likely to be briefly breached, even if a lower wick forms.
On the weekly chart, the Nasdaq is currently finding short-term support around 19,000, but given the large gap between the 3-week and 5-week MAs, a rebound remains a possibility. On the daily chart, a sell signal has not yet been confirmed. If further declines confirm a bearish crossover, the Nasdaq could enter a third wave of selling, with a target of 17,300. The key question is whether the market experiences another sharp drop.
However, given the significant distance from the 5-day MA, the more likely scenario is sideways movement for a few days, allowing the moving averages to catch up before a potential further decline. In this case, it is advisable to trade within the range but always use stop-losses. The 240-minute chart also shows strong downward movement. While the market is in oversold territory, making short-selling more favorable, there is also the possibility of a range-bound pattern forming on the daily chart. If taking buy positions at the lows, strict stop-loss management is essential.
Crude Oil
Oil closed higher following news of tariffs imposed on Russian oil. The price successfully broke above the key resistance at $70, also surpassing the 240-day MA. On the monthly chart, oil has now entered a range where further upside potential exists, and there is a possibility that the MACD could attempt a bullish crossover with the signal line.
On the daily chart, the MACD has moved above the zero line, pulling the signal line upward. If the price stays above the 240-day MA, it may form a strong trend reversal pattern with accelerated gains. On the 240-minute chart, the MACD remains above the zero line and is crossing above the signal line, indicating continued buying momentum.
Overall, it is best to focus on buying dips, as April’s first trading session could see the price gapping above the 240-day MA. Holding overnight short positions carries risk, so caution is advised.
Gold
Gold closed higher, driven by strong demand for safe-haven assets. On the monthly chart, gold formed a long bullish candlestick. However, given the large gap between the price and the 3-month & 5-month MAs, a pullback remains a possibility. The key question is whether gold will continue rising before a correction or correct first before resuming its uptrend. It is best to monitor the price action closely.
On the daily chart, the MACD is forming a third wave of buying pressure, opening the possibility for a price target around 3,216. Thus, it is advisable to focus on buying dips, while being cautious about chasing highs due to potential volatility. The 240-minute chart indicates that strong buying momentum continues, as gold remains in overbought territory.
Since this is the beginning of a new month, key economic reports—including the ISM Manufacturing PMI and the U.S. Jobs Report—could significantly impact gold’s volatility. For both buy and sell positions, it is essential to set stop-loss levels, as increased volatility is expected.
With Trump’s tariff policies increasing the risk of a global recession, liquidity in global equity markets is drying up, reducing the attractiveness of stocks. The clear contrast between Nasdaq and gold’s performance is likely to persist for some time.
As we enter April’s first trading session, trade cautiously and adapt to market conditions.
Wishing you a successful trading day!
If you like my analysis, please follow me and give it a boost!
For additional strategies for today, check out my profile. Thank you!

CRUDE OIL Bullish Breakout! Buy!
Hello,Traders!
CRUDE OIL is trading in an
Uptrend and the pair made
A bullish breakout of the key
Level of 70.30$ and the
Breakout is confirmed so we
Are bullish biased and we
Will be expecting a further
Move up after a potential
Local pullback
Buy!
Comment and subscribe to help us grow!
Check out other forecasts below too!
Disclosure: I am part of Trade Nation's Influencer program and receive a monthly fee for using their TradingView charts in my analysis.

Today analysis for Nasdaq, Oil, and GoldNasdaq
The Nasdaq closed sharply lower, forming a long bearish candlestick, as recession fears intensified. The index fell toward the lower Bollinger Band on the daily chart, while the MACD moved closer to the signal line, indicating a correction.
On the weekly chart, the Nasdaq faced resistance slightly above the 5-week MA, forming an upper wick and closing lower. The MACD is falling steeply, and the signal line is also in a downtrend, suggesting the potential for an overshooting move downward before forming a bottom. From a daily perspective, key support zones to watch are around 19,000 (first level) and 18,500 (second level). The MACD has not yet crossed below the signal line, but if a bearish crossover (death cross) occurs, a strong third wave of selling pressure could emerge. Therefore, caution is advised for long positions. However, since the MACD has not yet confirmed a bearish crossover, there is also the possibility of a rebound off the signal line. It is crucial to wait for a confirmed trend reversal before taking long positions.
On the 240-minute chart, strong sell signals have emerged, leading to a steep decline. The current price action resembles the movement seen on February 21, but since the bottom is not yet clear, it is best to adopt a conservative approach. For short positions, the 3-day moving average can be used as a reference level. For long positions, the lower Bollinger Band may provide a short-term buying opportunity. As today marks the last trading day of the month, watch closely to see if the Nasdaq reaches the 20-month MA or ends the month with a lower wick.
Crude Oil
Oil closed lower, facing resistance at $70. It has fallen back below the 5-day MA, trapping the price within a range-bound structure. On the weekly chart, oil was rejected at the 10-week MA, and since the MACD has not yet formed a bullish crossover, there is a chance that oil could retest its previous double-bottom level. A consolidation phase between the 5-week and 10-week MAs appears likely.
On the daily chart, as the price corrected, the MACD began converging with the signal line. If oil retraces to around $68, a short-term buying opportunity may arise. For oil to resume its uptrend, it needs to pull back toward $68, rebound, and break above $70 with strong momentum. However, this move would likely require a global catalyst. On the 240-minute chart, both the MACD and signal line remain above the zero line, suggesting a higher probability of a rebound and a golden cross formation. Overall, the best approach is to focus on dip-buying opportunities during this phase.
Gold
Gold closed higher, breaking to a new all-time high on the daily chart. Last week, there was a possibility of a pullback toward the 5-week MA, but the MACD has turned upward, surpassing its previous high, reducing the likelihood of a bearish divergence and increasing the probability of further upside. However, since gold has not yet tested the 5-week MA, a short-term correction remains a possibility. On the daily chart, buying opportunities were available at the 3-day MA following a strong bullish candle. A pullback to the 5-day MA within the next few days remains possible, and if this happens, it could present another dip-buying opportunity. Based on wave analysis, gold could target around 3,216. To confirm this upside scenario, the daily chart must show stronger bullish momentum, eliminating the risk of MACD divergence.
On the 240-minute chart, gold has been experiencing strong upward momentum, making it a buy-on-dips market. However, for a more comfortable long position, the MACD needs to exceed its previous peak. Overall, a long-only strategy remains preferable. For short positions, it is difficult to pinpoint the exact peak, so strict stop-loss management is essential. This week, key economic events include the ISM Manufacturing & Services PMIs and Friday's U.S. jobs report, which could increase gold's volatility. Stay cautious.
Today marks the final trading session of March. Tariff-related news and gold’s record highs indicate rising market volatility. Stay adaptive to the market’s movements and trade safely as we close the monthly candle.
Wishing you a successful trading day!
If you like my analysis, please follow me and give it a boost!
For additional strategies for today, check out my profile. Thank you!

Crude Oil (WTI) Bullish Breakout – Eyes on $78.47!🚀 Crude Oil (WTI) Bullish Breakout – Eyes on $78.47! 🚀
📊 Trade Setup:
Entry Price: $73.12
Take Profit 1: $73.99
Take Profit 2: $76.20
Take Profit 3: $78.47
Stop Loss: $71.21 (below key support zone)
📈 Analysis:
After months of trading in a range, WTI Crude Oil has broken above the upper boundary of the channel , signaling a bullish breakout. This breakout is supported by:
1️⃣ China's Economic Optimism: Growth pledges and potential stimulus are boosting demand expectations.
2️⃣ Technical Momentum: Key resistance at $71.50 and $74 has been breached, opening the path toward higher targets.
3️⃣ Tight Weekly Chart Range: A big move was anticipated, and the bulls delivered!
🎯 Targets:
With momentum on our side, we’re targeting:
$73.99: Quick resistance retest.
$76.20: Alignment with prior highs.
$78.47: Major resistance and breakout zone.
🔹 Risk Management:
Stop loss at $71.21, well below the key support zone, ensures controlled risk in case of reversal.
⚡ Are you riding the breakout, or watching from the sidelines? Let me know your thoughts below! ⚡

How I Used COT to Profit in Crude Oil I show you my process from start to finish.
How to identify:
If a market is setup for a move of some significance.
How to confirm a setup using accumulation/distribution measurements & seasonals.
Finally, how to utilize technical methods to enter into a trade.
