Weekly Market Forecast WTI CRUDE OIL: Bearish! Wait For SellsThis forecast is for the week of March 17 - 21st.
WTI Crude Oil is in consolidation, but forming a wedge pattern. As the market condenses, we no watch out for a breakout that could go in either direction. But if we take note of the Weekly bearish FVG that formed last week, we simply wait for price to sting into it and use it to move lower. The market is weak, and has been trending down for over two months now. Using the trend and the -FVG, the higher probability is for price to continue lower, as long as the -FVG holds.
Check the comments section below for updates regarding this analysis throughout the week.
Enjoy!
May profits be upon you.
Leave any questions or comments in the comment section.
I appreciate any feedback from my viewers!
Like and/or subscribe if you want more accurate analysis.
Thank you so much!
Disclaimer:
I do not provide personal investment advice and I am not a qualified licensed investment advisor.
All information found here, including any ideas, opinions, views, predictions, forecasts, commentaries, suggestions, expressed or implied herein, are for informational, entertainment or educational purposes only and should not be construed as personal investment advice. While the information provided is believed to be accurate, it may include errors or inaccuracies.
I will not and cannot be held liable for any actions you take as a result of anything you read here.
Conduct your own due diligence, or consult a licensed financial advisor or broker before making any and all investment decisions. Any investments, trades, speculations, or decisions made on the basis of any information found on this channel, expressed or implied herein, are committed at your own risk, financial or otherwise.
Crude Oil

Bearish Structure & Gap Fill Target📊 Crude Oil Market Analysis – Bearish Structure & Gap Fill Target 🚨
📉 Crude oil is showing a bearish candle structure, indicating potential downside.
🔄 Bearish Outlook:
✅ Key Target: Price could drop to $67.31 to fill the gap.
✅ Bearish Confirmation: As long as price remains below the bearish candle formations, the trend stays bearish.
✅ Reversal Trigger: A breakout above the bearish candle structure would invalidate the bearish setup.
📌 Until a breakout occurs, the trend remains bearish! Watch price action closely.

High Gas Prices By Xmas.We still have 9M left to go but I’ll say it now: price will soar to $113.186 by year end.
Watch and see about it.

Overall downtrend but potential breakout is forming.Overall, the pitchfork indicates a downtrend in crude oil. However, a potential breakout is forming. If successful, we could see a price increase in the short term.

Crude Oil: Is There More Downside?Following crude oil’s rebound from its September 2024 low of $65.20, the risk of a reversal remains uncertain amid ongoing bearish pressures.
Key Events This Week:
Chinese deflation risks
OPEC monthly report
US CPI data
Trade war developments
Potential Scenarios:
🔻 Bearish Scenario:
A clean break below $65 could extend losses toward $63.80, a key level that may determine whether the market holds neutral and rebounds or breaks further into a steeper bearish trend towards $62, $60, and $55 (the 0.618 Fibonacci retracement of the 2020–2022 uptrend).
🔺 Bullish Scenario:
If the rebound sustains above $67, resistance levels at $68.70, $70.80, and $72.50 could come back into play.
- Razan Hilal, CMT

Weekly and Monday analysis for Nasdaq, Oil, and GoldNasdaq
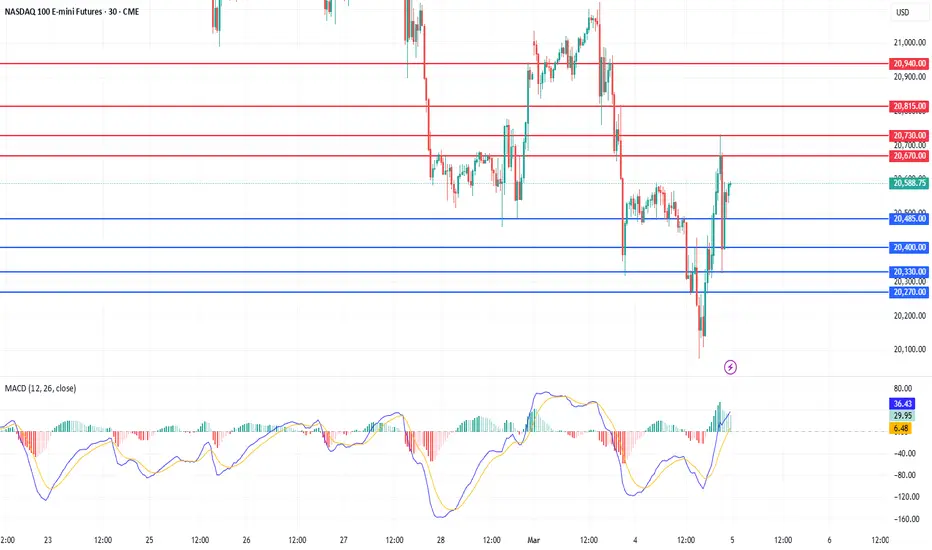
The Nasdaq closed higher, forming a long lower wick as it rebounded. On continuous futures, the index bounced off the 60-week MA, while the daily chart shows a recovery after briefly dropping below the 240-day MA. Looking at the weekly chart, two weeks ago, a large bearish candle decisively broke below a key range, and last week, the Nasdaq failed to break above the 3-week MA, leading to further downside. This week, however, a rebound toward the 5-week MA near 21,050 remains possible.
On the daily chart, the Nasdaq successfully found support near 19,800, forming a potential range-bound structure. Although a technical target exists at the 60-day MA near 21,500, the downtrend remains strong, meaning that a full recovery may take time. Instead of an immediate rally, the Nasdaq may consolidate around the 240-day MA, making a range-trading strategy more effective.
On the 240-minute chart, the Nasdaq formed a bullish divergence, triggered a golden cross, and started to rebound. As long as price continues to base at the lows, further buying attempts may emerge, making chasing short positions risky. This week, traders should monitor Wednesday’s CPI report and Thursday’s PPI report, as both could increase market volatility.
Crude Oil
Crude oil closed higher, supported by potential sanctions on Russia. On the weekly chart, oil dropped to the 240-week MA before rebounding, but last week’s bearish close triggered a sell signal. Since this sell signal occurred near the zero line, further downside remains possible, making chasing long positions risky. A key upside level to watch is the 3-week MA at $68, while support is expected around the $66–67 range, where a short-term double-bottom formation could develop.
On the daily chart, if oil continues to rebound, traders should watch for resistance at $68, while stopping out below the $65 previous low remains essential. On the 240-minute chart, the MACD has formed a golden cross, with momentum gradually shifting higher. However, since the gap between the MACD and the zero line remains large, selling pressure could reemerge on rallies. Traders should focus on buying dips at strong support levels while keeping strict stop-loss management in place.
Gold
Gold closed lower, remaining within a range-bound market structure. The Non-Farm Payroll (NFP) report triggered significant volatility, but the daily MACD is now turning downward, increasing the risk of additional selling pressure.
On the weekly chart, gold is forming a long-term consolidation range. If this week’s candle closes lower, the weekly MACD may form a bearish crossover, increasing the likelihood of a negative divergence pattern. This makes chasing long positions riskier.
On the daily chart, despite short-term weakness, the MACD and signal line remain far from the zero line, meaning that intermittent rebound attempts are still possible. For now, the lower Bollinger Band serves as key support, reinforcing a range-bound strategy. On the 240-minute chart, $2,940 has become a strong resistance level, and a sell signal has been triggered. For now, traders should focus on selling into rallies while looking for buying opportunities at lower levels. If gold breaks above $2,940, a third wave of buying momentum could emerge, making it essential to adapt to market conditions dynamically. Gold is also likely to react to Wednesday’s CPI and Thursday’s PPI reports, increasing potential volatility.
U.S. market volatility is rising sharply, as seen in the VIX index, which surged above 22 last week. Using technical tools like VIX analysis, moving averages, and MACD strategies can help improve market navigation. Stay disciplined, manage risk carefully, and have a successful trading week! 🚀
If you like detailed this analysis and today's strategy, please follow me and give it a boost!

The Inevitable Descent of UKOILIn the shadow of a market that continues to revel in its own delusions, I find myself compelled to address the elephant in the room – or rather, the oil in the barrel that is UKOIL. We stand on the precipice of what I predict to be a significant correction, one that will see UKOIL prices plummeting to the region of $48 per barrel.
Why the Fall?
OPEC+'s decision to phase out additional output cuts by September 2025, announced in June last year, is a clear signal. The return of 2.2 million barrels per day to the market, should market dynamics permit, will flood an already saturated market. Despite the rhetoric of control, the reality is that OPEC+'s spare capacity, currently at 5.9 million barrels per day, limits any significant price increase. This, coupled with near-record production levels from non-OPEC countries like the United States, sets the stage for an oversupply scenario. The notion that demand will continue to grow unchecked is flawed. Global oil consumption growth is expected to slow dramatically from 2.3 million barrels per day in 2023 to 1.1 million in 2024, with similar levels in 2025. This deceleration is driven by multiple factors including the rise of electric vehicles, increasing efficiency in traditional vehicles, and a stuttering economic recovery in major markets like China. The market's current bullishness is more sentiment than substance. Indicators like the Stoch RSI currently at 77.9 suggest we are nearing overbought territory, a strong indication that a reversal could be imminent. This high reading, combined with the parabolic SAR signaling an upward trend now, might just be the last gasp before a significant correction.
The technical and fundamental analyses converge on a bearish outlook. Long Forecast anticipates Brent oil, which closely tracks UKOIL, to hover around $60-$65 by 2026 before a potential rebound. This, combined with other forecasts suggesting a further decline in demand, paints a picture not of a soft landing, but of a sharp descent. If we extrapolate current trends and market sentiment shifts, $48 is not just a possibility but a probable near-term floor.
Investors should consider reducing exposure to oil-related equities or hedge against the risk through diversification into non-correlated assets. For those with the stomach for risk, this scenario presents a unique opportunity to short UKOIL CFDs. In closing, let us not be swayed by the siren song of current market highs. The fundamentals, much like gravity, will eventually pull prices back to earth. Prepare for the storm, for it's not a matter of if, but when.
Horban Brothers.
Alex Kostenich

CRUDE OIL Swing Long! Buy!
Hello,Traders!
CRUDE OIL fell down
Sharply but the a horizontal
Support was hit around 65.25$
And the price established a
Double bottom pattern so
We will be expecting a
Local bullish rebound
Buy!
Comment and subscribe to help us grow!
Check out other forecasts below too!

Oil Prices Plummet as Trade Tensions RiseOil prices took a hit after Trump's tariffs were announced, and it's essential to understand the reasoning behind this drop.
When US imposed tariffs on Chinese goods, China retaliated by placing tariffs on US goods, including oil. This move led to a decrease in oil demand from China, which is the world's largest oil importer. As a result, oil prices plummeted.
◉ Key Factors Behind the Decline
● Trade Tensions: The escalation of trade tensions between the US and China led to a decrease in oil demand, causing prices to drop.
● China's Tariffs on US Oil: China's decision to impose tariffs on US oil imports reduced demand for US oil, contributing to the price decline.
● Global Economic Slowdown: The ongoing trade tensions and tariffs have led to a slowdown in global economic growth, further reducing oil demand and prices.
● Increased Oil Production: The US has been increasing its oil production, leading to a surplus in the market and contributing to the decline in oil prices.
◉ Technical Observations
● A notable decline in oil prices has been observed since mid-January 2025.
● Prices are currently hovering near the critical support zone around $66, a level that has historically provided a floor for prices.
● If this support level is breached, it may trigger a further decline in oil prices.

WTI crude looks set to break $65 handleCrude oil prices have dropping another 4% with Brent reaching its lowest levels since December 2021, after breaking the September 2024 low of $68.60. If Brent is anything to go by, WTI looks like it too will break its corresponding September 2024 low of $64.95 - and therefore the $65.00 psychological level - soon.
Oil price prices have dropped on concerns about the economic impact of Trump's tariffs and after the OPEC+ decided to proceed with a planned April output increase.
Is WTI heading down to $60?
By Fawad Razaqzada, market analyst with FOREX.com

Recap: Short below LIS/Yearly Open Crude OilNYMEX:CL1!
Another day and EdgeClear brings you another recap where one of the highlighted scenarios in our weekly plan for WTI crude oil, published on February 24, 2025 , played out as expected.
Our Scenario 3 looked at price discovery extending the 2025 range into Q4 2024 lower distribution. Our analysis indicated an initial move lower bouncing from CVPOC 2022 support. The key was price moving below key LIS/yearly open. We did not see a bearish head and shoulders pattern develop, however, the rest of the plan played out as expected.
Note the price action till Friday, 28th Feb 2025.
We have been consistently providing traders with a roadmap for WTI crude oil with our thoughts and opinions on the market. WTI crude oil is a fundamental product that is affected by several factors, such as: macro, geopolitical, economic, supply, demand, and oil production dynamics.
Our analysis considers these developments along with auction market theory and key indicators that may be important to watch at times. As an example, for our January 13, 2025, blog , we noted increased volume with increased open interest that drove bullish sentiment in crude oil prices. We also highlighted potential short opportunities that played out per our plan.
For last week’s blog, we noted the overall trend in volume and open interest falling, indicating a potential move lower. This combined with multiple tests of our key LIS/ yearly open, strengthened our thesis for further price discovery lower.
In our blog, we have highlighted two key ranges:
$70 - $75 - Q1 2025 Value Area
$65 - $70 - Q4 2024 Lower Distribution
Focus is shifting towards oil market fundamentals i.e., supply, demand, and production outlook.
While headline news may drive short-term and intraday volatility, investors and market participant’s focus will shift towards oil market fundamentals. On March 3rd, 2025, OPEC+ reaffirmed its decision from December 5, 2024, to proceed with gradual and flexible return of 2.2 mbpd voluntary cuts, starting April 1, 2025. It provided a detailed table along with a cautious approach should this decision require any amendments. In our analysis, while trade war and tariff tantrum create uncertainty around demand outlook, any news providing clarity on tariffs will be considered net positive.

USOIL WTI The price was in a downward trend, moving within a descending channel. A breakout from this channel indicates potential trend reversal or correction.
Consolidation Zone Identified:
The price is currently in a consolidation phase (marked in orange).
A breakout above this zone could confirm bullish momentum, while rejection could push it lower.
Key Resistance Levels for Upside Targets:
If the price breaks above the consolidation zone, it could rally toward 71.246 and 72.103 as potential resistance levels.
Green arrows indicate bullish breakout targets.
Key Support Levels for Bearish Move:
If the price fails to break above the consolidation zone, A further breakdown below this support level could push the price toward 68.400 and 66.888, the next major support.
Conclusion:
The next major move will depend on how price reacts to the consolidation zone. A breakout above could lead to bullish targets, while failure could send prices lower toward the next major support. Traders should watch for confirmation before entering trades. 🚀📉

Today analysis for Nasdaq, Oil, and GoldNasdaq
The Nasdaq closed lower as market volatility increased due to tariff concerns. Although the index dropped below the 240-day moving average, it formed a lower wick, indicating an attempt to establish a short-term bottom. On continuous futures, the 240-day MA is slightly below 20,000, meaning that the 20,100–20,000 zone is a key support area where a technical rebound is likely following the recent sharp decline. If the market falls into this zone, it could present a swing buying opportunity. Since the daily MACD and signal line are dropping steeply, a sideways consolidation period may be necessary to reduce their angle and separation before further directional movement.
Given that the Nasdaq rebounded strongly after forming a lower wick yesterday, a pullback in pre-market trading could provide a buy-the-dip opportunity. Additionally, potential bullish catalysts include today’s ADP Non-Farm Employment data and Friday’s Non-Farm Payroll report.
On the 240-minute chart, the index is forming a bullish divergence and attempting a golden cross, reinforcing the buy-the-dip strategy at current levels. Therefore, chasing shorts is not advisable, as the Nasdaq has entered a more attractive buying zone. A range-trading approach remains effective, with a preference for buying near support.
Crude Oil
Crude oil closed lower, finding support near previous demand zones. Despite the continued downtrend, the $66–67 range remains a strong support area, making it a potential rebound zone for technical buyers. However, on the daily chart, the MACD and signal line are sloping downward sharply, meaning that selling pressure could intensify further. Long positions should be initiated as close to the lower support zone as possible.
On the 240-minute chart, the MACD has formed another bearish crossover, confirming strong selling momentum. However, when compared to the previous MACD level near $68.50, price has declined further, but the MACD has not dropped as low, suggesting a potential bullish divergence. Since this zone has historically acted as strong support, a buy-the-dip strategy remains preferable, but traders should remain cautious of today’s Crude Oil Inventory report, which could lead to increased volatility.
Gold
Gold closed higher, successfully rebounding from support. Yesterday, gold reached the previously projected target of 2,925, aligning with the 240-day moving average characteristics.
If gold continues higher, the 2,940 level will act as resistance, as this is a previous supply zone on the daily chart. Therefore, further upside should be monitored carefully before making new decisions. Since the daily MACD and signal line remain widely separated, this is not an ideal condition for chasing long positions. Even if gold extends its rally, a pullback is likely, making buying dips a safer approach.
On the 240-minute chart, the MACD formed a golden cross, leading to a sharp rally. As expected, price reached the 60-day MA following the 240-day MA bounce. However, while the MACD has moved above zero, the signal line is still below zero, meaning that another corrective phase could occur before further upside. Additionally, there is a possibility that gold could revisit the 2,850 support zone to form a double-bottom structure, making buying dips a better strategy than chasing breakouts. Overall, a range-trading strategy—buying low and selling high—remains effective, and today’s ADP Non-Farm Employment data could introduce market volatility.
As market conditions shift, risk management remains crucial. Stay disciplined, adapt to volatility, and trade with confidence. Wishing you a successful trading day! 🚀
If you like my analysis, please follow me and give it a boost!
For additional strategies for today, check out my profile. Thank you!
USOIL - at breakout level? what's next??#USOIL.. market perfect breakout in yesterday and now again market just near to his today breakout level or resistance area that is around 67.85-90
keep close that level and if that is clear breakout then we can expect a further drop...
dont be lazy.
good luck
trade wisely

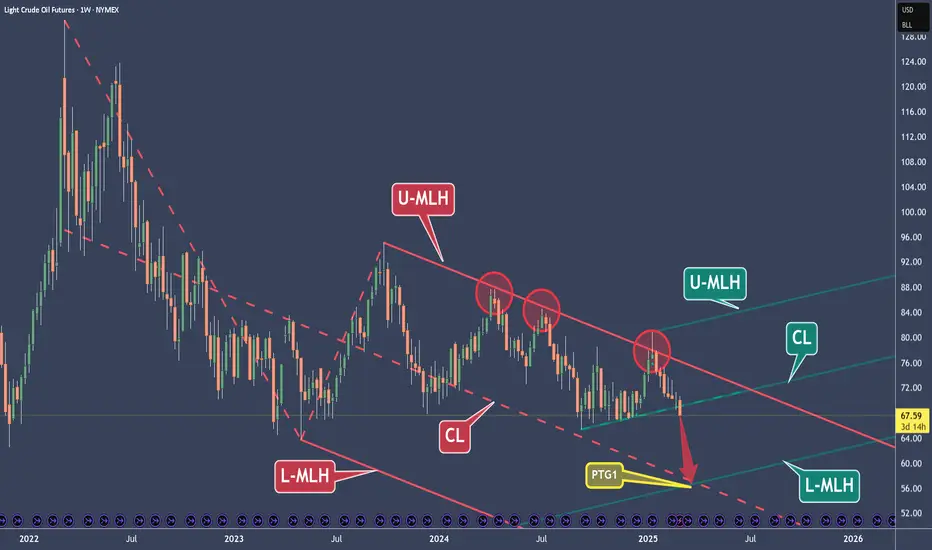
Crude Oil – A $10 Short with a Valuable LessonThe price hit the Upper Median Line Handle (U-MLH) three times and was rejected each time (red circles). These were all high-potential short trade opportunities.
However, none of these short trades managed to reach the Profit Target Goal (PTG) at the Center Line (CL). When the price repeatedly fails to hit the CL, it often builds up momentum for a larger move.
The last short opportunity from the U-MLH was at Circle #3. If you missed it, you have another chance now. Breaking the "shelf" (the petrol support line) is just like breaking a Median Line or a Center Line. It’s not magic—though it may sometimes seem like it.
The three slanted petrol lines extending to the right function the same way as a fork. So, we just broke the (petrol) Center Line, right?
Now, where is the price likely to go after breaking this (petrol) Center Line?
That’s right! There is about an 80% probability that it will move towards the (petrol) Lower Median Line Parallel.
What a coincidence—it aligns exactly with the red Center Line!
Of course, this is all based on probabilities, not guarantees. We can't predict the future, but we can rely on rules, statistics, and knowledge.
I hope you learned something today.
If you enjoy my work, I’d appreciate it if you like and share it with others.
Have a great day! 😊
Crude - Further downside expectedFollow up on this:
Price shot up to test the triangle trendline once again. Now the price is trading very close to a very strong support level.
Based on Elliott Waves, I expect this level to break to make a new low, at least till $58-$60. Since this is the last leg of correction, it is likely to be a sharp drop.

Today analysis for Nasdaq, Oil, and GoldNasdaq
The Nasdaq closed sharply lower, rejecting resistance at the lower boundary of its previous range and dropping to the 240-day moving average. Testing the 240-day MA was an expected technical move, and after facing resistance at the 120-day MA, the index retested the 20,300–20,500 zone. This price action has formed the head of a head-and-shoulders pattern, making it crucial to watch for potential rebound attempts. However, since both the MACD and signal line have moved below the zero line, the market remains in a confirmed downtrend, making selling into rallies the preferred strategy.
As mentioned previously, if the Nasdaq finds support near the 240-day MA, a technical rebound toward the 60-day MA remains possible, as per moving average behavior. On the 240-minute chart, the index is holding support between 20,300–20,500 and still maintaining a golden cross. If the MACD avoids a bearish crossover with the signal line, the likelihood of a rebound increases, making buying near support a reasonable approach. However, the previous range low near 21,000–21,100 will likely act as strong resistance, making selling into rallies favorable. While no major economic reports are scheduled today, market volatility could increase due to comments from President Trump, so traders should maintain strict risk management.
Crude Oil
Crude oil closed lower following news that OPEC+ plans to increase production. On the daily chart, both the MACD and signal line are sloping downward, confirming a gradual downtrend. However, the $66–67 zone remains a strong support level, while the $70.50 level is the key resistance to watch. For now, trading within the range is the most effective strategy. If oil fails to stage a recovery this week, the weekly chart could confirm a sell signal, reinforcing further downside risk.
On the 240-minute chart, the MACD has formed another bearish crossover, suggesting that selling pressure is continuing. Instead of chasing shorts, traders should wait for a pullback to support near $66–67 and consider buying on dips. Given that market flows remain mixed, oil is likely to trade sideways, making range-bound trading the most effective approach for now.
Gold
Gold closed higher, finding support near previous highs. On the daily chart, the index rebounded to the 5-day moving average, and since both the MACD and signal line remain above zero, buying pressure remains intact. However, given the wide gap between the MACD and the signal line, even if gold continues higher, it may face another pullback, making chasing long positions risky. On the weekly chart, the bullish trend remains intact, but since gold is now approaching the 5-week moving average, breaking above resistance may take time.
On the 240-minute chart, a strong rebound emerged from the previous resistance zone, which aligns with the 240-day MA. The MACD has also formed a golden cross, meaning that if the uptrend continues, price targets could extend toward the 60-period MA on the 240-minute chart, potentially reaching the 2,925 area. However, since this initial move is a single-bottom formation, the market could attempt to form a double-bottom before continuing higher, making buying at lower levels more favorable. Gold could also enter a consolidation phase ahead of Friday’s Non-Farm Payroll (NFP) report, so traders should anticipate range-bound price action.
Risk management remains key, and I sincerely hope that March brings strong trading opportunities for all of you. Wishing you a successful trading day!
If you like my analysis, please follow me and give it a boost!
For additional strategies for today, check out my profile. Thank you!

Market Analysis: Oil Price Eyes RecoveryMarket Analysis: Oil Price Eyes Recovery
Crude oil price is recovering and it could climb further higher toward the $71.80 resistance.
Important Takeaways for Oil Price Analysis Today
- Crude oil prices are moving higher above the $68.90 resistance zone.
- There is a connecting bullish trend line forming with support at $69.50 on the hourly chart of XTI/USD at FXOpen.
Oil Price Technical Analysis
On the hourly chart of WTI Crude Oil at FXOpen, the price started a decent increase against the US Dollar. The price gained bullish momentum after it broke the $68.90 resistance.
The bulls pushed the price above the 50-hour simple moving average and the RSI climbed toward 65. There was a clear move above the 50% Fib retracement level of the downward move from the $71.12 swing high to the $68.24 low.
Immediate resistance is near the $70.45 level. It is close to the 76.4% Fib retracement level of the downward move from the $71.12 swing high to the $68.24 low.
If the price climbs further higher, it could face resistance near $71.10. The next major resistance is near the $71.80 level. Any more gains might send the price toward the $72.50 level.
Conversely, the price might correct gains and test the $69.50 support. There is also a connecting bullish trend line forming with support at $69.50 and the 50-hour simple moving average.
The next major support on the WTI crude oil chart is near the $68.90 level. If there is a downside break, the price might decline toward $68.25. Any more losses may perhaps open the doors for a move toward the $66.50 support zone.
Trade on TradingView with FXOpen. Consider opening an account and access over 700 markets with tight spreads from 0.0 pips and low commissions from $1.50 per lot.
This article represents the opinion of the Companies operating under the FXOpen brand only. It is not to be construed as an offer, solicitation, or recommendation with respect to products and services provided by the Companies operating under the FXOpen brand, nor is it to be considered financial advice.

Monthly, Weekly and Monday analysis for Nasdaq, Oil, and GoldNasdaq
The Nasdaq closed higher, finding support at the lower Bollinger Band on the weekly chart. Due to the sharp decline last week, the 20,500 to 20,300 range was a technical rebound zone.
On the monthly chart, February closed with a bearish candle, bringing the index below the 5-day moving average and forming a range with the 10-day MA. For March, the 3-day and 5-day moving averages will act as resistance, while the 10-day MA serves as support. Since the monthly MACD is still above the signal line, even if corrections occur this month, rebound potential remains, meaning traders should be cautious about chasing shorts aggressively.
On the weekly chart, the Nasdaq fell below the 20-week MA, accelerating the sell-off. The MACD continues to slope downward, keeping further downside potential open, but since the signal line is still above zero, the index may consolidate between the 3-week and 5-week moving averages, making a range-bound strategy effective this week.
On the daily chart, both MACD and the signal line have dropped below zero, confirming a bearish market structure. The 21,000 level was broken decisively with a large bearish candle, meaning that if price struggles to reclaim this level, further downside toward the 240-day moving average is possible. If the Nasdaq falls to the 240-day MA, traders should prepare for a potential technical bounce, as historically, this level has provided support. Reviewing moving average dynamics could be helpful for understanding this scenario.
On the 240-minute chart, Friday’s low produced a strong rebound, making the MACD's potential golden cross a key signal to watch. As long as the recent lows hold, buying opportunities may exist, but since the signal line remains far above zero, selling pressure may persist on any rallies. Traders should avoid chasing long positions and focus on range trading. This week, traders should keep an eye on China’s National People's Congress (NPC) on Tuesday and the U.S. Employment Report on Friday, as both events could increase market volatility later in the week.
Crude Oil
Crude oil closed lower within a narrow range, continuing its sideways movement. On the monthly chart, February closed with a bearish candle, causing the MACD to turn downward while still maintaining a range-bound structure. Although the MACD and signal line remain above zero, buyers are still attempting to hold support within this range. For now, oil should be traded as a large range-bound market.
On the weekly chart, last week’s doji candle suggests indecision, and this week, the MACD has crossed below the signal line, triggering a sell signal. However, since a weekly close is needed to confirm this, the possibility of a trend reversal remains open. If oil continues lower this week, the sell signal will be fully confirmed, but if price rebounds, last week’s doji candle could mark a reversal point. Key bullish catalysts include Trump’s potential tariffs on Canada and Mexico, as well as the possibility of stricter oil sanctions on Venezuela. Meanwhile, bearish factors include economic slowdown fears reducing oil demand.
On the daily chart, breaking above $70 remains the key bullish trigger, but since the MACD has yet to form a golden cross, confirming an end to the downtrend is premature. On the 240-minute chart, the MACD has formed a golden cross, indicating a potential recovery after a pullback. For now, traders should buy dips cautiously, but breaking above $70 remains the key factor for further upside confirmation.
Gold
Gold closed sharply lower, forming a large bearish candle. On the daily chart, gold has fallen from previous highs to the lower Bollinger Band, meaning that additional downside (overshooting below support) remains possible.
On the monthly chart, gold formed a doji candle, indicating uncertainty. If gold found support at the 3-day MA last month, this month, traders should watch for support at the 5-day MA, as it could provide a buying opportunity on pullbacks.
On the weekly chart, gold has fallen to the 5-week MA, meaning that it has entered a range-bound structure. Since the lower support levels are still open, traders should avoid chasing long positions at highs and focus on buying lower. The U.S. Employment Report is due on Friday, which could increase volatility for gold.
On the daily chart, while the MACD is declining, the signal line remains well above zero, meaning that even if prices fall, rebound attempts are likely. On the 240-minute chart, further downside toward the 240-day moving average remains possible, but traders should watch for bottoming signals and potential support. If the MACD forms a golden cross, a strong rebound could follow, so monitoring short-term momentum shifts will be key.
February marked a transition to a range-bound market after an extended uptrend, suggesting that March could be a period of consolidation or further downside extension. Geopolitical risks have increased since Trump took office, and market volatility is rising due to key global events. Traders should focus on risk management and avoid overexposure. Wishing you a successful start to March! 🚀
If you like detailed this analysis and today's strategy, please follow me and give it a boost!

Weekly Market Forecast Mar 3-7: Stock Indices, Gold, Oil, moreThis is a FUTURES market outlook for the week of Mar 3-7th.
In this video, we will analyze the following futures markets:
ES | S&P 500
NQ | NASDAQ 100
YM | Dow Jones 30
GC | Gold
SIL | Silver
PL | Platinum
HG | Copper
The indices took a bearish turn at the end of last week. Trump announcements, tariffs, Ukraine and Russia injected uncertainty into the markets, and investors moved money into safe havens.
Patience is required to trade in this environment. Wait until there are clear signs of shifts in the market before deciding on a bias. Setup confirmations are always the best course of action.
Enjoy!
May profits be upon you.
Leave any questions or comments in the comment section.
I appreciate any feedback from my viewers!
Like and/or subscribe if you want more accurate analysis.
Thank you so much!
Disclaimer:
I do not provide personal investment advice and I am not a qualified licensed investment advisor.
All information found here, including any ideas, opinions, views, predictions, forecasts, commentaries, suggestions, expressed or implied herein, are for informational, entertainment or educational purposes only and should not be construed as personal investment advice. While the information provided is believed to be accurate, it may include errors or inaccuracies.
I will not and cannot be held liable for any actions you take as a result of anything you read here.
Conduct your own due diligence, or consult a licensed financial advisor or broker before making any and all investment decisions. Any investments, trades, speculations, or decisions made on the basis of any information found on this channel, expressed or implied herein, are committed at your own risk, financial or otherwise.

Brent UK Spot OilBrent UK Spot Oil
Brent crude is moving in a downtrend direction until
it reaches the support point at :
70.618
69.744
It is expected to change direction and move in
an uptrend direction and then reach the targets:

CRUDE OIL (WTI): Nice Setup to Sell
WTI OIL looks bearish after a test of a key daily horizontal resistance.
A formation of a head & shoulders pattern on that and a violation of its neckline
indicate a highly probable intraday bearish movement.
The price will reach at least 69.3 level soon.
❤️Please, support my work with like, thank you!❤️

USOIL - Short Trade (28th Feb 2025)This is a short trade idea on Crude Oil.
Basically, i'm not convinced of this sudden rejection. This is just manipulation to me. I want to target the liquidity resting below. I think we are going downtown to a monthly sSIBI at around 57.
Liquidity and efficiency rules the market. Everything else is nonsense.
- R2F Trading
