Oil Short SetupOil Short Setup
🔵 Entry: $64.49
🟢 TP & RR: $61.02
⛔ Stop Loss: $66.14
Trade Reasons:
✔️ 1.618 Fib Level Extension
✔️ Expecting the formation of higher high price with lower high on the Market Flow indicator (divergence)
📝 This trade will probably take a while to form and will require monitoring of the entry level, to assess the situation.
Crudeoilanalysis

Oil Long PositionOil Long Position
🔵 Entry: $62.19
🟢 TP & RR: $63.55 (2.62)
⛔ Stop Loss: $61.67
REASONS FOR THE TRADE
✔️ Resistance flipped to support
✔️ Fairly strong volume upwards
📝 I am expecting price to consolidate around the entry level and then continue trending up. Even if this long fails, I certainly don't feel comfortable shorting the trend on a move upwards (or at least until I see some divergence).

Oil Short SetupOil Short Setup
🔵 Entry: $58.51
🟢 TP & RR: $53.68 (4.24)
⛔ Stop Loss: $59.65
REASONS FOR THE TRADE
✔️ Reached upper trendline
✔️ Seems like we are going to form a lower low
✔️ Divergence in the Market Flow indicator
📝 This is continuation of the short setup I posted a few days ago (1). If you are in a trade already this additional short (2) will increase your exposure, so I suggest moving your SL down.

Oil Short SetupOil Short Setup
🔵 Entry: $58.73
🟢 TP & RR: $53.73 (2.91)
⛔ Stop Loss: $60.45
REASONS FOR THE TRADE
✔️ Reaching a strong resistance level
✔️ Market Flow Indicator seriously overbought
✔️ Ascending channel upper trendline resistance
✔️ 1.618 Fibonacci Level (although not plotted on the chart as it becomes a bit clustered)
📝 Stop Loss is above the $59-$60 resistance level, although if you want a more relaxed trade you may move the SL higher to about $61. The confluence of the three factors above makes me believe that the price is due for a pullback if not even trend reversion. I will be monitoring the entry level mentioned above and may open the position prematurely if I see that the price is getting ready to take a dive down.
Crude Oil Long SetupOil Long Setup
Entry: $53.68
TP & RR: $57.65
Stop Loss: $52.57
REASONS FOR THE TRADE
Contrary to most expectations that Oil was overpriced, it continues to trend up. I won't open a long order at the current level, nor would I short obvious strength. However, if price retraces back to previous resistance, which is now support, I am more than happy to buy. I believe we are now in a channel and we are yet to see how we go through the awaited $55-$56 level.
With that being said, we may not get filled at all. Should this be the case, we will be targeting the upper channel with a short order.

Oil Trending Up - Long PositionOil Buy Order
Entry: $52.61
TP & RR: $53.79 (3.37)
Stop Loss: $52.26
REASONS FOR THE TRADE
Price is breaking through the upper trendline and unless this is a fakeout I expect it to continue going up until the recent highest high and maybe up until the dotted resistance around $54-$55. The market Flow indicator is showing momentum up and I hate to open a position against it, so I am definitely not shorting anywhere around the current level or unless the indicator shows otherwise.
The only thing I may suggest is for you to change the SL if you are afraid you might get stopped. I have the tendency to place it quite far from the entry, but this time I am taking a bit of a risk. It's your call here.
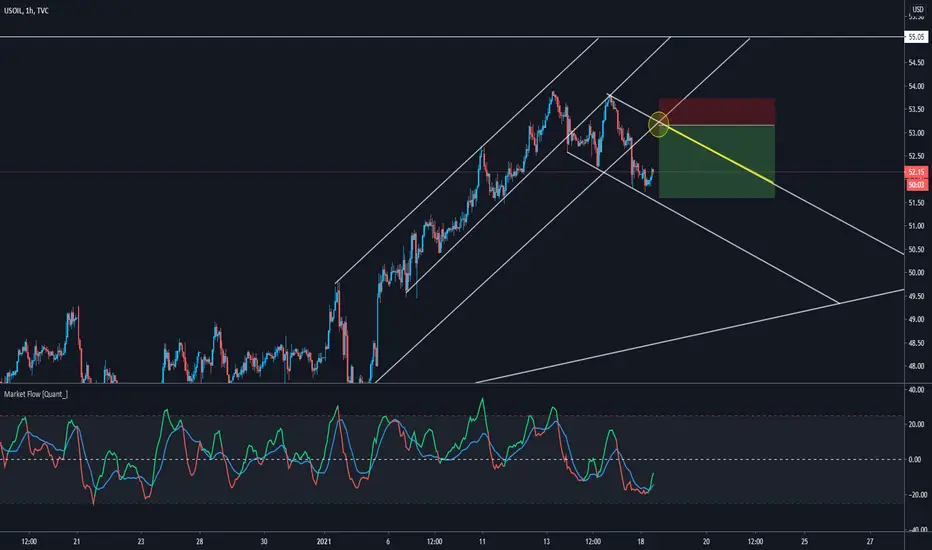
Oil Lower High Formation - Short TradeOil Lower High - Short Order
Entry: $53.55
TP & RR: $51.05 (2.38)
Stop Loss: $54.60
REASONS FOR THE TRADE
Oil has entered into a bit of a range recently, but the formation of the lower high on Friday makes me think that we are about to see another lower high, which should then form a lower low. This is where we will be looking to take profit. The Stop Loss is set well above the highest high, so if we are to break that level, then we have clear invalidation of the setup. So, pay attention to the price action around this area, and should it break it, feel free to close the trade prematurely.
The wide SL is purely for decreasing the position size, as I don't want us to lose a full 1% on a trade without a clear signal from my indicators.

USOIL ( SEE MY SNIPER ENTRY)Looking for selling as long as price broke the structure for potential downside movement

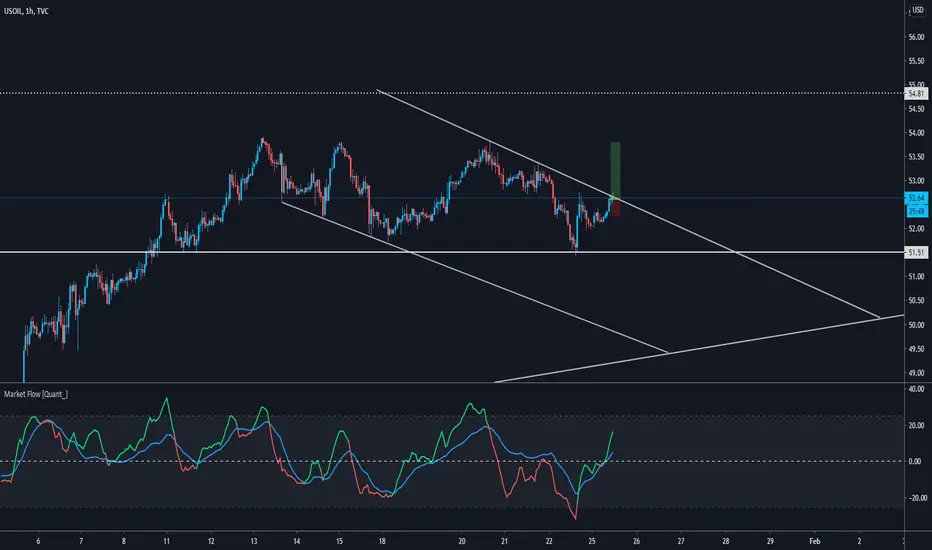
Oil Descending Channel - Short TradeOil Descending Channel - Short Position
Entry: $53.16
TP & RR: $51.61 (2.77)
Stop Loss: $53.72
REASONS FOR THE TRADE
Similarly to my previous trade idea about SPX500 from today, I am placing an alert at $53 and I will be patiently waiting to see how price action develops. You never know what's been going on in the traders' and investors' heads over the weekend, so we want to see the volume and a 1h close around that level before opening a position.
I believe we are now in a downtrend channel, which should bring more balance to that longer-than-expected move up. My entry is quite high and we very much may miss it, so I have highlighted the upper trendline as an entry-level suggestion. Any position around that level with a SL place reasonably high should provide a good trade setup. Ultimately, I am expecting that we reach the $49 level (bigger trendline) before we move up again.
Let me know what you think in the comment section below.
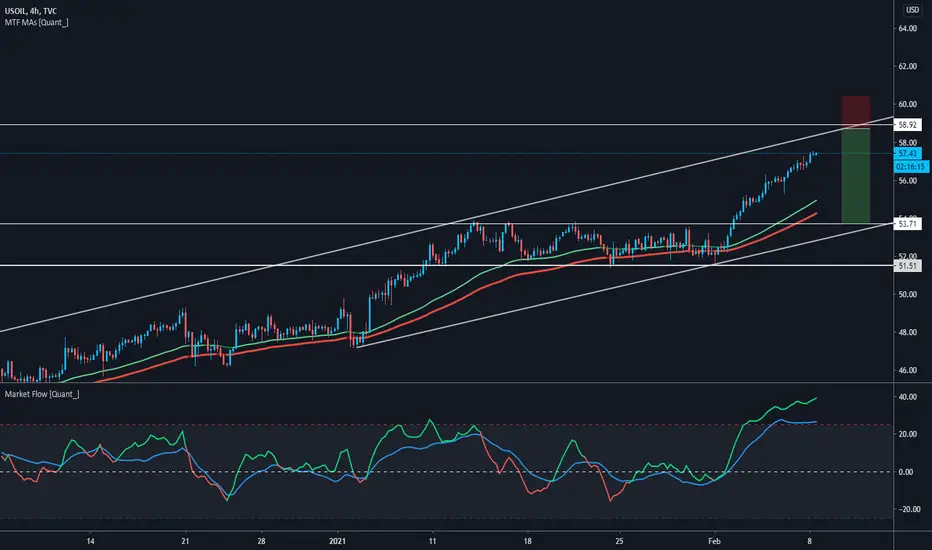
Oil Ready For a ReversalConsidering it's Friday today, I decided to post a general analysis on Oil as opposed to a specific entry-target-stop loss idea as I usually do. I refrain from keeping positions over the weekend as a lot can happen and I don't want to be overexposed. So, if it's not a setup that I feel very confident about, I rarely open trades on Friday. With that being said, here's what I am expecting to happen and I will continue to analyze over the weekend.
As most of us have noticed already, the bulls seem to be a bit exhausted from this move up and I am expecting that soon the demand for oil will decrease. As a result, we should see the bears taking control of the situation and push the price down. On a daily chart, we are reaching the overbought level, while on the 4h chart we are about to print a divergence (following my indicator Market Flow for this analysis).
I am expecting one last push up until we reach the next strong resistance (from a psychological and technical standpoint) of $55. Before we take a dive, I believe that price may go slightly above that level so that the Stop Losses are triggered and provide liquidity for the big players' short positions.
I see two other possible scenarios, although I wouldn't bet my money on them at this moment:
1) Oil breaks down from this ascending channel prematurely and starts a downtrend or starts ranging;
2) Price reaches the resistance level, makes a small pullback, and prepares to penetrate that level. If that is the case I believe we can see quite a big move up.
How do you guys see the situation? Let me know what you think in the comment section below.


Pin bar confirmation to Sell The resistance area of 43.03 was very strong and it was not broken and formed a pin bar to sell on a daily time frame given as the confirmation to sell to the support level of 36.04

Crude oil Buy / Sell Based on Fibo and GannBuy crude oil at 2857 Stop loss 2826 Target 2911 / 2945
Fibonacci and GANN always rocks follow us support us and research with us

Crude oil Buy / Sell Based on Fibo and GannBuy crude oil at 3010 Stop loss 2985 Target 3064 / 3085
Fibonacci and GANN always rocks follow us support us and research with us

Crude oil Buy / Sell Based on Fibo and GannCrude oil sell at 2997 stop loss 3019 Target expected 2940 / 2879
Fibonacci and GANN always rocks follow us support us and research with us

Crude oil Buy / Sell Based on Fibo and GannBuy crude at the bottom 2922 Stop loss 2905 Target expected is 2966 / 3015
Fibonacci and Gann always rocks follow us support us and research with us

MCX- Crude Oil Weekly analysis Hello everyone.
Crude oil also bullish and it has a good buying opportunity. Consider long above 3030 stop loss: 2948 Target : 3118

Tristar pattern on USOIL 15 minute chartHappy Friday oil traders! I just noticed this Tristar on the 15 minute chart for USOIL. I had never seen 3 dojis in a row so I had to look it up. According to my reference, a Tristar is 3 doji candlesticks that appear at the end of a run, either long or short. They typically indicate a change in direction. Considering the decline in oil today, maybe this is an indication of some upward movement. If so, trade with caution, and use your stops accordingly. Trade safe, and have a great weekend!


Crude oil Price Limited Downside, Big Upside The trend is making a symmetrical triangle.
In the symmetrical triangle, you can see the trend is descending, and it will continue to fall up to the particular targets, which are shown in the charts (T1 2886 & T2 2800 ).
After knocking the lower ascending trendline with higher lows (support), It will bounce to the upper descending trendline with the lower highs (resistance). After that, If the trend makes consecutive candles, there will be an ascending trend. B ut don't sell if the trend falls and crosses the stop loss.

Crude oil Buy / Sell Based on Fibo and GannBuy at 2922 stop loss 2898 Target 2973 / 3033
Fibonacci and Gann always rocks support us follow us and research with us

CRUDE OIL SELL SIGNAL Heytradomaniacs,
welcome to another free trade-setup.
CRUDE OIL: Day-Swingtrade-Exexution
Sell-Stop: 39,71
Stop-Loss: 40,74
Target 1: 38,90
Target 2: 39,23
Target 3: 37,28
Target for One-Target-Trader: 39,23
Stop-Loss: 100 pips
Risk: 0,5% - 1%
Risk-Reward: 2,45
LEAVE A LIKE AND A COMMENT - I appreciate every support! =)
Peace and good trades
Irasor
Wanna see more? Don`t forget to follow me.
Any questions? PM me. :-)
