US OilUS Oil - Crude Oil
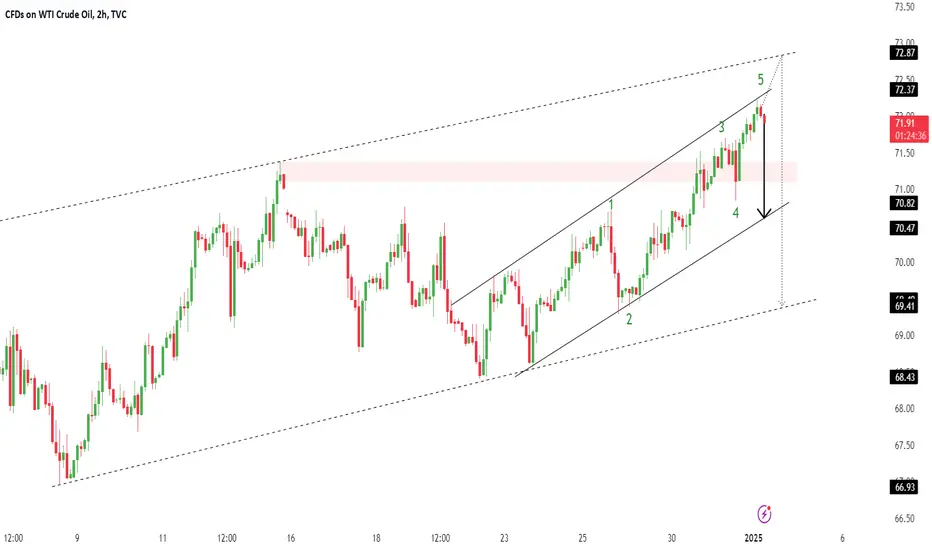
Completed " 12345 " Impulsive Waves
Break of Structure
RSI - Divergence
Bullish Channel as an Corrective Pattern in Short Time Frame
Change OF Characteristics
Crudeoilanalysis
CRUDEOIL next move for next week CRUDEOIL is now reverse to touch the Trend line and then up side move possible, once reach the Trend line then can go for long.
I am not SEBI registered analist , this is is my personal view only for education purpose,

"UKOILSPOT / BRENT CRUDE OIL" Energies Market Bullish Heist PlanHola! Ola! My Dear Robbers / Money Makers & Losers, 🤑 💰
This is our master plan to Heist "UKOILSPOT / BRENT CRUDE OIL" Energies Market based on Thief Trading style Technical Analysis.. kindly please follow the plan I have mentioned in the chart focus on Long entry. Our target is Red Zone that is High risk Dangerous level, market is overbought / Consolidation / Trend Reversal / Trap at the level Bearish Robbers / Traders gain the strength. Be safe and be careful and Be rich.
Entry 📈 : Can be taken Anywhere, What I suggest you to Place Buy Limit Orders in 15mins Timeframe Recent / Nearest Low Point take entry should be in pullback.
Stop Loss 🛑 : Recent Swing Low using 2H timeframe
Target 🎯 : 74.500
Attention for Scalpers : Focus to scalp only on Long side, If you've got a lot of money you can get out right away otherwise you can join with a swing trade robbers and continue the heist plan, Use Trailing SL to protect our money 💰.
Warning : Fundamental Analysis news 📰 🗞️ comes against our robbery plan. our plan will be ruined smash the Stop Loss 🚫🚏. Don't Enter the market at the news update.
Loot and escape on the target 🎯 Swing Traders Plz Book the partial sum of money and wait for next breakout of dynamic level / Order block, Once it is cleared we can continue our heist plan to next new target.
💖Support our Robbery plan we can easily make money & take money 💰💵 Follow, Like & Share with your friends and Lovers. Make our Robbery Team Very Strong Join Ur hands with US. Loot Everything in this market everyday make money easily with Thief Trading Style.
Stay tuned with me and see you again with another Heist Plan..... 🫂

USOIL WEEKLY MARKET ANALYSIS📊 USOIL Weekly Update
Technical View:
Not much has changed on the charts. Price remains within the expected range, waiting for a catalyst to break out.
Fundamental Highlights:
Geopolitics: TVC:UKOIL Brent hit ~$71, WTI at ~$67, driven by instability following the ousting of Syria's President.
Saudi Aramco: January crude prices for Asia slashed to early 2021 lows due to weak Chinese demand.
OPEC+: Delayed output hikes to April 2025; cuts extended through 2026.
U.S. Supply: Increased oil & gas rig activity adds pressure on prices.
Natural Gas: Futures rebounded 5% to $3.147 after last week’s losses.
🔑 Key Levels ( FX:USOIL WTI):
Bullish: Close above 21-period SMA ($72.37) targets 50-period SMA ($73.98).
Bearish: Close below $72.00 may see a drop toward ~$70.63.
📌 Trading Strategy:
Keep alerts set for key levels; patience is key as we await clearer directional moves.
💬 Let’s discuss more in comment below!
Happy Trading,
The NFX Team™ 💚
(Earlier shared this post but got taken down due to some off-platform mention (violation) - still getting used to the TV rules :) , reposted for reference purpose.)

Spot Crude Oil Energies Market Heist PlanHola! Ola! My Dear Robbers / Money Makers & Losers, 🤑 💰
This is our master plan to Heist Spot Crude Oil Energies Market based on Thief Trading style Technical Analysis.. kindly please follow the plan I have mentioned in the chart focus on Long entry. Our target is Red Zone that is High risk Dangerous level, market is overbought / Consolidation / Trend Reversal / Trap at the level Bearish Robbers / Traders gain the strength. Be safe and be careful and Be rich.
Entry 📈 : Can be taken Anywhere, What I suggest you to Place Buy Limit Orders in 15mins Timeframe Recent / Nearest Low Point take entry should be in pullback.
Stop Loss 🛑 : Recent Swing Low using 4h timeframe
Attention for Scalpers : Focus to scalp only on Long side, If you've got a lot of money you can get out right away otherwise you can join with a swing trade robbers and continue the heist plan, Use Trailing SL to protect our money 💰.
Warning : Fundamental Analysis news 📰 🗞️ comes against our robbery plan. our plan will be ruined smash the Stop Loss 🚫🚏. Don't Enter the market at the news update.
Loot and escape on the target 🎯 Swing Traders Plz Book the partial sum of money and wait for next breakout of dynamic level / Order block, Once it is cleared we can continue our heist plan to next new target.
💖Support our Robbery plan we can easily make money & take money 💰💵 Follow, Like & Share with your friends and Lovers. Make our Robbery Team Very Strong Join Ur hands with US. Loot Everything in this market everyday make money easily with Thief Trading Style.
Stay tuned with me and see you again with another Heist Plan..... 🫂

WTI is still not done. This WTI up move is being very constructive & structured. very bullish
The down moves have little to no structure and when it appeared at resistance it was quickly denied and used as support. very bullish

Crude oil battle trade:- Crude oil made it todays low and also it breaks previous day low @70.042$ and now it reversed from today low and previous day low above now trading . Crude oil have more potential for upside move for 71.200$ and 71.500$ for a day .
Stay tuned with me for more updates and follow me .

Crude OilPair : Crude Oil
Description :
Completed " 1234 " Impulsive Waves
Order Block
Bearish Channel as an Corrective Pattern in Short Time Frame
Demand Zone
Fibonacci Level - 38.20% / 50.00%

Oil Market Shift: Double Bottom Pattern Points to Higher PricesWTI oil has moved beyond its previous support level of $72 to $73, established a new base at approximately $65.6.
Subsequently, the price has entered a consolidation phase and formed a Double Bottom pattern, indicating a possible reversal in trend.
To initiate a swift upward movement, the price must overcome the immediate resistance located between $72.6 and $73.4.

US OILPair : Crude Oil
Description :
Completed " 12345 " Impulsive Waves
Break of Structure
RSI - Divergence
Bearish Channel as an Corrective Pattern in Short Time Frame
Impulse Correction

US OILPair : Crude Oil - WTI
Description :
Break of Structure
RSI - Divergence
Fibonacci Level - 78.60%
Bearish Channel as an Corrective Pattern in Short Time Frame
Completed " 12345 " Impulsive Waves

Monday evening Pondering - Crude OilSo as I stated in my last post, we would have a short range day as per previous large ranged day.
We did attack the SSL as target 1 however Im looking at price heading higher to the BSL and 1hr FVG before we head down...
Lets see what Asia and early London does..
Will update nearer to NY for Turbo Tuesday...

Crude Oil "Triangle Pattern" Target 7100 and "Wolf Wave Target"A "Triangle Pattern" has formed in Crude Oil and Downtrend has "Breakout". So market is Bullish Trend. And the Target is Triangle's Top Trendline at INR 7100. Additionally, Expect a Breakout of the Triangle Pattern.
Don't miss the "Wolf Wave Target" Opportunity. If Breakout the Triangle Pattern, then the Next 2nd Target is Wolf Wave. Refer to the below image for Wolf Wave Target Achieved in Ethereum.
Guess 3rd Target ???
I want to help people Make Profit all over the "World". Additionally, I am Eager to Receive Money form Worldwide because of my Potential. Thank you

US OILPair : Crude Oil
Description :
Fibonacci Level - 38.20%
Resistance Level
Break of Structure and Retracement
RSI - Divergence
Bullish Channel as an Corrective Pattern in Short Time Frame

Crude OilPair : US OIL - Crude Oil
Description :
Completed " 12345 " Impulsive Waves and " A " Corrective Waves
Demand Zone
Fibonacci Level - 61.80%
Consolidation Phase in Short Time Frame
Break of Structure

US OILPair : Crude Oil
Description :
Completed " 12345 " Impulsive Waves and " AB " Corrective Waves
Break of Structure
RSI - Divergence
Bearish Channel in Short Time Frame
Bullish Channel in Long Time Frame

Crude Oil - Bullish long-term - Bearish short-termCrude oil moved as we expected. Now in the next days we can expect it to follow the red scenario and reach the $75 area. If we see prices around $75 I'll put another update.
Context is BULLISH for Crude oil and DXY is showing weakness after yesterday's FOMC meeting and the market is more confident about the rate cuts in September than last week. SO BE CAREFUL with your short positions.

Turbo Tuesday Crude OilAfter a lavish bullish Monday the next target is the Daily FVG.
Pretty simple
I have a 1hr fvg box if you can see it... that is where price should stay above for price to navigate higher prices heading into NY Tuesday.

Bullish on Crude oilNYMEX:CL1!
TVC:DXY
Right now as the Crude Oil prices are at *premium and technically we are around a strong support area I think we would see a rally somewhere between 67.5 and 72.5. However, this week, we have PMI and NFP news ahead so if the reports come out to support DXY, Crude oil might stay around this area for a while (as it's seasonality suggests)
* look at the closing price of the futures contracts between July and December 2024.

Crude oil trade analysis
International oil prices fluctuated slightly on Thursday (May 30), with U.S. crude oil currently trading around $79.13 per barrel. Oil prices fell about 1% on Wednesday on worries that weak U.S. gasoline demand and economic data could lead the Federal Reserve to keep interest rates higher for longer. High interest rates aimed at countering high inflation could drag on economic growth and reduce demand for oil.
Crude oil persisted despite the headwinds yesterday. Both short positions at 79.4 and short orders at 80.2 made profits. Today's white market resistance is 80 and yesterday's high of 80.6, while support is 78.5 and 77.7. At present, the 4-hour SAR indicator has completed the top-to-bottom transition and appears at a high level. Today, Thursday, the trend continues to rebound high and bearish. Crude oil strategy: short after rebounding at 79.7, covering short positions at 80.3, stop loss at 80.7, target 78.5-78, hold if it breaks below;

Thursday Forecast Crude!So my target for this week will be the weekly open.
Simple as that sounds we do have some bsl above however Im expecting price to deliver BEARish as per HTF and the rejection for the Daily FVG
Be aware that trading is light we are in the last couple of days of the Month.

Wednesday Forecast Crude OilWe had a very expansive two days From the Bank Holiday Monday and Tuesday.
I do expect the market to slow down a little before we start to move higher to 81.50 as long as price stays above the 1hr fvg and the 1hr +ob my bias will be Bullish.
If we close bellow these pd arrays then a retracement is in order and different targets will have to be looked at.
Pretty simple

Friday retracement?? Forecasting.I am looking at crude to make a retracement today after couple days of down movement its been nice but can;t last forever.
So the arrows display where I think price will go today as a first target and second PDL
Keep it real simple on Fridays you got the weekend coming and you don't want to go into it with a loss or a win stay neutral.
